. 2023 Apr;26(4):555-569.
doi: 10.1038/s41593-023-01271-1. Epub 2023 Mar 16.

Oligodendrocyte death initiates synchronous remyelination to restore cortical myelin patterns in mice

Affiliations

Oligodendrocyte death initiates synchronous remyelination to restore cortical myelin patterns in mice

Timothy W Chapman et al. Nat Neurosci. 2023 Apr.

Abstract

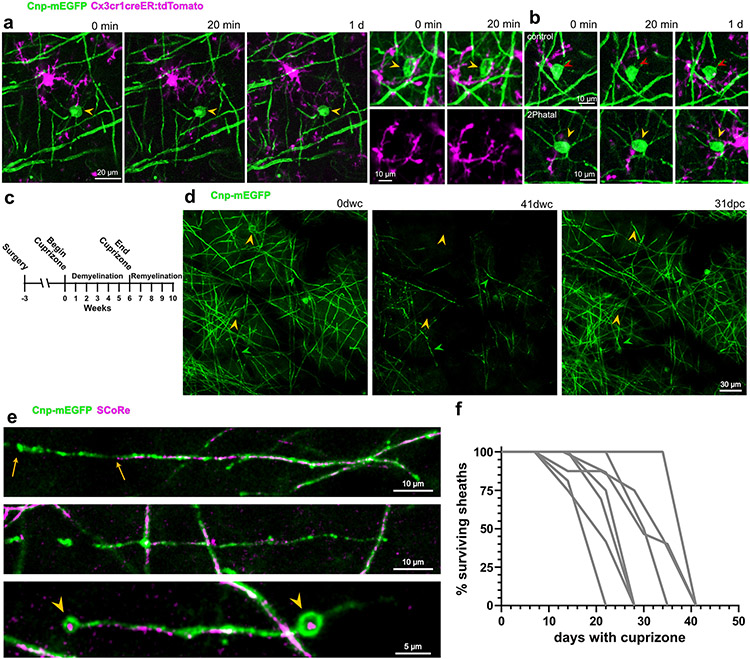
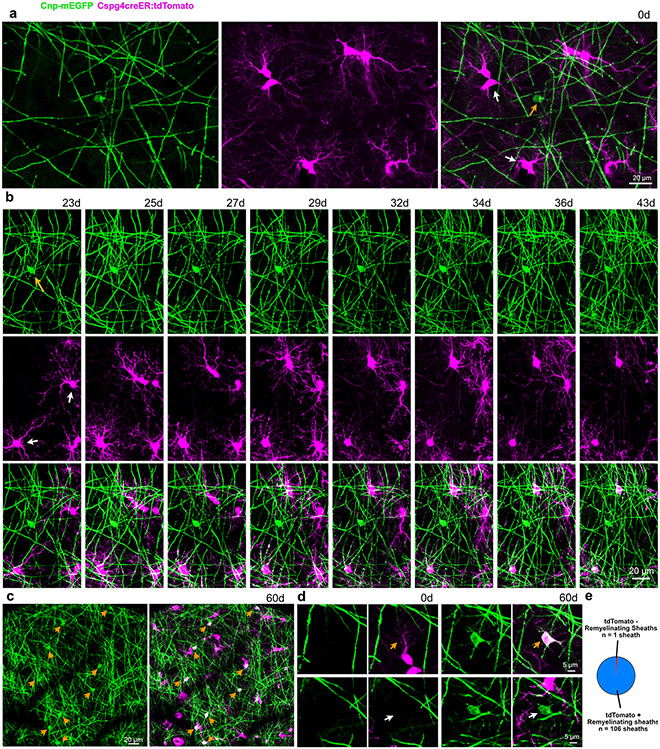
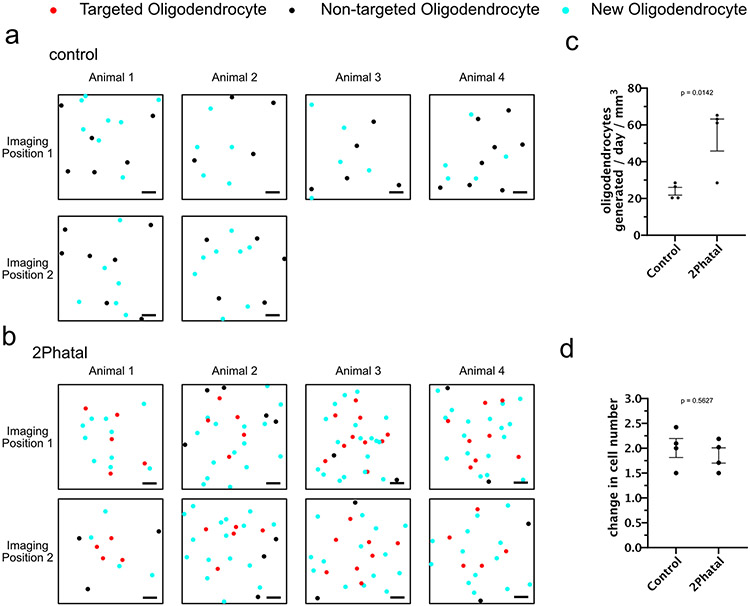
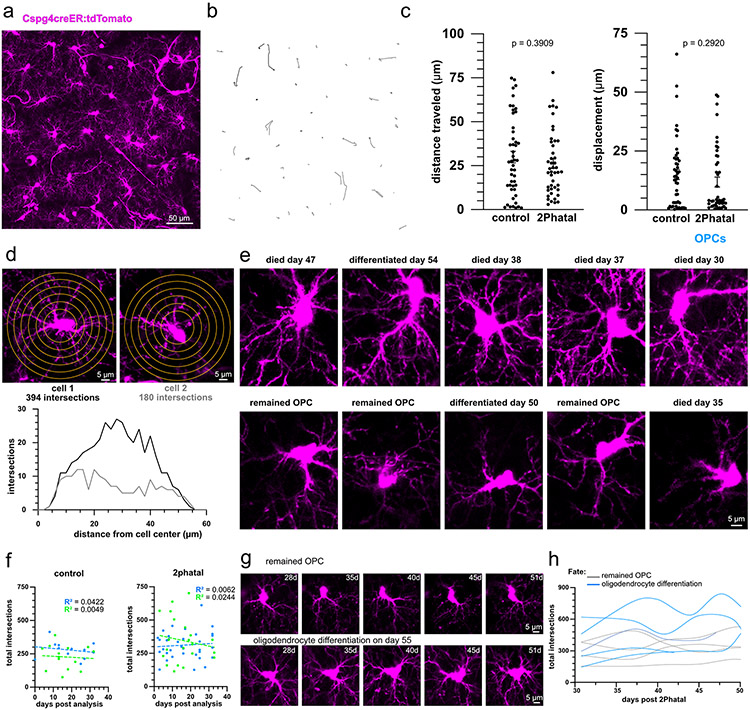
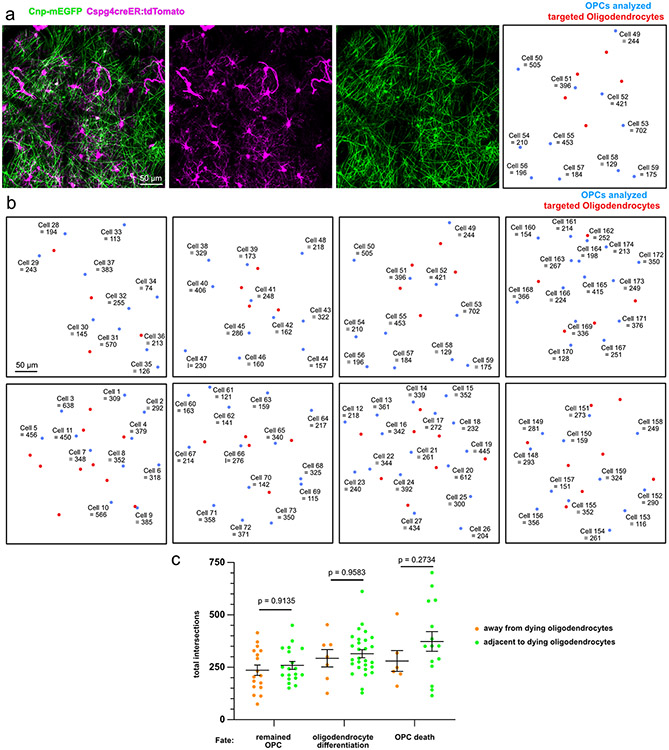
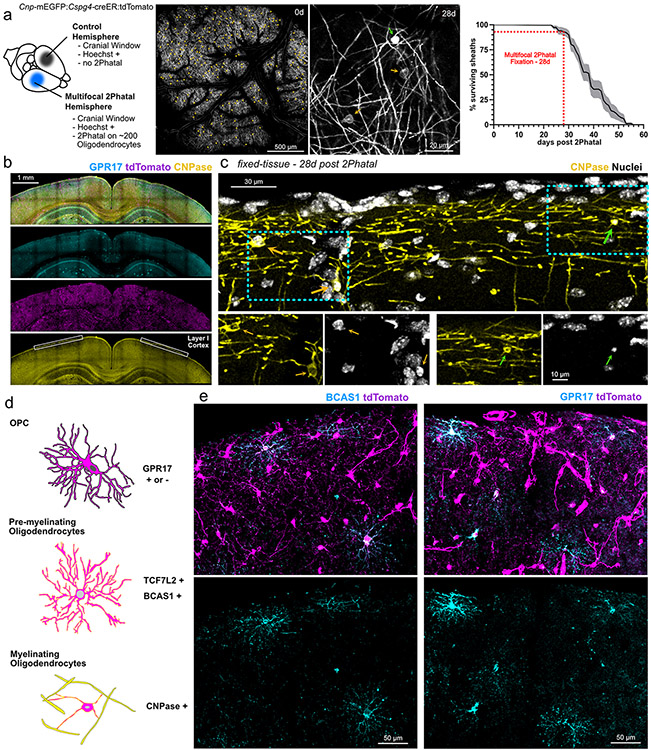
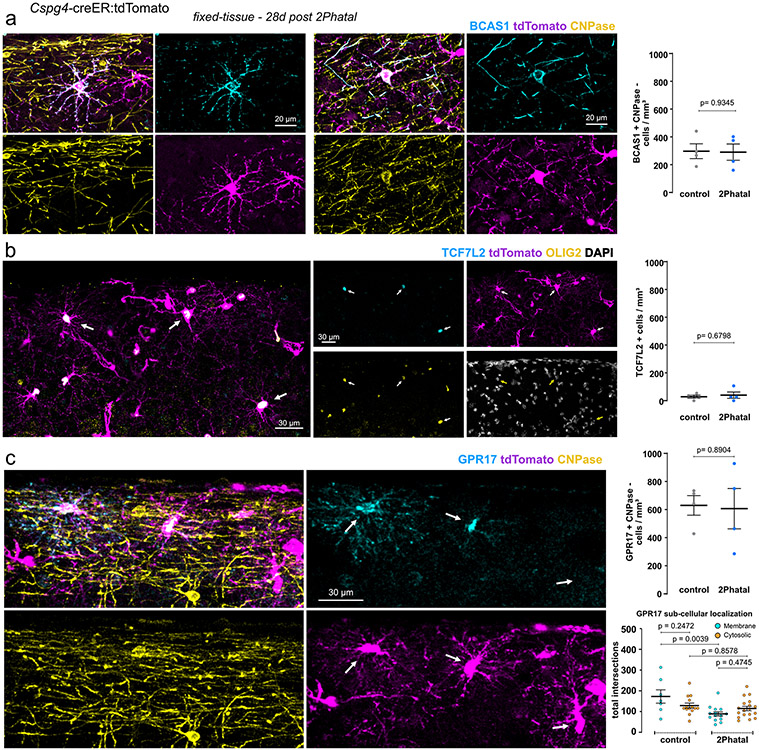
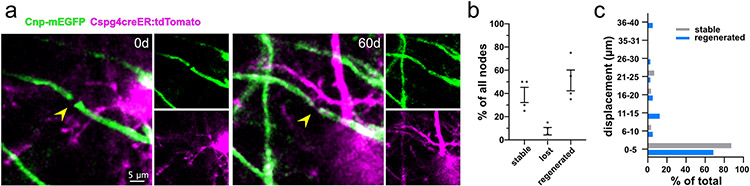
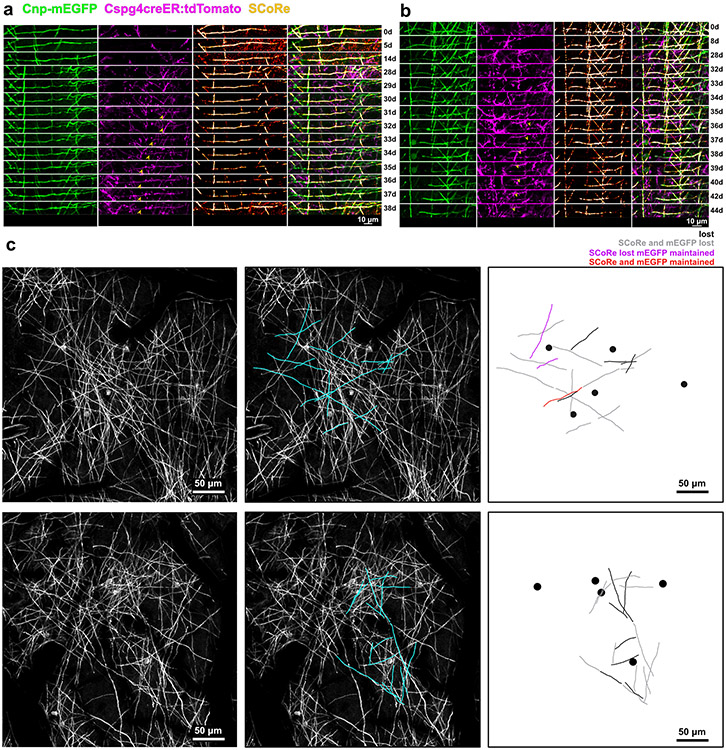
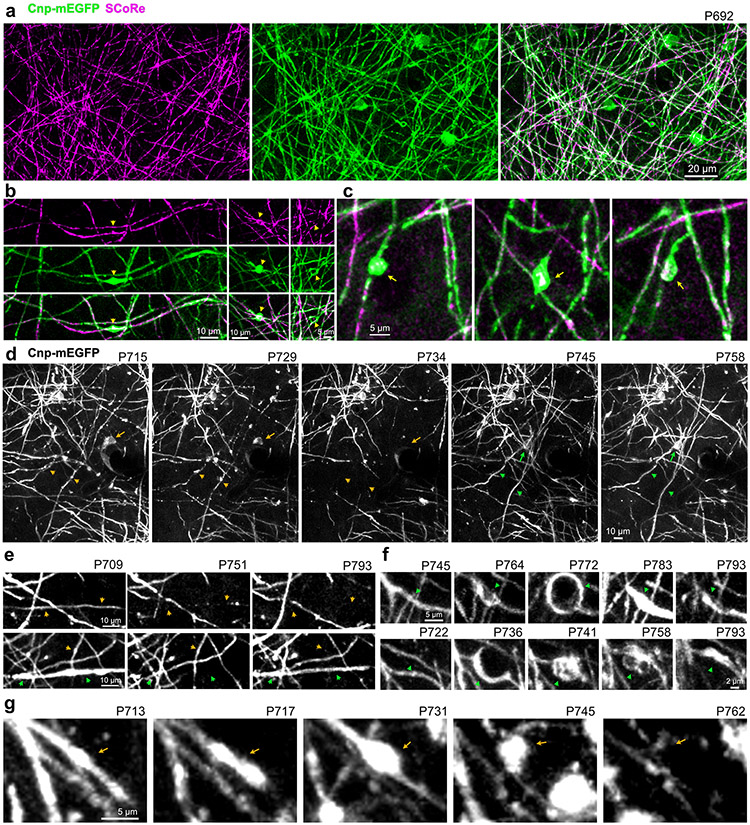
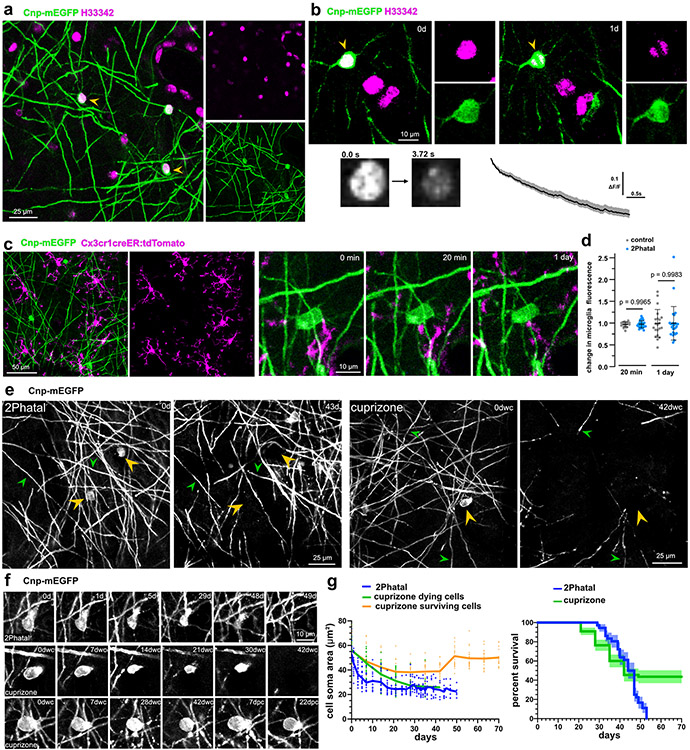
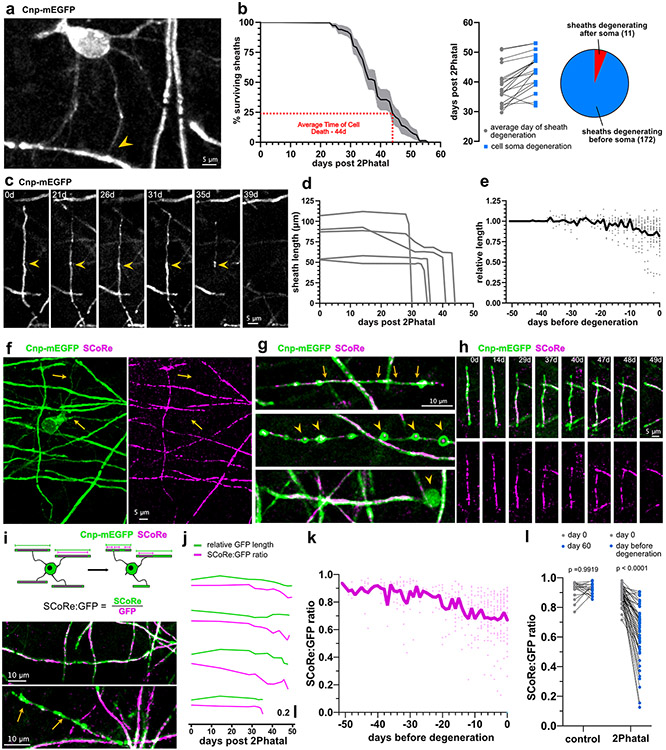
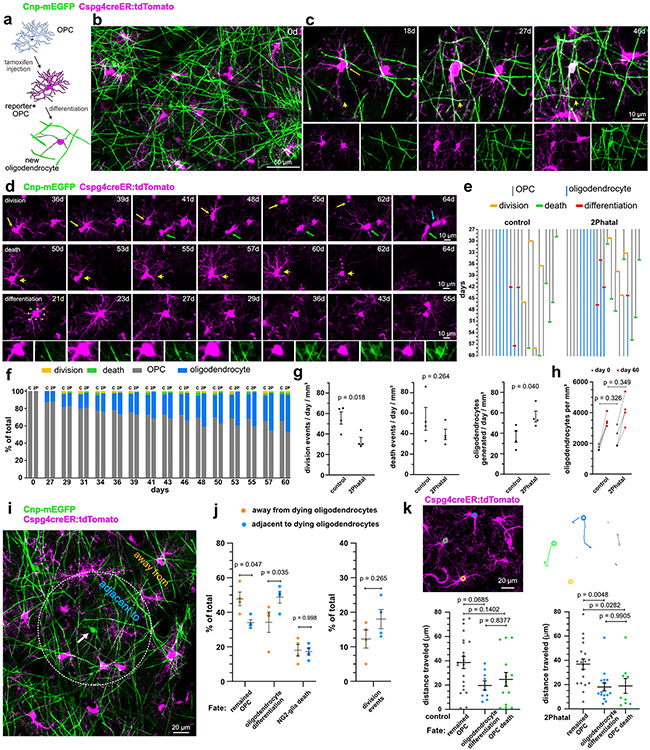
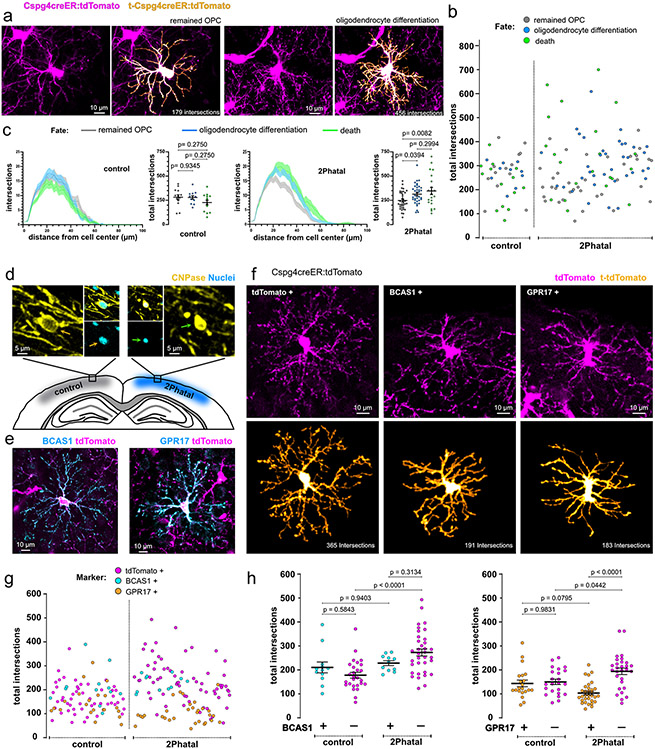
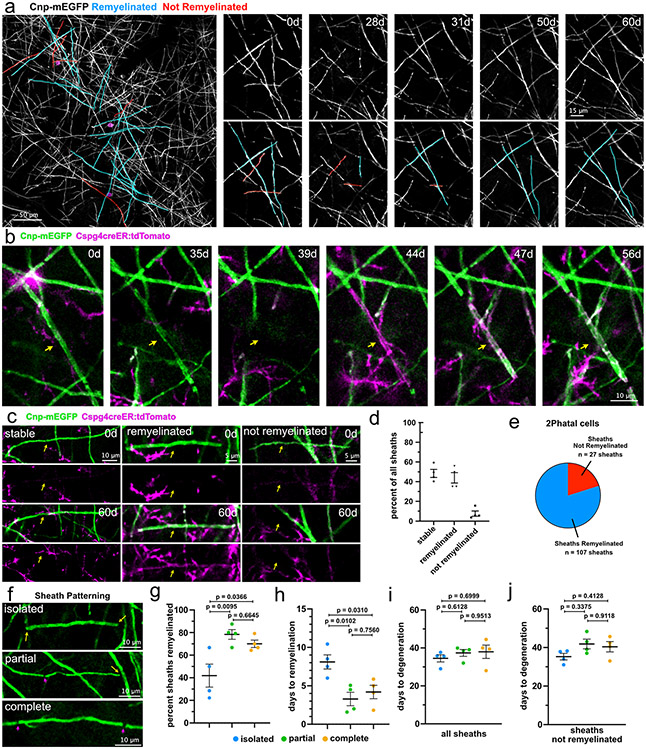
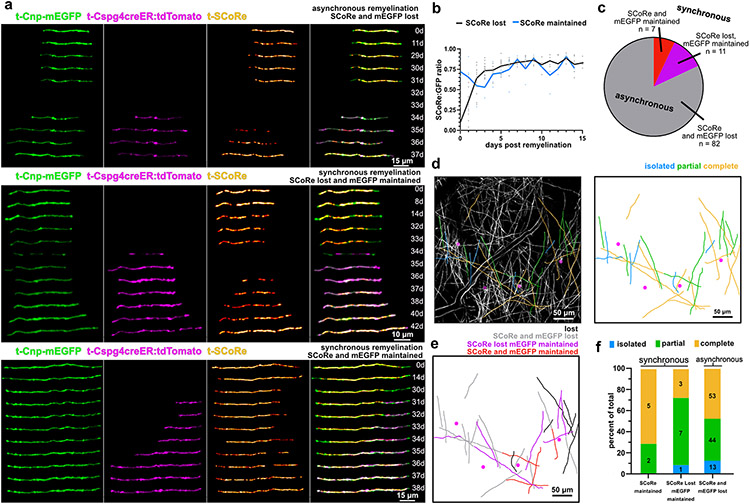
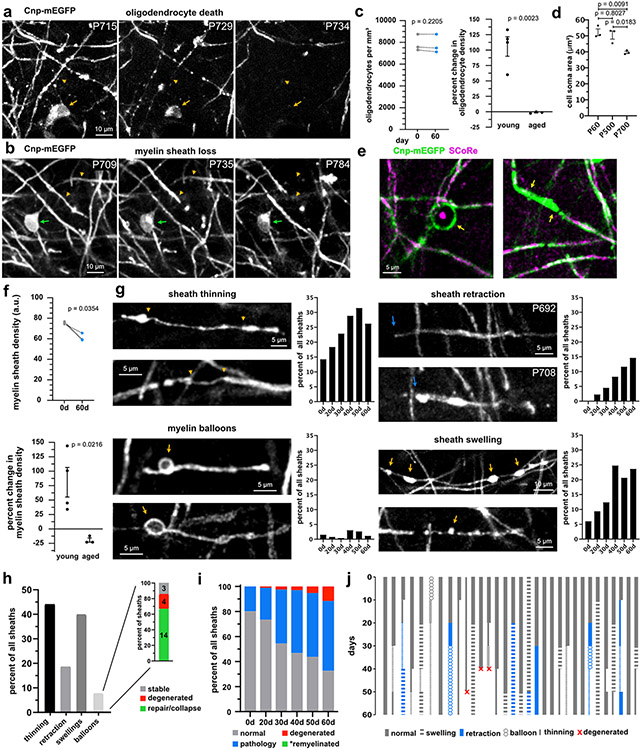
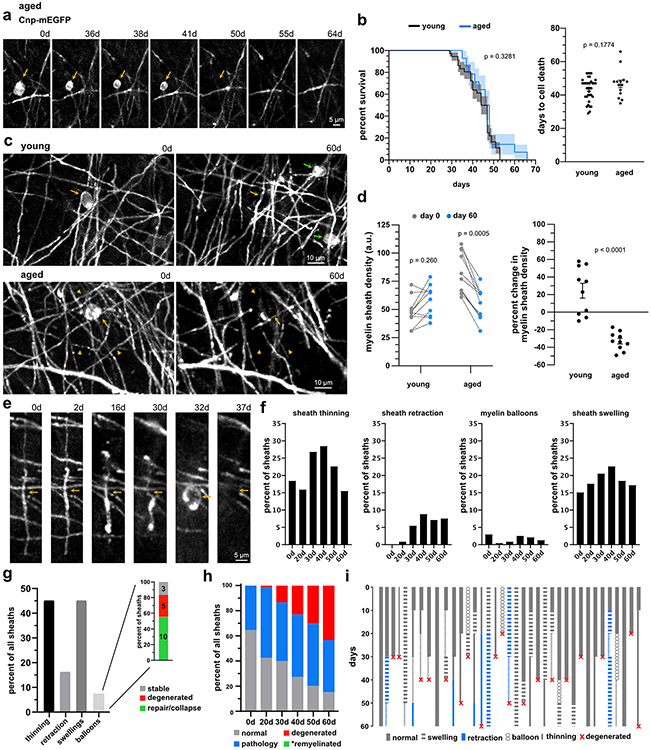
Myelin degeneration occurs in neurodegenerative diseases and aging. In these conditions, resident oligodendrocyte progenitor cells (OPCs) differentiate into oligodendrocytes that carry out myelin repair. To investigate the cellular dynamics underlying these events, we developed a noninflammatory demyelination model that combines intravital two-photon imaging with a single-cell ablation technique called two-photon apoptotic targeted ablation (2Phatal). Oligodendrocyte 2Phatal in both sexes results in a myelin degeneration cascade that triggers rapid forms of synchronous remyelination on defined axons. This remyelination is driven by oligodendrocytes differentiated from a subset of morphologically distinct, highly branched OPCs. Moreover, remyelination efficiency depends on the initial myelin patterns, as well as the age of the organism. In summary, using 2Phatal, we show a form of rapid synchronous remyelination, mediated by a distinct subset of OPCs, capable of restoring the original myelin patterning in adulthood but not aging.


Figures

Extended Data Fig. 1 ∣
Extended Data Fig. 1 ∣. Microglia do not acutely respond to oligodendrocyte 2Phatal and cuprizone-induced myelin pathology and dynamics of degeneration
(a) In vivo images from dual-reporter, triple transgenic mice with oligodendrocytes (green) and microglia (magenta) labeling. Microglia exhibited no immediate chemotactic response towards oligodendrocytes targeted with 2Patal (orange arrowheads) demonstrating no disruption of the targeted oligodendrocyte cell membrane during 2Phatal photobleaching. (b) Additional examples of control (red arrowheads) or 2Phatal (yellow arrowheads) oligodendrocyte soma again showing no chemotactic response by the microglia up to 1 day later. These examples were selected to show that while occasionally there were microglial cell processes and thus fluorescent signals detected in the quantification adjacent to the soma 1 day later, there is not a phagocytic response. (c) Paradigm used for cuprizone induced demyelination experiments. Mice were fed 0.2% w/w cuprizone mixed in ground chow. In-vivo imaging was done weekly, starting at week 0, through week 10. (d) Cuprizone induced widespread demyelination and oligodendrocyte cell loss (orange arrowheads) after 41 dwc (days with cuprizone). Remyelination was largely complete by 31 dpc (days post cuprizone). Green arrowheads denote points of reference for position orientation. (e) Representative images of common myelin pathology observed during cuprizone intoxication, including partial loss of compaction (top, between arrows), visualized by a lack of SCoRe signal, complete loss of compaction with myelin debris (middle), and balloon formation (bottom, arrowheads). (f) Temporal dynamics of sheath degeneration during cuprizone intoxication. Each trace represents sheaths produced from a single oligodendrocyte (n = 8 cells, 116 sheaths, 3 mice).
Extended Data Fig. 2 ∣
Extended Data Fig. 2 ∣. The Cnp-mEGFP:Cspg4-creER:tdTomato mouse line identifies newly generated oligodendrocytes.
(a) Example in-vivo image showing a previously generated, tdTomato−, oligodendrocyte (orange arrow) and tdTomato+ OPCs (white arrows) at day 0. (b) Time series showing the differentiation of new dual-labeled oligodendrocytes (yellow arrows) over the course of the experiment, while a previously established single labeled oligodendrocyte (orange arrow) is maintained. (c) Representative image of a Cnp-mEGFP:Cspg4-creER:tdTomato mouse at day 60 showing all surviving oligodendrocytes (arrows) are dual labeled with mEGFP+ and tdTomato+. For this example all cells at day 0 that were mEGFP+ were targeted with 2Phatal (d) Time series showing the presence of a new mEGFP+/tdTomato+ oligodendrocyte (orange arrow, top images) at day 60. During all experiments we encountered only a single tdTomato− oligodendrocyte, that was generated between day 0 and day 60 (white arrow, bottom images). (e) Of the 107 remyelinating sheaths analyzed, a single sheath was tdTomato−. As it was in the vicinity of the tdTomato− cell shown in d, it is likely to have originated from that cell.
Extended Data Fig. 3 ∣
Extended Data Fig. 3 ∣. Increased oligodendrocyte generation compensates for cell degeneration
(a) Cell maps of imaging positions in control animals, denoting the locations of oligodendrocytes present at the start of imaging (non-targeted oligodendrocytes, black dots) and oligodendrocytes produced over 60 days (new oligodendrocytes, cyan dots) (scale bars are 50μm). (b) Cell maps of imaging positions in animals targeted with 2Phatal on day 0, denoting the locations of oligodendrocytes targeted with 2Phatal (red dots), non-targeted oligodendrocytes present at day 0 (black dots), and new oligodendrocytes produced over 60 days post 2Phatal (cyan dots) (scale bars are 50μm). (c) Average number of new oligodendrocytes generated per day, over 60 days, in mice not targeted with 2Phatal (control, n = 4 mice) and mice with oligodendrocytes targeted with 2Phatal (blue, n = 4 mice). There were significantly more oligodendrocytes produced per day in mice targeted with 2Phatal than in control animals (two-tailed, unpaired t test, error bars are SEM). (d) Average fold-change in total oligodendrocytes in each position, between day 0 and day 60, in mice without oligodendrocyte 2Phatal (control, n = 4 mice) and mice with oligodendrocyte 2Phatal (2Phatal, n = 4 mice). (two-tailed, Unpaired t test, error bars are SEM).
Extended Data Fig. 4 ∣
Extended Data Fig. 4 ∣. Local OPC migration is unaffected by oligodendrocyte 2Phatal and OPC morphological complexity during remyelination
(a) Representative MAX projection of a single time point, showing OPCs (magenta), used to determine the migration of OPCs over time. (b) Example OPC migration tracks between day 28 and day 60 from a single imaging location. Each line represents the migration track of a single cell. (c) The total distance traveled (left) and net displacement (right) of OPCs in control mice compared to mice targeted with 2Phatal. There was no significant difference in overall migration behavior between the two groups (control n = 48 cells, 2Phatal n = 45 cells, two-tailed, unpaired t test, dots indicate single cells, error bars are SEM). (d) Sholl analyses of two representative OPCs with the total number of cell process intersections plotted relative to the cell center. (e) Images showing the morphology of the five most complex OPCs (top row) and five least complex OPCs (bottom row) paired with the fate of each of those cells. (f) Linear regression analyses revealed no correlation between total intersections and the time from Sholl analysis to final fate outcome in control (left), days post analysis refers to the time of fate determination relative to the day of Sholl analysis (day 28 after 2Phatal) (n = 12 differentiating cells, blue, and n = 14 dying cells, green) and 2Phatal (right) conditions (n = 34 differentiating, blue, and n = 21 dying, green). (g) Single OPCs imaged over 23 days showing relatively stable morphological complexity. (h) The total of intersections captured from multiple Sholl analysis and the same cell over time, again showing relatively stable morphological complexity over weeks.
Extended Data Fig. 5 ∣
Extended Data Fig. 5 ∣. Localization maps of OPC morphological complexity
(a) Single position captured at day 28 after oligodendrocyte 2Phatal showing OPCs, oligodendrocytes and a corresponding cell map of the targeted oligodendrocytes (red dots) and OPCs (blue dots). Numbers indicate the cell ID and total intersections for that cell. (b) Additional cell maps of all positions used in the 2Phatal conditions showing OPC location and morphological complexity (cell ID + total intersections for that cell) and locations of targeted oligodendrocytes (red dots) (c) The total intersections of all cells that remained OPCs, differentiated, or died either adjacent to or away from targeted oligodendrocytes. Remained OPC n = 19 adjacent, 17 away, oligodendrocyte differentiation n = 28 adjacent, 7 away; OPC death n = 15 adjacent, 6 away. One way ANOVA with Sidak’s multiple comparison’s test, error bars are SEM.
Extended Data Fig. 6 ∣
Extended Data Fig. 6 ∣. Multifocal 2Phatal enables molecular interrogation of OPCs during oligodendrocyte death
(a) Pipeline demonstrating our approach to multifocal 2Phatal. Oligodendrocytes (orange arrowheads) throughout the cranial window were targeted with 2Phatal. 28 days post 2Phatal, targeted cells (green arrow) can be easily identified by their bright, condensed somas compared to non-targeted cells (orange arrows). Animals used in multifocal experiments were perfused at day 28 which is prior to the majority demyelination (n = 19 cells, 183 sheaths, 4 mice, error is SEM). (b) Brain sections can then be immunolabeled. Analysis was localized to layer I cortex (box), as this was where 2Phatal was performed. (c) 2Phatal-targeted oligodendrocytes (green arrows) can be easily identified in fixed tissue by their condensed soma compared to non-targeted oligodendrocytes (orange arrows). Nuclear condensation was also a reliable method for identification. (d) Schematic identifying genes of interest for our pipeline. GPR17 is known to label subpopulations of OPCs. TCF7L2 and BCAS1 were used as markers to identify active differentiation. CNP was used as a marker to exclude oligodendrocytes from our analysis. (e) Representative images of immunostaining for BCAS1 (left) and GPR17 (right).
Extended Data Fig. 7 ∣
Extended Data Fig. 7 ∣. Identity and density of OPCs following multifocal 2Phatal
(a) Representative images of BCAS1 staining following multifocal 2Phatal and quantification of BCAS1 positive CNP negative cell density in layer I cortex (n = 4 animals, two-tailed, unpaired t-test, error bars are SEM). Sholl was performed on tdTomato labeled BCAS1 positive CNP negative cells (left), BCAS1 positive cells with CNP co-labeling and/or attached sheaths (right) were excluded. (b) Representative image of TCF7L2 and OLIG2 staining following multifocal 2Phatal. Density of TCF7L2 cells is also reported (n = 4 animals, two-tailed, unpaired t-test, error bars are SEM). (c) Representative image showing GPR17 staining following multifocal 2Phatal. GPR17 subcellular localization to the membrane (left arrow) and cytosol (middle arrow) can be visualized, as well as no expression (right arrow). Density of combined GPR17 negative, CNP negative cells is reported (n = 4 mice, two-tailed, unpaired t-test, error bars are SEM). Grouped data showing the total intersections of GPR17+ cells with membrane (cyan) or cytosolic (orange) localization in control and 2Phatal conditions (Membrane n = 21 cells, cytosolic n = 32 cells, 4 animals, one-way ANOVA with Tukey correction for multiple comparisons, error bars are SEM)
Extended Data Fig. 8 ∣
Extended Data Fig. 8 ∣. Initial node of Ranvier locations are reestablished after remyelination
(a) In vivo images of a node of Ranvier present at day 0 between mEGFP only labeled sheaths, which reformed at its original location between two mEGFP and tdTomato double labeled sheaths, as seen at day 60. (b) Nodes from 2Phatal mice were randomly selected on day 0, blind to the cell of origin, and evaluated on day 60, to determine if they were stable (mEGFP+ only) were reformed through remyelination (mEGFP+tdTomato+) or degenerated (80 nodes from n = 4 mice) (c) Proportion of nodes that were displaced between days 0 and 60 for both nodes that remained stable (n = 31) and nodes that were regenerated following remyelination (n = 41). All error bars are SEM.
Extended Data Fig. 9 ∣
Extended Data Fig. 9 ∣. Synchronous remyelination facilitates rapid remyelination in vivo and spatiotemporal maps of asynchronous and synchronous remyelination
(a) Original images used to generate the traced time series shown in Fig. 6. The initiation of remyelination is evident by emergence of tdTomato signal (arrowheads) on day 31. (b) Additional example of synchronous remyelination without score loss throughout the repair process. (c) Representative imaging positions in CNP-mEGFP mice with oligodendrocytes targeted with 2Phatal (left), highlighting sheaths produced by targeted oligodendrocytes (middle, cyan). The same sheaths are then presented based on eventual fate post-2Phatal (right), including sheaths that were never repaired (lost, black), fully degenerated and then repaired (SCoRe and mEGFP lost, grey), underwent synchronous remyelination with loss of score (SCoRe lost mEGFP maintained, magenta), and underwent synchronous remyelination without losing SCoRe (SCoRe and mEGFP maintained, red). Targeted oligodendrocytes are shown as black dots (right).
Extended Data Fig. 10 ∣
Extended Data Fig. 10 ∣. Myelin pathology and dynamics of degeneration in aged mice
(a) In-vivo image of myelin, in layer I of the somatosensory cortex, in an aged mouse, acquired using SCoRe and fluorescence microscopy. (b) Aged mice displayed widespread myelin pathology (arrowheads) including myelin swellings (left), debris accumulation (middle), and balloons (right). (c) Additional examples of myelin swellings (arrows) in aged animals. (d) Oligodendrocyte death (yellow arrows) and myelin degeneration (yellow arrowheads) followed by the emergence of a newly generated oligodendrocyte (green arrows) and remyelinating sheaths (green arrowheads). This was the only example of remyelination due to the differentiation of a new oligodendrocyte we observed in aged animals. (e) Representative time series showing failed remyelination following myelin degeneration (orange arrowheads) and successful remyelination after sheath loss (green arrowheads). (f) Sheath repair was observed to occur following balloon formation (green arrowheads). (g) Severe myelin pathology, seen in aged mice, often resulted in full sheath degeneration (bottom, orange arrowheads)
Fig. 1 ∣
Fig. 1 ∣. On-demand focal cortical demyelination with oligodendrocyte 2Phatal
(a) In vivo image of nuclear dye labeling (magenta) in the somatosensory cortex of a Cnp-mEGFP transgenic mouse with oligodendrocytes labeled via membrane tethered EGFP (arrowheads). (b) Photobleaching of single oligodendrocyte nuclei (arrowhead, 3.72s bleach) caused disruption of nuclear labeling without causing damage to adjacent cells. Reliable photobleaching is shown by the average fluorescence intensity trace for all targeted cells (n=82 cells, 6 mice, error bands are SEM). (c) In vivo images from dual-reporter, triple transgenic mice with oligodendrocytes (green) and microglia (magenta) labeling. Microglia exhibited no immediate chemotactic response towards oligodendrocytes targeted with 2Patal (yellow arrowheads) demonstrating no disruption of the targeted oligodendrocyte cell membrane during 2Phatal photobleaching. (d) The change in microglia fluorescence intensity was quantified before, 20 minutes, and 1 day after photobleaching in 2Phatal and control cells (n=21 control cells and 27 2Phatal cells, 3 mice, one-way ANOVA, Sidak’s multiple comparisons test, error bars are SD). (e) In vivo time lapse images showing oligodendrocyte cell loss (yellow arrowheads) and demyelination in 2Phatal (left) and cuprizone fed (right) mice. Green arrowheads denote points of reference for position orientation. (f) Representative timeseries of oligodendrocytes targeted with 2Phatal, oligodendrocytes dying during cuprizone treatment, and oligodendrocytes that survive cuprizone intoxication. 2Phatal was induced on 0d, with final degeneration occurring 7 weeks later (dwc = days with cuprizone; dpc = days post cuprizone). In all 3 cases, soma morphology is disrupted within 7 days of initial insult. Cells that survive cuprizone treatment resume normal morphology after the mice are returned to normal chow. (g) Changes in oligodendrocyte soma area (μm2) of cells targeted with 2Phatal (blue; n=24 cells, 4 mice), dying cells in mice treated with cuprizone (green; n=31 cells, 3 mice), and surviving cells in mice treated with cuprizone (orange; n=24 cells, 3 mice) and survival curve of oligodendrocytes after 2Phatal (blue, n = 36 cells, 4 mice) or in mice treated with cuprizone (green; n=55 cells, 3 mice) (error represents SEM).
Fig. 2 ∣
Fig. 2 ∣. Myelin sheath degeneration occurs via distinct phases of retraction and membrane decompaction
(a) In-vivo imaging of CNP-mEGFP reveals oligodendrocyte proximal processes and their connection with the myelin sheath (arrowhead). (b) Temporal dynamics of sheath degeneration. (n=19 cells, 183 sheaths, 4 mice, error is SEM). Average time to sheath degeneration compared to cell soma loss and breakdown of sheaths degenerating before or after their attached soma for all sheaths analyzed. (c) In vivo image sequence of a myelin sheath thinning and retracting over weeks after 2Phatal. (d) Representative length changes of sheaths produced by one 2Phatal-targeted oligodendrocyte. (e) Relative length changes in all myelin sheaths leading up to the day of their degeneration (gray dots indicate single sheath measurements, n = 49 sheaths, 4 mice). The overlayed black trace represents the mean. (f) In vivo image indicating that the SCoRe (myelin compaction) signal is absent from proximal processes (arrows). (g) Common myelin sheath pathology observed during 2Phatal induced degeneration, including sheath thinning (top, between arrows), balloon formation (middle, arrowheads) and myelin debris accumulation (bottom, arrowhead). (h) Representative time sequence of a degenerating sheath visualized with fluorescence and SCoRe microscopy. (i) SCoRe to GFP ratios were calculated to determine SCoRe coverage along myelin sheaths (top). This value was used to distinguish compact sheaths (middle) from uncompacted sheaths (bottom, yellow arrows). (j) Representative traces of GFP length (green) and SCoRe:GFP ratio (magenta) from 4 sheaths. (k) SCoRe:GFP ratios of all internodes normalized to the day of sheath degeneration (n= 9 sheaths, 4 mice). The overlayed blue trace represents the mean. (l) SCoRe:GFP ratios of control and degenerating sheaths at day 0 vs day 60 for control or the day before degeneration for 2Phatal (n=19 control sheaths and n=49 2Phatal sheaths, 4 mice, two-way ANOVA, Holm-Sidak multiple comparisons, comparison of 2Phatal SCoRe:GFP ratio between day 0 and 60 p = 4x10⁻¹⁵).
Fig. 3 ∣
Fig. 3 ∣. Divergent fates of single OPCs after oligodendrocyte 2Phatal
(a) Dual color fate mapping of OPCs in Cnp-mEGFP:Cspg4-creER:tdTomato mice with an inducible cre reporter. (b) In vivo image of OPCs (magenta) and myelinating oligodendrocytes (green) immediately following cre recombination. (c) OPC differentiation into a dual-labeled myelinating oligodendrocyte (arrows). New myelin sheaths generated during differentiation are dual-labeled (arrowheads). (d) In vivo time-lapse images showing outcomes for OPC fate including cell division (top) cell death (middle) and oligodendrocyte differentiation (bottom, boxed area shows the Cnp-mEGFP channel indicating the turning on of mEGFP as the cell differentiates). (e) OPC lineage diagrams indicating division events (orange), apoptosis (green), and oligodendrocyte differentiation (red) in control and 2Phatal mice. (f) OPC fate in control (c) and 2Phatal (2P) mice, as a percentage of all cells. (control, n = 182 cells, 4 mice; 2Phatal, n = 256 cells, 4 mice). (g) OPC division events per day (orange), apoptotic events per day (green), and differentiation events per day (blue) in control mice compared to 2Phatal mice (n = 4 mice, unpaired t-tests). (h) Oligodendrocyte density in control and 2Phatal mice at day 0 and day 60 (n = 4 mice, two-way ANOVA, Sidaks multiple comparison’s test). (i) Analysis of OPCs adjacent to or away from oligodendrocytes targeted by 2Phatal. Adjacent cells were defined as those with somas on or within a 150μm diameter circle centered around each targeted cell (arrow). (j) The proportion of all cells that remained OPCs, differentiated, or died in both regions (n = 4 mice, two-way ANOVA Sidaks multiple comparison’s test). Division events between these populations was also quantified (n = 4 mice, paired t test). (k) Tracks of OPC migration in control and 2Phatal mice. Analysis of total distance traveled relative to cell fate for OPCs in control (left) and 2Phatal (right) positions. Dots represent a single cell and horizontal lines indicate the mean (control n = 48 cells, 2Phatal n = 45 cells, error bars are SEM, one-way ANOVAs with Tukey correction for multiple comparisons).
Fig. 4 ∣
Fig. 4 ∣. OPC fate is linked to morphological complexity and GPR17 expression during remyelination
(a) Semi-automated reconstructions of OPCs with distinct process morphology and eventual fate. (b) The distribution of total intersections of OPCs analyzed using Sholl analysis in control and 2Phatal groups. Each dot represents a single cell and is color coded by fate as indicated. (c) Average Sholl analysis plot of OPCs separated by fate in control (left) and 2Phatal (right) groups (error bars are SEM). Grouped data shows the total intersections of OPCs that remained OPCs (gray), differentiated (blue), and died (green) (control n = 39 cells, 2Phatal n = 93 cells, 4 mice, one-way ANOVA with Holm-Sidak correction for multiple comparisons, error bars are SEM). Each dot represents a single cell, and the horizontal line represents the mean. (d) Representative images of a non-targeted, cortical oligodendrocyte (left, orange arrow) and a 2Phatal targeted oligodendrocyte (right, green arrow) in tissue fixed 28 days post 2Phatal. 2Phatal targeted oligodendrocytes can be identified by the condensation of the soma and nucleus. (e) Representative images showing immunostaining of BCAS1+ (left, cyan) and GPR17+ (right, cyan) OPCs co-labeled by tdTomato. (f) Semi-automated reconstructions of OPCs, positive for tdTomato only (left), tdTomato and BCAS1 (center), and tdTomato and GPR17 (right). (g) The Distribution of total intersections of OPCs in fixed tissue, analyzed by Sholl, in control and multifocal 2Phatal conditions. Each dot represents a single cell and is color coded by the presence of BCAS1 (cyan), GPR17 (orange), or absence of BCAS1 or GPR17 (magenta, tdTomato only). (h) Grouped data showing the total intersections of OPCs in control and 2Phatal conditions, separated by BCAS1 (left, cyan) or GPR17 (right, orange) expression. Cells that do not express either BCAS1 or GPR17 are magenta. (BCAS1+ n = 23 cells, GPR17+ n = 53 cells, tdTomato+BCAS1− n = 62 cells, tdTomato+GPR17− n = 52 cells, 4 animals, one-way ANOVA with tukey correction for multiple comparisons, error bars are SEM, comparison of BCAS1− control to 2Phatal p = 0.000020, comparison of GPR17+ 2Phatal to GPR17− 2Phatal p = 0.0000002).
Fig. 5 ∣
Fig. 5 ∣. Myelin patterns impact the success and spatiotemporal dynamics of remyelination
(a) In vivo image showing the locations of oligodendrocytes targeted with 2Phatal (magenta circles) and sheaths which degenerate post 2Phatal, colored based on final fate (cyan, are remyelinated; red, are not remyelinated). (b) Timeseries showing degeneration of a single labeled mEGFP+ myelin sheath (arrow) followed by remyelination by a new, dual-labeled mEGFP+/tdTomato+ sheath from a newly differentiated oligodendrocyte. (c) Representative images of sheaths which remained stable (left), degenerated and were remyelinated (middle), and were lost without repair (right). (d) Proportion of sheath outcomes for randomly selected sheaths within the cranial window. (92 sheaths; n=4 mice, error bars are SEM). (e) The proportion of sheaths attached to 2Phatal cells that were remyelinated (f) Representative images showing the 3 possible myelin patterns. Isolated sheaths (top) had no adjacent sheaths (yellow arrow), partial sheaths (middle) had an adjacent sheath on one side (magenta arrows) and no adjacent sheath on the other (yellow arrow), and complete sheaths (bottom) had two adjacent sheaths (magenta arrows). (g-h) Remyelination efficiency and time to remyelination were quantified based on the myelin patterning of each sheath. Sheaths with partial and complete patterns were more likely to be remyelinated than isolated sheaths (134 sheaths from n=4 mice, one-way ANOVA with Tukey correction for multiple comparisons, error bars are SEM). Remyelination was slower in isolated sheaths compared to the other patterns (107 sheaths from n=4 mice, one-way ANOVA with Tukey correction for multiple comparisons, error bars are SEM). Dots represent the average from each mouse. (i-j) Time to degeneration of all sheaths (i) and only sheaths that were not remyelinated (j) was quantified based on the myelin patterning of each sheath. There was no significant difference in time to degeneration between any of the patterns, for all sheaths (142 sheaths from n=4 mice, one-way ANOVA with Tukey correction for multiple comparisons, error bars are SEM), or for sheaths that were not remyelinated (39 sheaths from n=4 mice, one-way ANOVA with Tukey correction for multiple comparisons, error bars are SEM). Dots represent the average from each mouse.
Fig. 6 ∣
Fig. 6 ∣. Distinct forms of synchronous and rapid remyelination
(a) In vivo time series showing reconstructed myelin sheaths that degenerate and are replaced by new mEGFP+tdTomato+ double labeled sheaths. In the top sheath there is a two-day window where myelin is absent from the axon. In the middle example timeseries there is no gap in time where mEGFP is completely absent from the axon suggesting that the emergence of the new sheath occurs simultaneously with the loss of the original. The SCoRe signal is lost, however. A third example of remyelination is shown on the bottom that proceeds with a seamless transition between the degenerating and remyelinating sheath. There is no observed gap in the mEGFP signal or the SCoRe signal indicating that compaction is mostly maintained through the repair process. (b) The dynamics of SCoRe coverage, of new remyelinating sheaths, following the complete loss of SCoRe signal (black, n = 19 sheaths, 3 mice) or during a seamless transition event (blue, n = 7 sheaths, 2 mice). (c) the proportion of each type of event (n = 100 sheaths, 4 mice). (d) A reconstruction of an entire position field of view. 2Phatal targeted oligodendrocytes are shown as magenta circles with sheath traces colored to denote the myelin pattern of each sheath (blue, isolated, green, partial, yellow, complete). (e) The same field of view used to generate d, Sheaths produced by these oligodendrocytes are also shown, colored based on ultimate fate (black, not remyelinated, gray, remyelinated with loss of mEGFP and SCoRe , purple, remyelinated with loss of SCoRe but not mEGFP, red, remyelinated without loss of SCoRe or mEGFP) (f) The proportion of sheaths that were observed to be remyelinated by the different remyelination events based on patterning. The value within each bar denotes the n value of sheaths
Fig. 7 ∣
Fig. 7 ∣. Age-related myelin degeneration occurs via sheath loss and cell death with limited repair.
(a) Myelin pathology and degeneration coinciding (yellow arrowhead) with cell death (yellow arrow) b) Myelin sheath degeneration (yellow arrowheads) without cell death (green arrow). (c) Oligodendrocyte densities in aged (22-24 months) mice over 60 days (n=3 mice, two-tailed, paired t-test) and the percent change in oligodendrocyte density between young (2 months) and aged mice (young n=4 mice, aged n=3 mice, unpaired t-test, error bars are SEM). (d) Oligodendrocyte soma area from young mice (P60; n=3 mice, 24 cells) and aged mice (P500; n=3 mice, 90 cells, P700; n=3 mice, 63 cells, one-way ANOVA with Tukey correction for multiple comparisons, error bars are SEM). (e) Commonly observed myelin pathology in aged mice including balloon formation (left, arrow) and loss of compaction (right, between arrows), visualized by loss of SCoRe signal. (f) Myelin sheath densities in aged mice over 60 days (n=3 mice, two-tailed, paired t-test). Myelin sheath density increased in young mice between day 0 and day 60, while decreasing in aged mice (young n=4 mice, aged n=3 mice, two-tailed, unpaired t-test, error bars are SEM). (g) Common myelin pathology observed in aged sheaths, sheath thinning (between orange arrowheads), sheath retraction (blue arrow), balloons (orange arrow), and sheath swellings (orange arrows), and their total prevalence over 60 days (n=267 sheaths, 3 mice). (h) Total prevalence of each observed myelin pathology, indicating the percentage of all sheaths that had the specific pathology for least one time point over 60 days. Myelin balloon formation is further broken down into the eventual fate including, balloons that were stable (gray; n=3), balloons that resulted in sheath degeneration (red; n=4), and balloons which formed and then were subsequently repaired (green; n=14). (i) Total breakdown of all sheaths without any observed pathology (gray), with pathology (blue), sheaths that degenerate (red), and sheaths that were remyelinated (green, *we did not observe any remyelination of sheaths analyzed) in aged mice (n=267 sheaths, 3 mice). (j) Myelin sheath fate diagram demonstrating the progression of pathology of a subset of sheaths.
Fig. 8 ∣
Fig. 8 ∣. Failed myelin repair after oligodendrocyte 2Phatal in aging
(a) Time-series of an aged oligodendrocyte (arrow) degenerating following 2Phatal. (b) Survival curves of oligodendrocytes after 2Phatal in young (n=36 cells, 4 mice) and aged mice (n=14 cells, 3 mice) (log rank (mantel cox) test, error bars are SEM). The average time to oligodendrocyte death after 2Phatal in young and aged mice (two-tailed, unpaired t-test, error bars are SEM). (c) Changes in myelin (orange arrowheads) and oligodendrogenesis (green arrows) in the territory of an oligodendrocyte targeted with 2Phatal (orange arrows), in a young (top) and aged mouse (bottom). (d) The change in myelin sheath density between day 0 and day 60 in the territory surrounding an oligodendrocyte targeted with 2Phatal, in young (n=10 cells, 4 mice,) and aged mice (n=10 cells, 3 mice, two-way ANOVA with Sidak correction for multiple comparisons). The change in sheath density in young mice and aged mice (young n=10 cells, 4 mice, aged n=10 cells, 3 mice, two-tailed, unpaired t-test, error bars are SEM, p = 0.000006). (e) Time-series showing the degeneration of a myelin sheath (orange arrow) over weeks in an aged animal with oligodendrocytes targeted with 2Phatal. (f) The percentage of sheaths exhibiting thinning, retraction, balloons, or swellings over 60 days after 2Phatal (n=239 sheaths, 3 mice). (g) Total prevalence of each observed myelin pathology in 2Phatal mice (n=239 sheaths, 3 mice) that had the specific pathology for least one time point over 60 days of imaging. Myelin balloon formation is subdivided into the eventual fate of observed balloons including, balloons that were stable through the cessation of imaging (gray; n=3), balloons that resulted in sheath degeneration (red; n=5), and balloons which formed and then were subsequently repaired (green; n=110). (h) Total breakdown of all sheaths without any observed pathology (gray), with pathology (blue), sheaths that degenerate (red), and sheaths that were remyelinated (green, *we did not observe any remyelination of sheaths analyzed) in aged mice that were targeted with 2Phatal (n=239 sheaths, 3 mice). (i) Myelin sheath fate diagram demonstrating the progression of pathology of a subset of sheaths.

References

    1. Zalc B, Goujet D & Colman D The origin of the myelination program in vertebrates. Curr. Biol 18, R511–2 (2008). - PubMed
    1. Stadelmann C, Timmler S, Barrantes-Freer A & Simons M Myelin in the Central Nervous System: Structure, Function, and Pathology. Physiol. Rev 99, 1381–1431 (2019). - PubMed
    1. Franklin RJM & Ffrench-Constant C Remyelination in the CNS: from biology to therapy. Nat. Rev. Neurosci 9, 839–855 (2008). - PubMed
    1. Nave K-A Myelination and support of axonal integrity by glia. Nature 468, 244–252 (2010). - PubMed
    1. Peters A & Kemper T A review of the structural alterations in the cerebral hemispheres of the aging rhesus monkey. Neurobiol. Aging 33, 2357–2372 (2012). - PMC - PubMed

Publication types

LinkOut - more resources