

Mortality trends in primary malignant brain and central nervous system tumors vary by histopathology, age, race, and sex
- PMID: 36928698
- PMCID: PMC10050015
- DOI: 10.1007/s11060-023-04279-6
Mortality trends in primary malignant brain and central nervous system tumors vary by histopathology, age, race, and sex
Abstract
Purpose: Primary malignant brain and other central nervous system tumors are rare cancers that have shown rising mortality rates in recent years. To elucidate potential factors involved in this rising death rate, we examined mortality trends for primary malignant BT in the United States stratified by histopathology groupings, age, race, and sex.
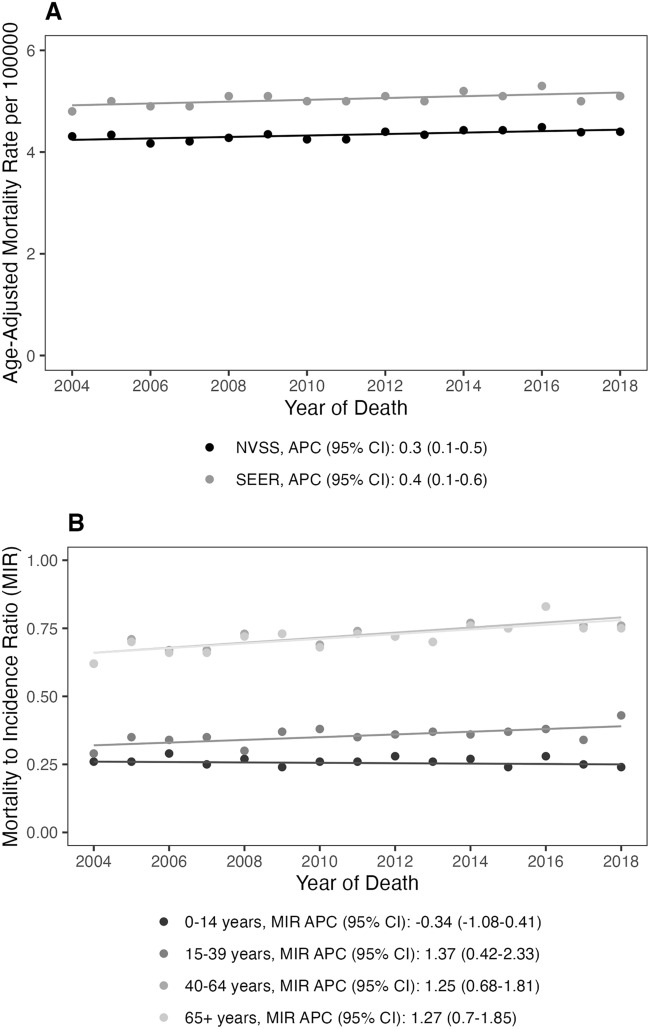
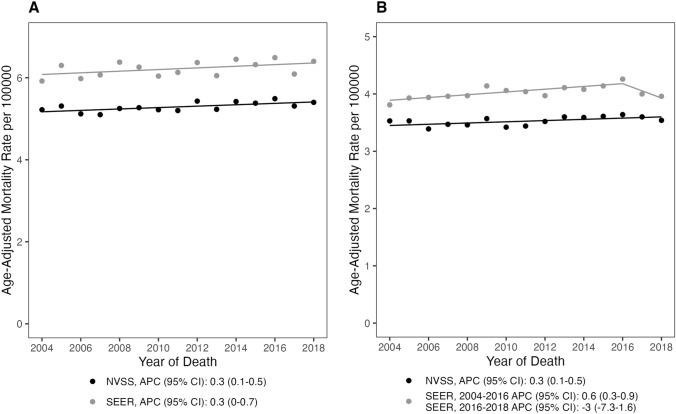
Methods: Mortality rates for demographic factors within primary malignant BT were generated using the National Center for Health Statistics' National Vital Statistics Systems data from 2004 to 2018. Additionally, histopathology-specific incidence-based mortality rates were calculated using the National Cancer Institute's Surveillance, Epidemiology, and End-Results (SEER) 18 data from 2004 to 2018. Joinpoint modeling was used to estimate mortality trends and annual percent changes with corresponding 95% confidence intervals.
Results: Overall, there was a very small increase in mortality from 2004 to 2018. Individuals > 65 years saw a small increase in mortality, while changes in individuals of other ages were non-significant. Asian/Pacific Islander or American Indian/Alaskan Native had the largest increase in mortality. Among histopathology groupings, there was a small mortality increase in adults ages > 65 years with glioblastoma, while the mortality rate of other malignant gliomas declined in the same age group. CNS lymphoma mortality rates in patients ages 15-39 and 40-64 years declined significantly while rising significantly in the > 65 age group. In pediatric patients, embryonal tumor mortality had a non-significant increase between 2004 and 2007 but declined significantly between 2007 and 2018.
Conclusion: Examining age, race, sex, and histopathology-specific mortality trends at the population level can provide important information for clinicians, researchers, and aid in public health planning.
Keywords: Brain tumors; Central nervous system; Mortality trends; SEER.
© 2023. This is a U.S. Government work and not under copyright protection in the US; foreign copyright protection may apply.
Conflict of interest statement
The authors declare no conflict of interest. JSB-S is a full-time employee of the NIH/NCI. GC and KAW are full-time contractors of the NIH/NCI.
Figures


References
-
- Surveillance Epidemiology and End Results (SEER) Program (2022) SEER*Stat database: incidence-based mortality— SEER 18 regs (Excl Louisiana) research data, Nov 2020 Sub (2000–2018) <Katrina/Rita population adjustment>—linked to county attributes—total U.S., 1969–2018 counties, National Cancer Institute, DCCPS, surveillance research program, surveillance systems branch, released May 2022, based on the November 2014 submission.
-
- Surveillance Epidemiology and End Results (SEER) Program (2022) SEER*Stat database: mortality—all COD, aggregated with state, total U.S. (2000–2018) <Katrina/Rita population adjustment>, National Cancer Institute, DCCPS, surveillance research program, surveillance systems branch, released May 2022. Underlying mortality data provided by NCHS (http:// www.cdc.gov/nchs).
MeSH terms
LinkOut - more resources
Full Text Sources
