. 2023 Apr;25(4):565-578.
doi: 10.1038/s41556-023-01103-1. Epub 2023 Mar 16.

A beta cell subset with enhanced insulin secretion and glucose metabolism is reduced in type 2 diabetes

Affiliations

A beta cell subset with enhanced insulin secretion and glucose metabolism is reduced in type 2 diabetes

Alfonso Rubio-Navarro et al. Nat Cell Biol. 2023 Apr.

Abstract

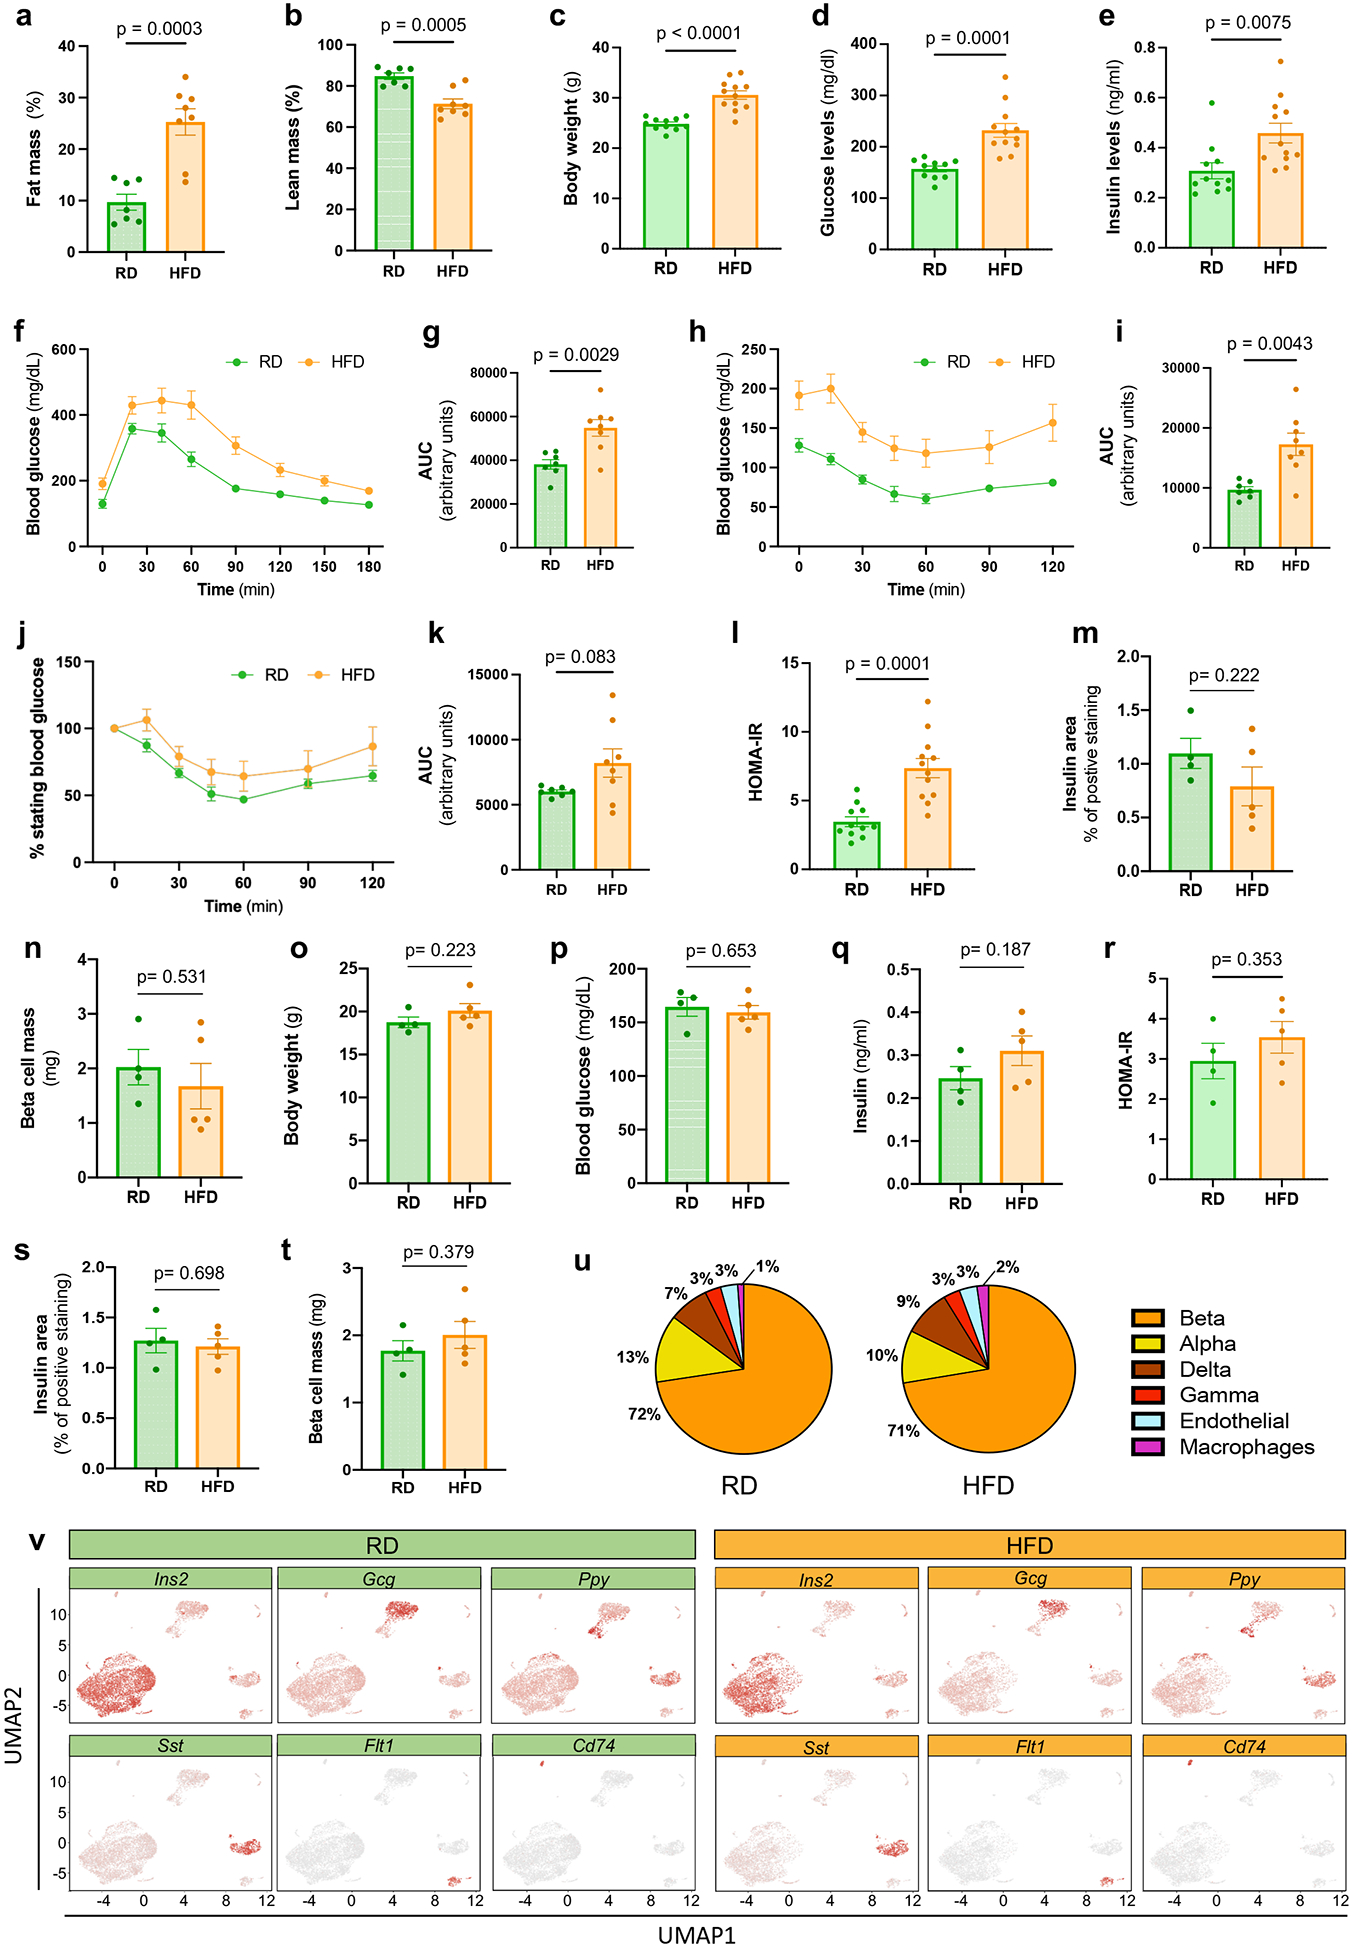
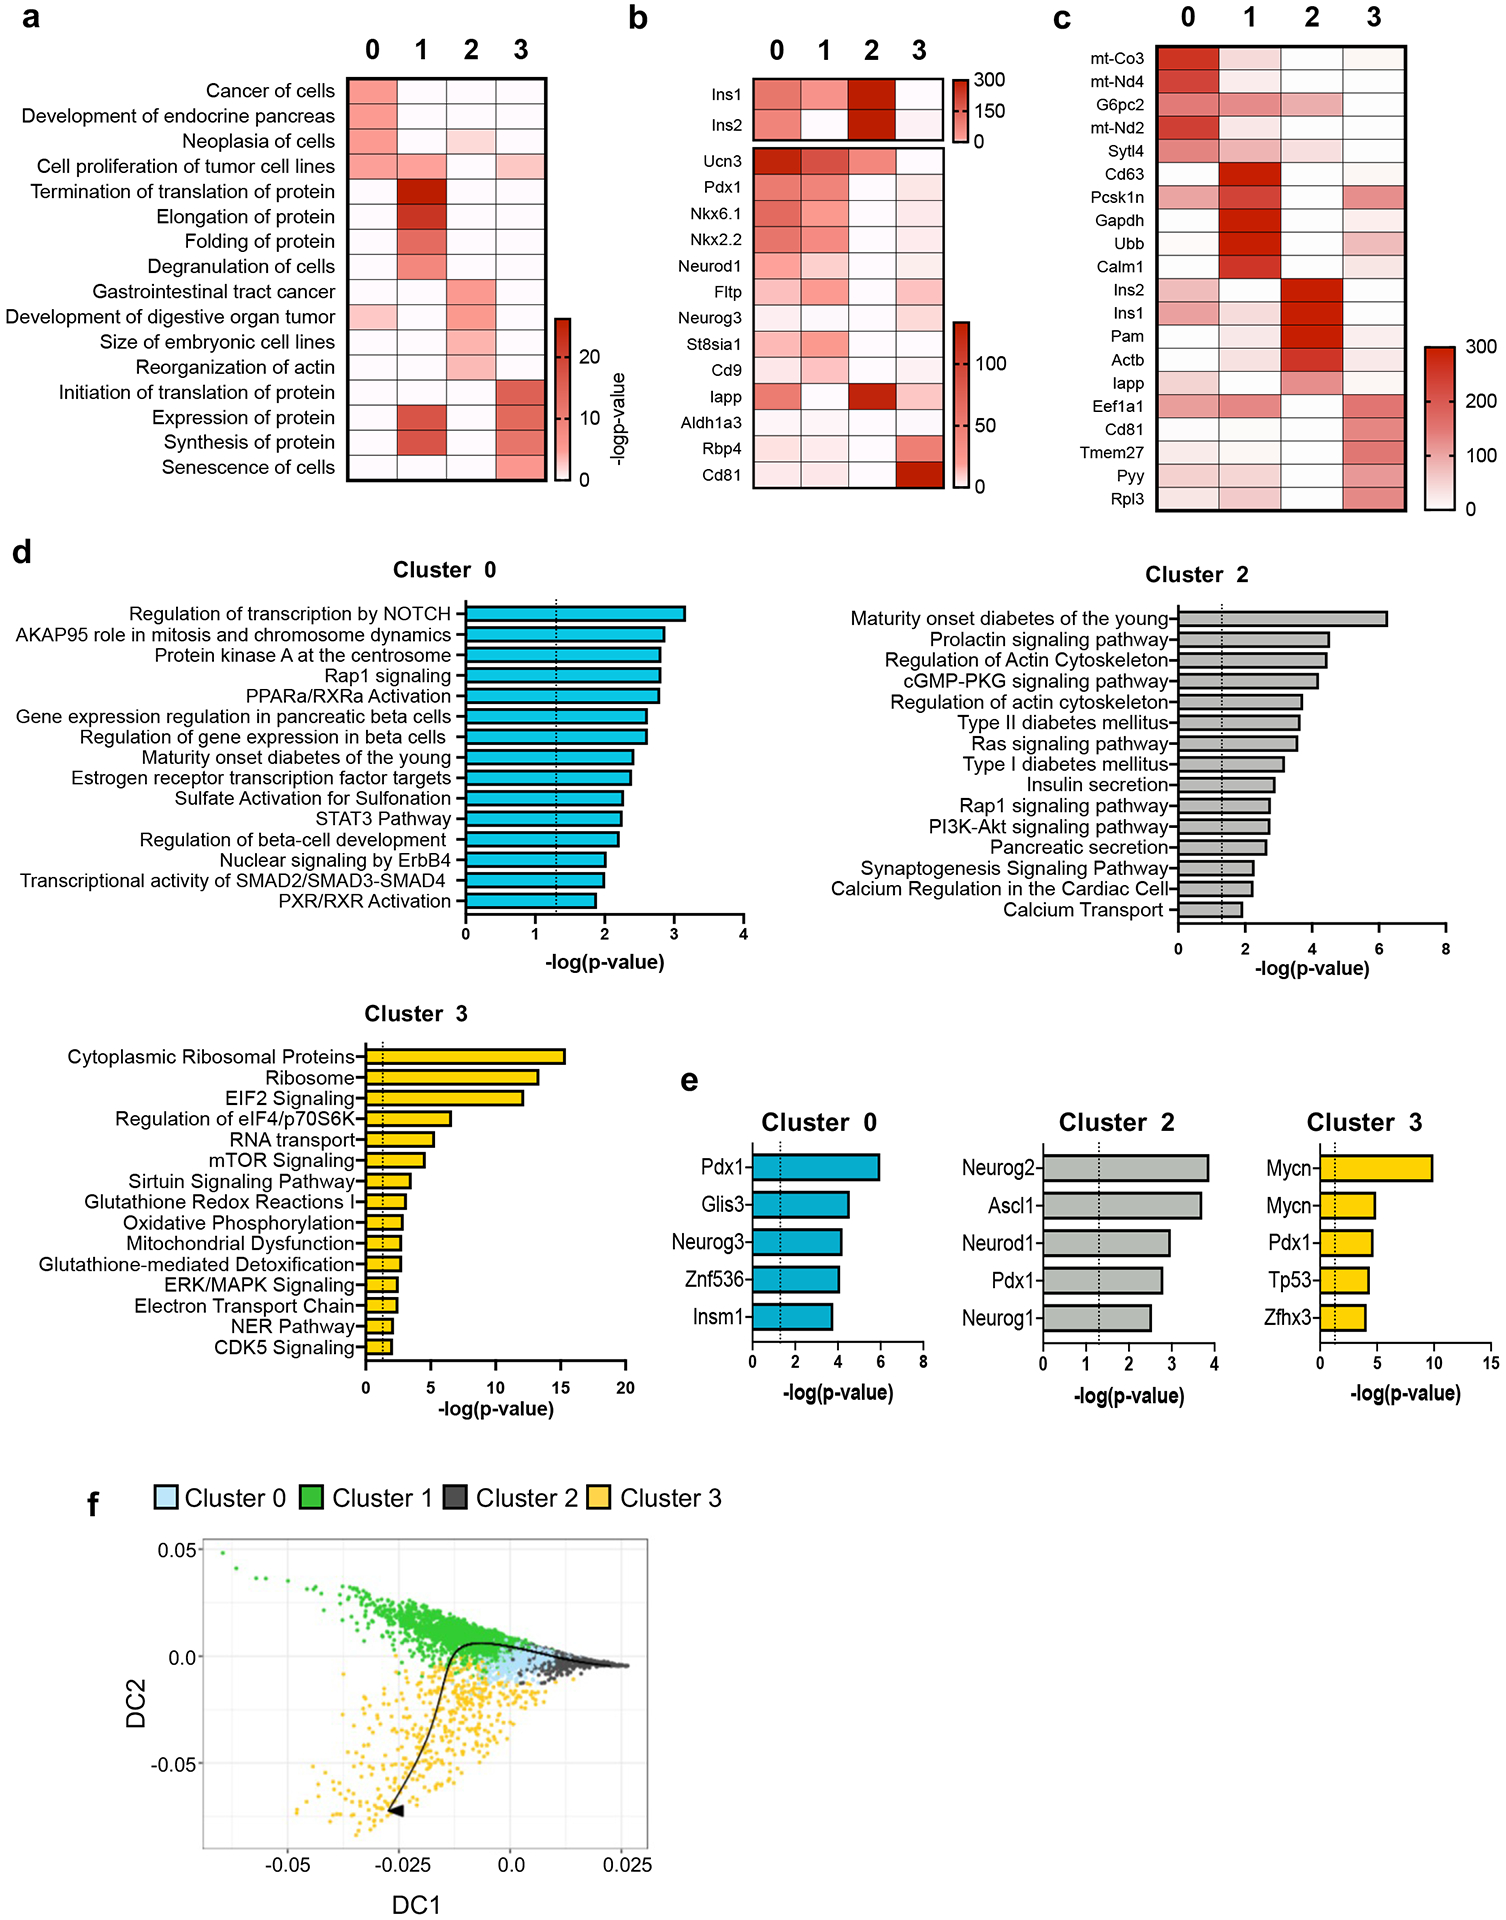
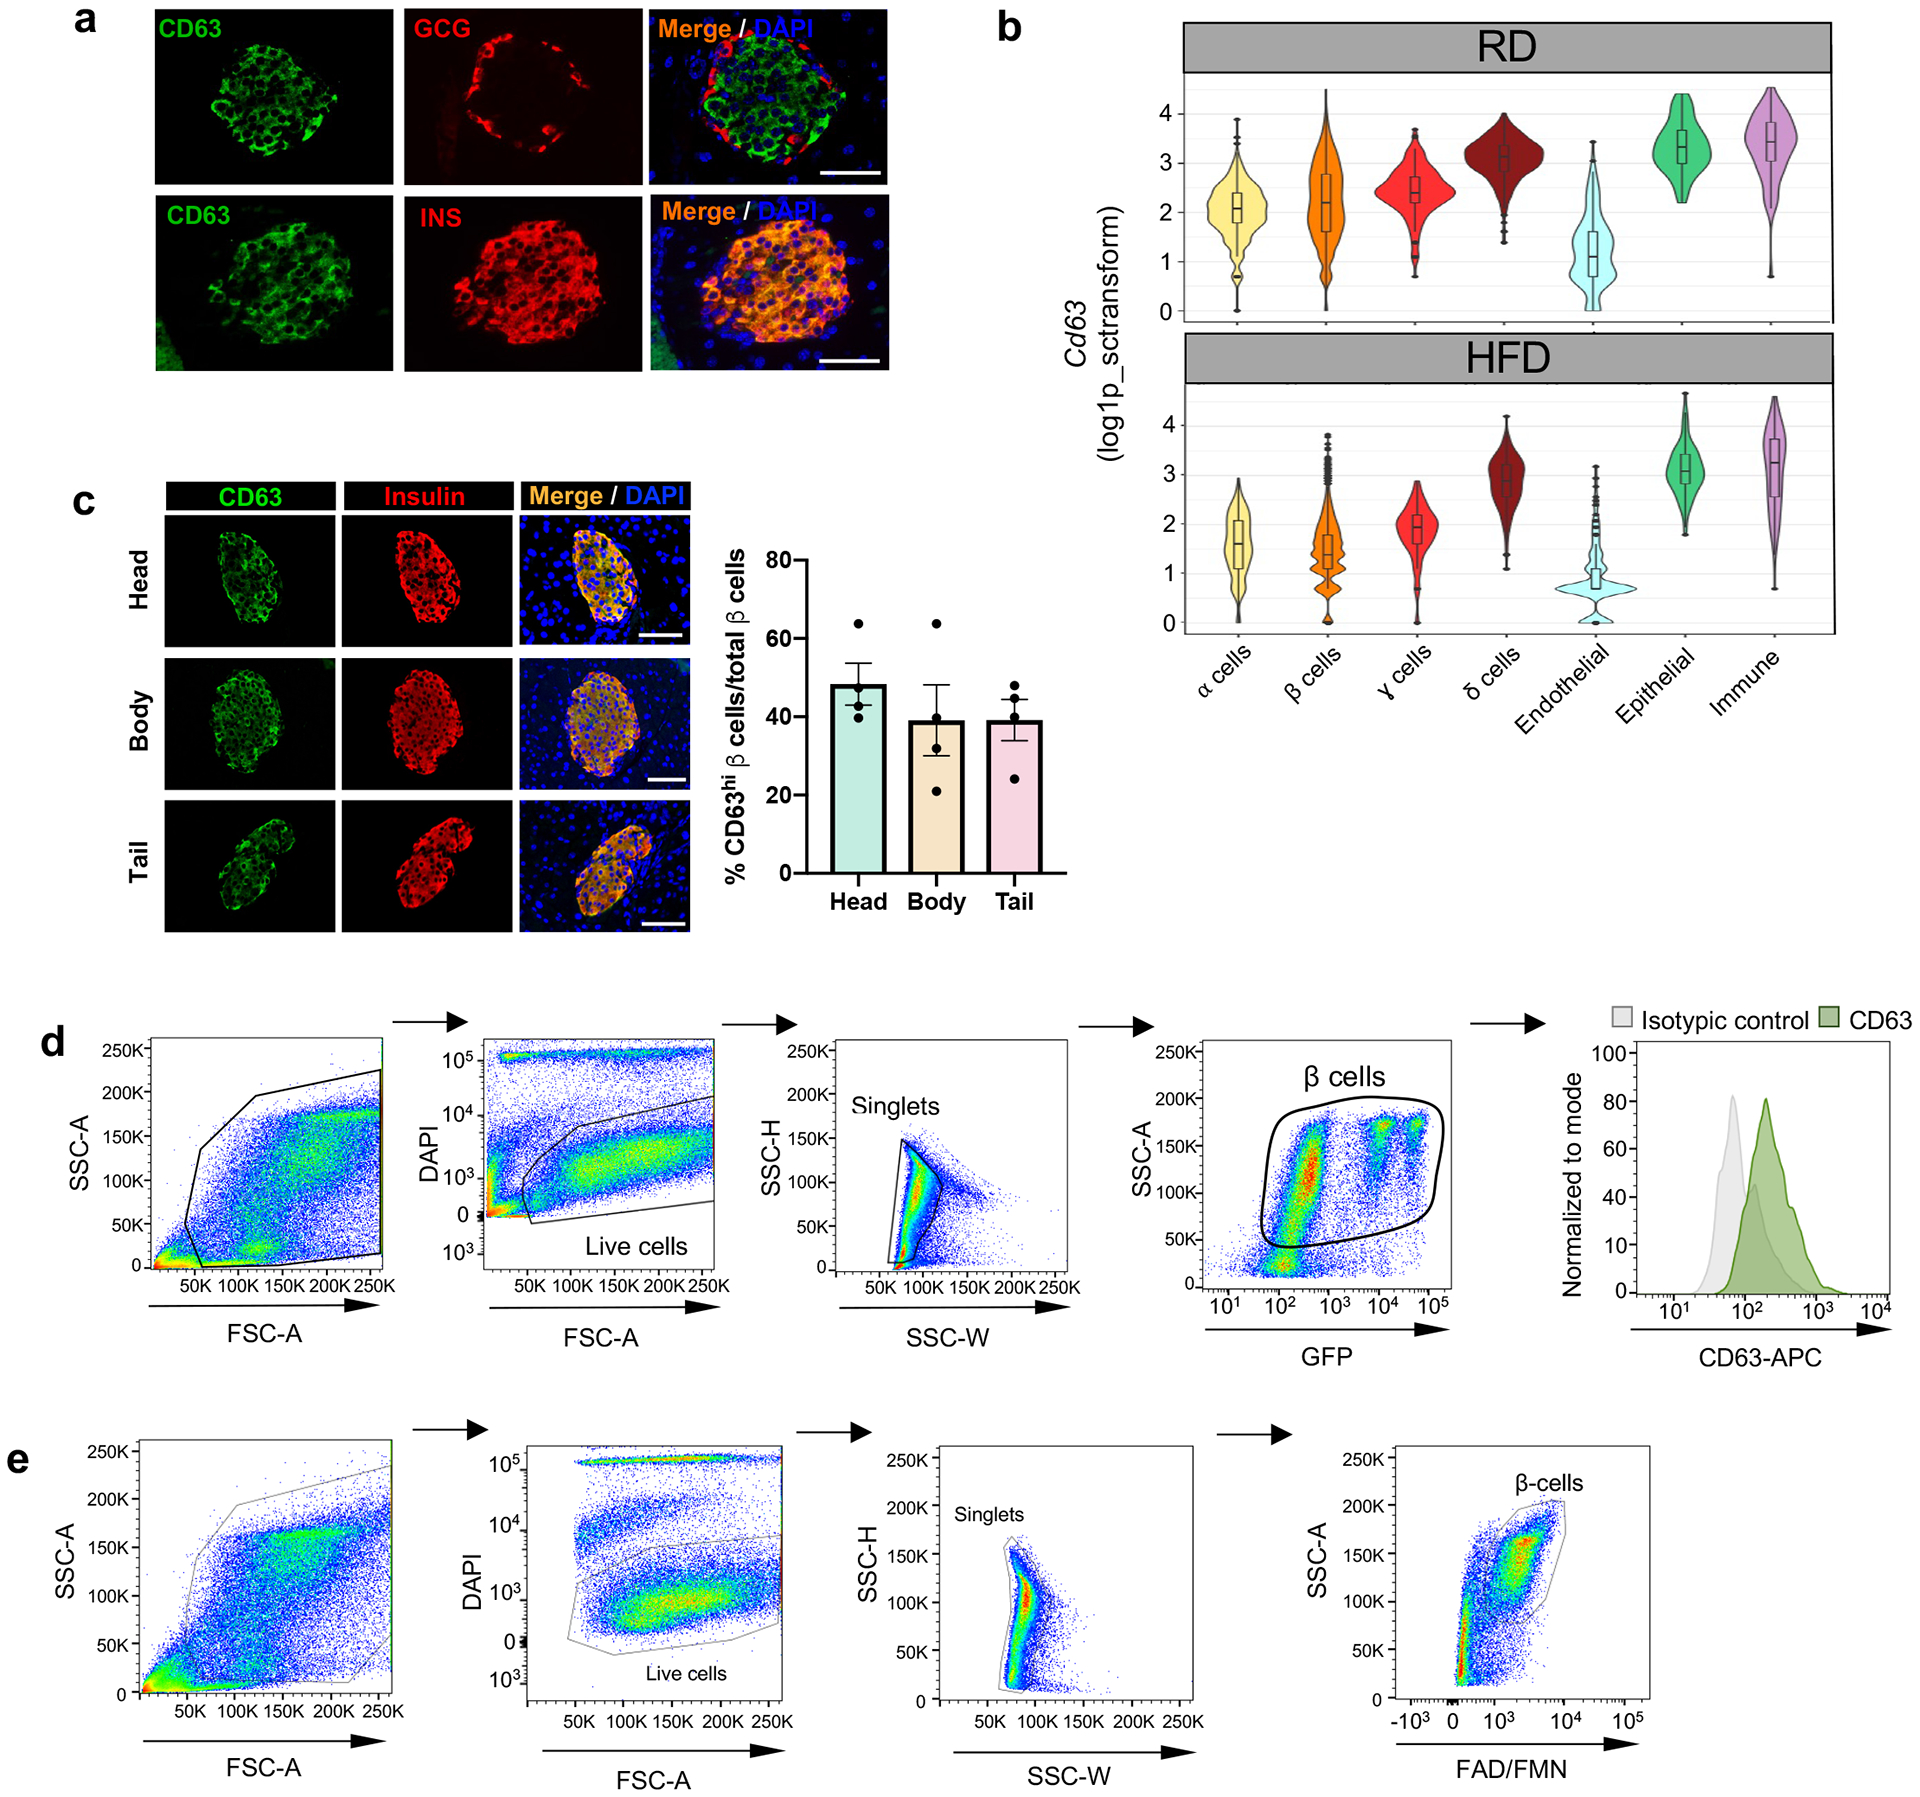
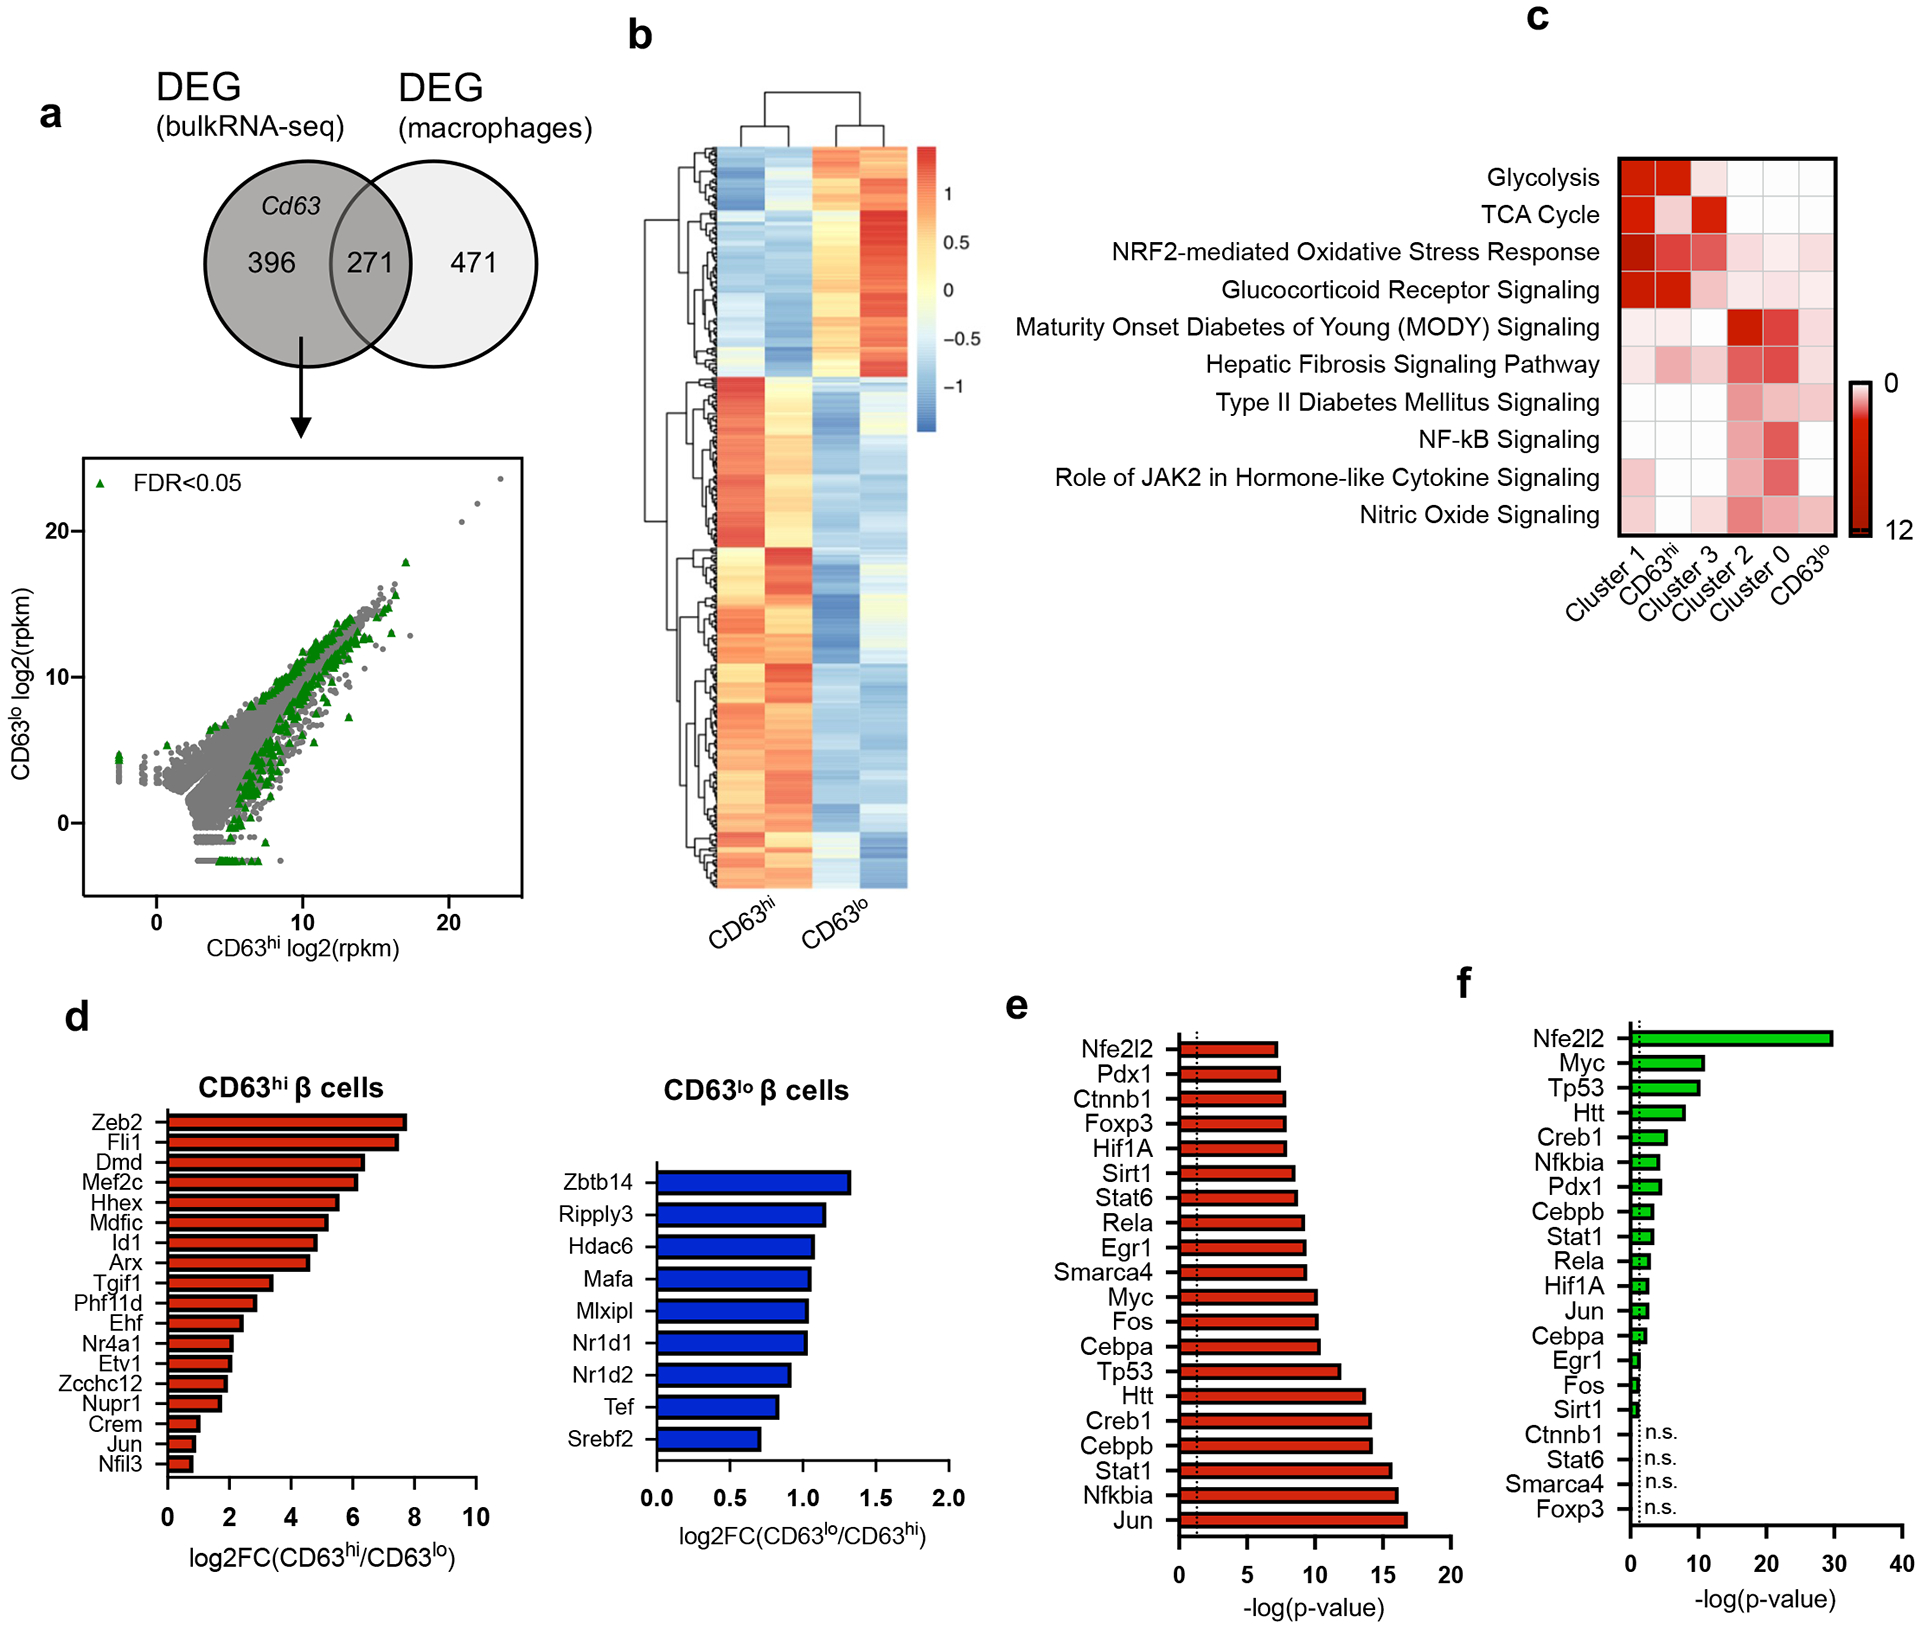
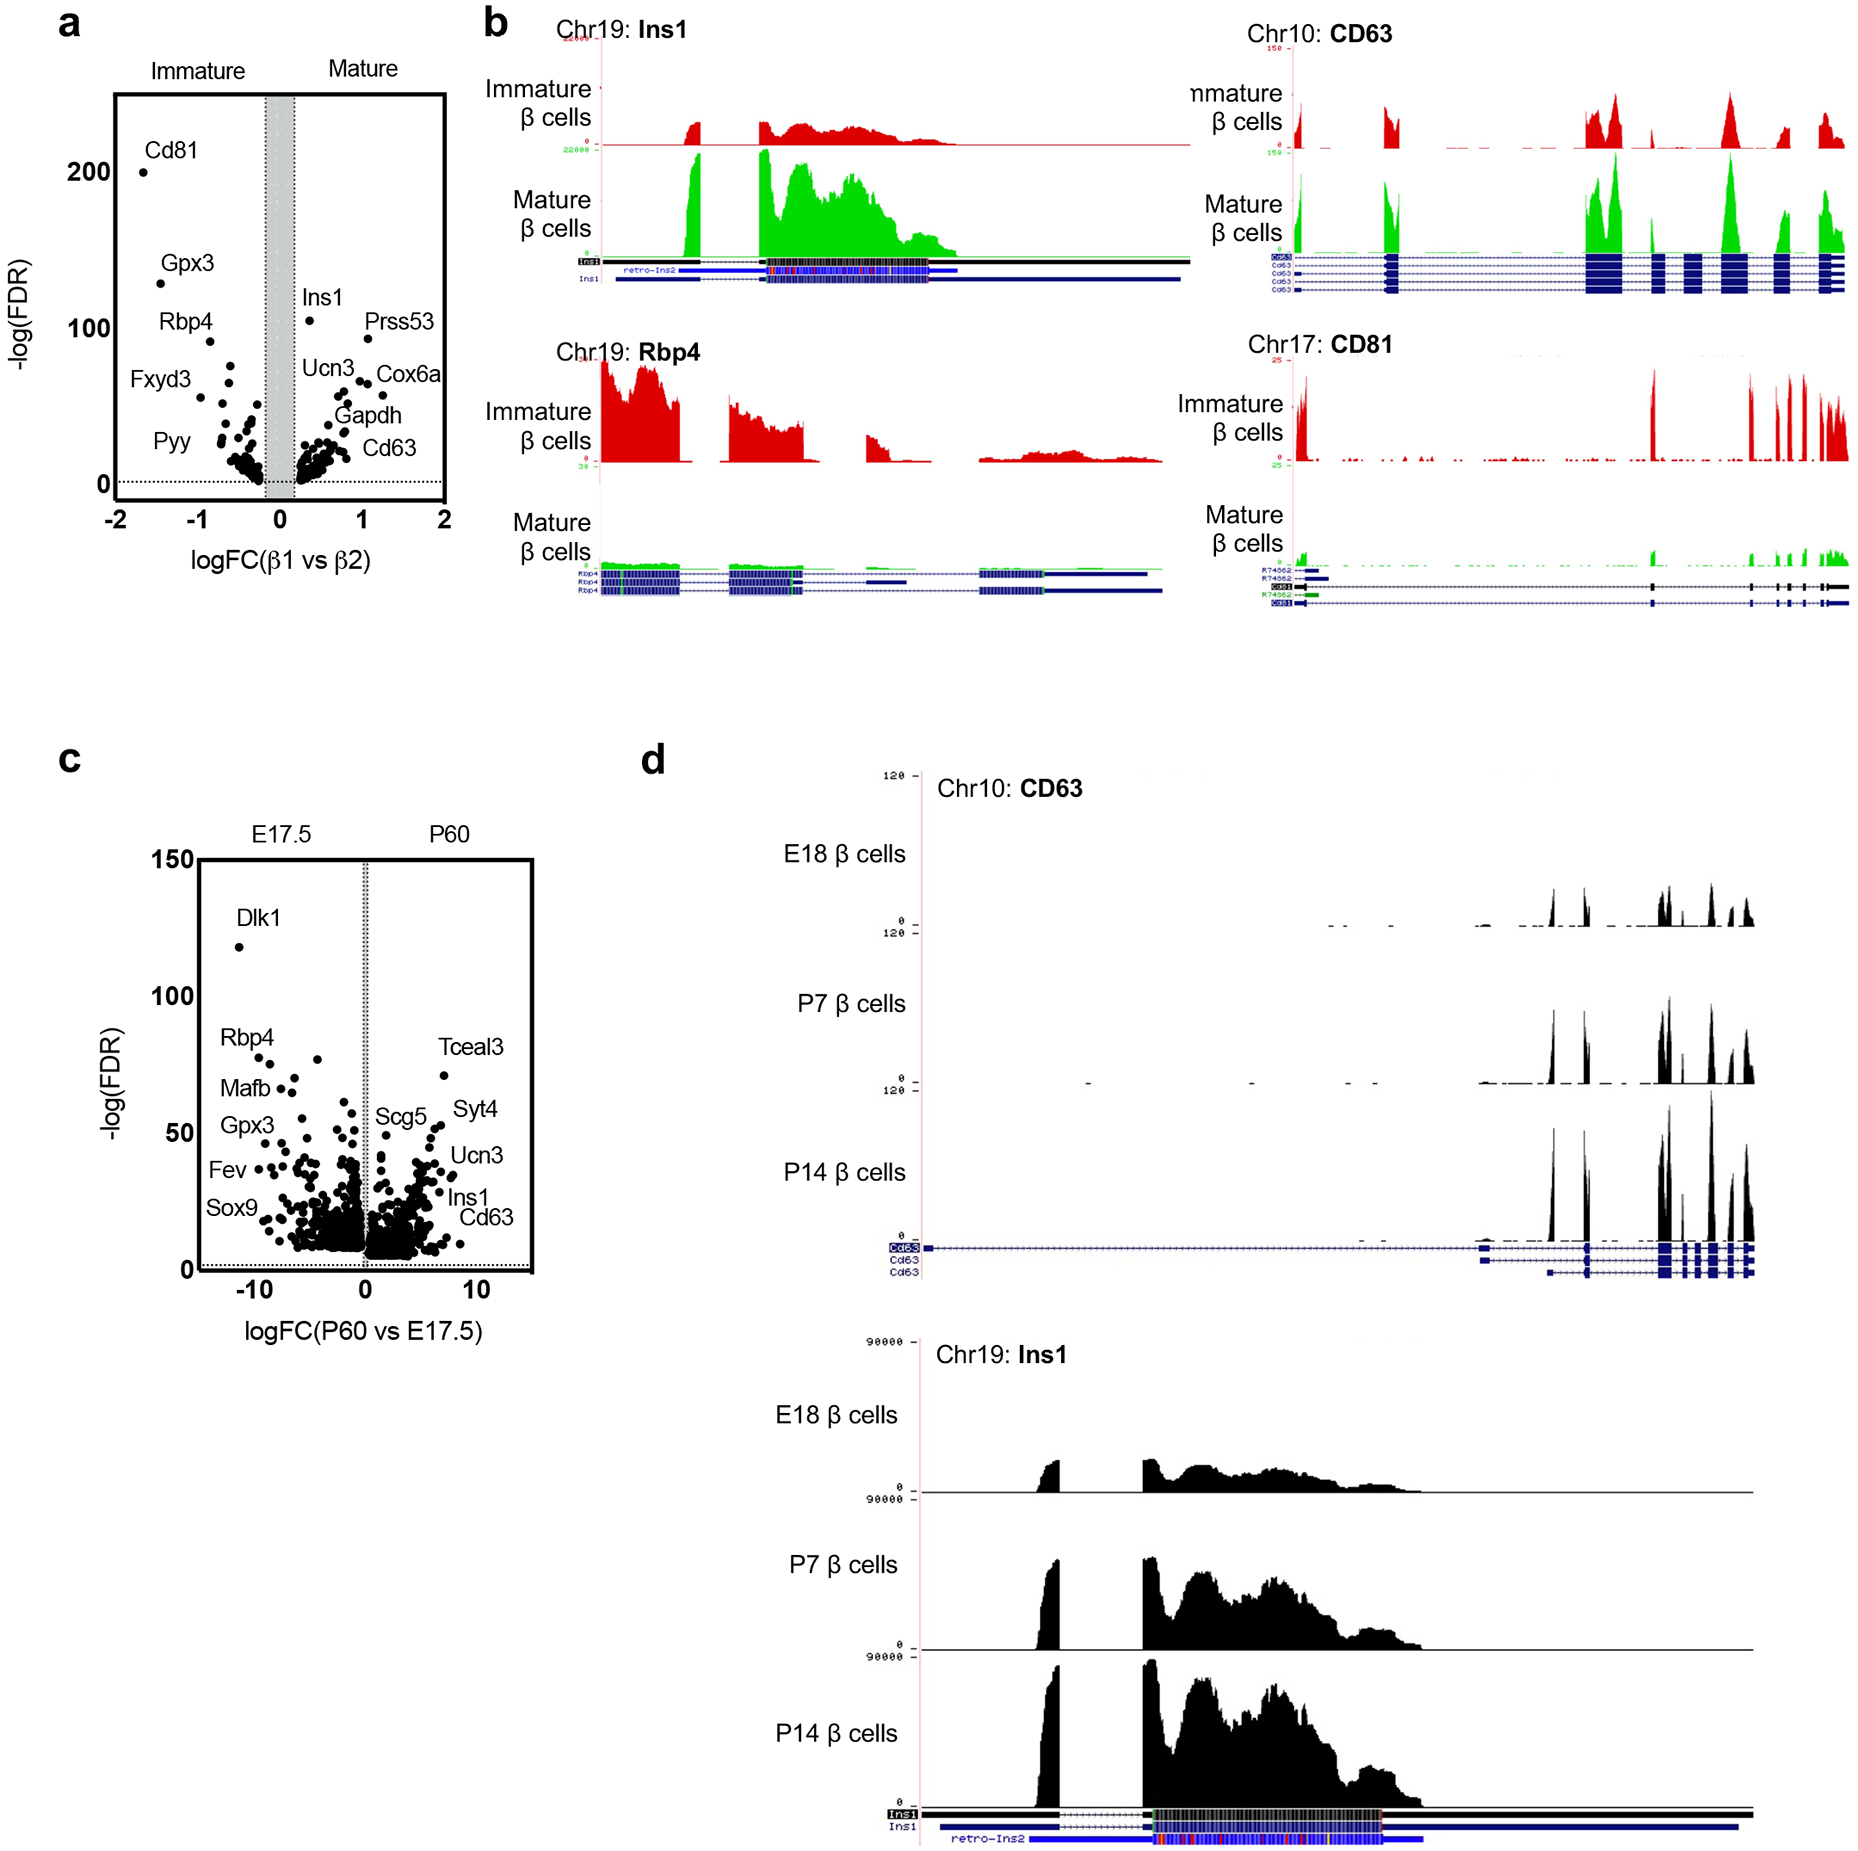
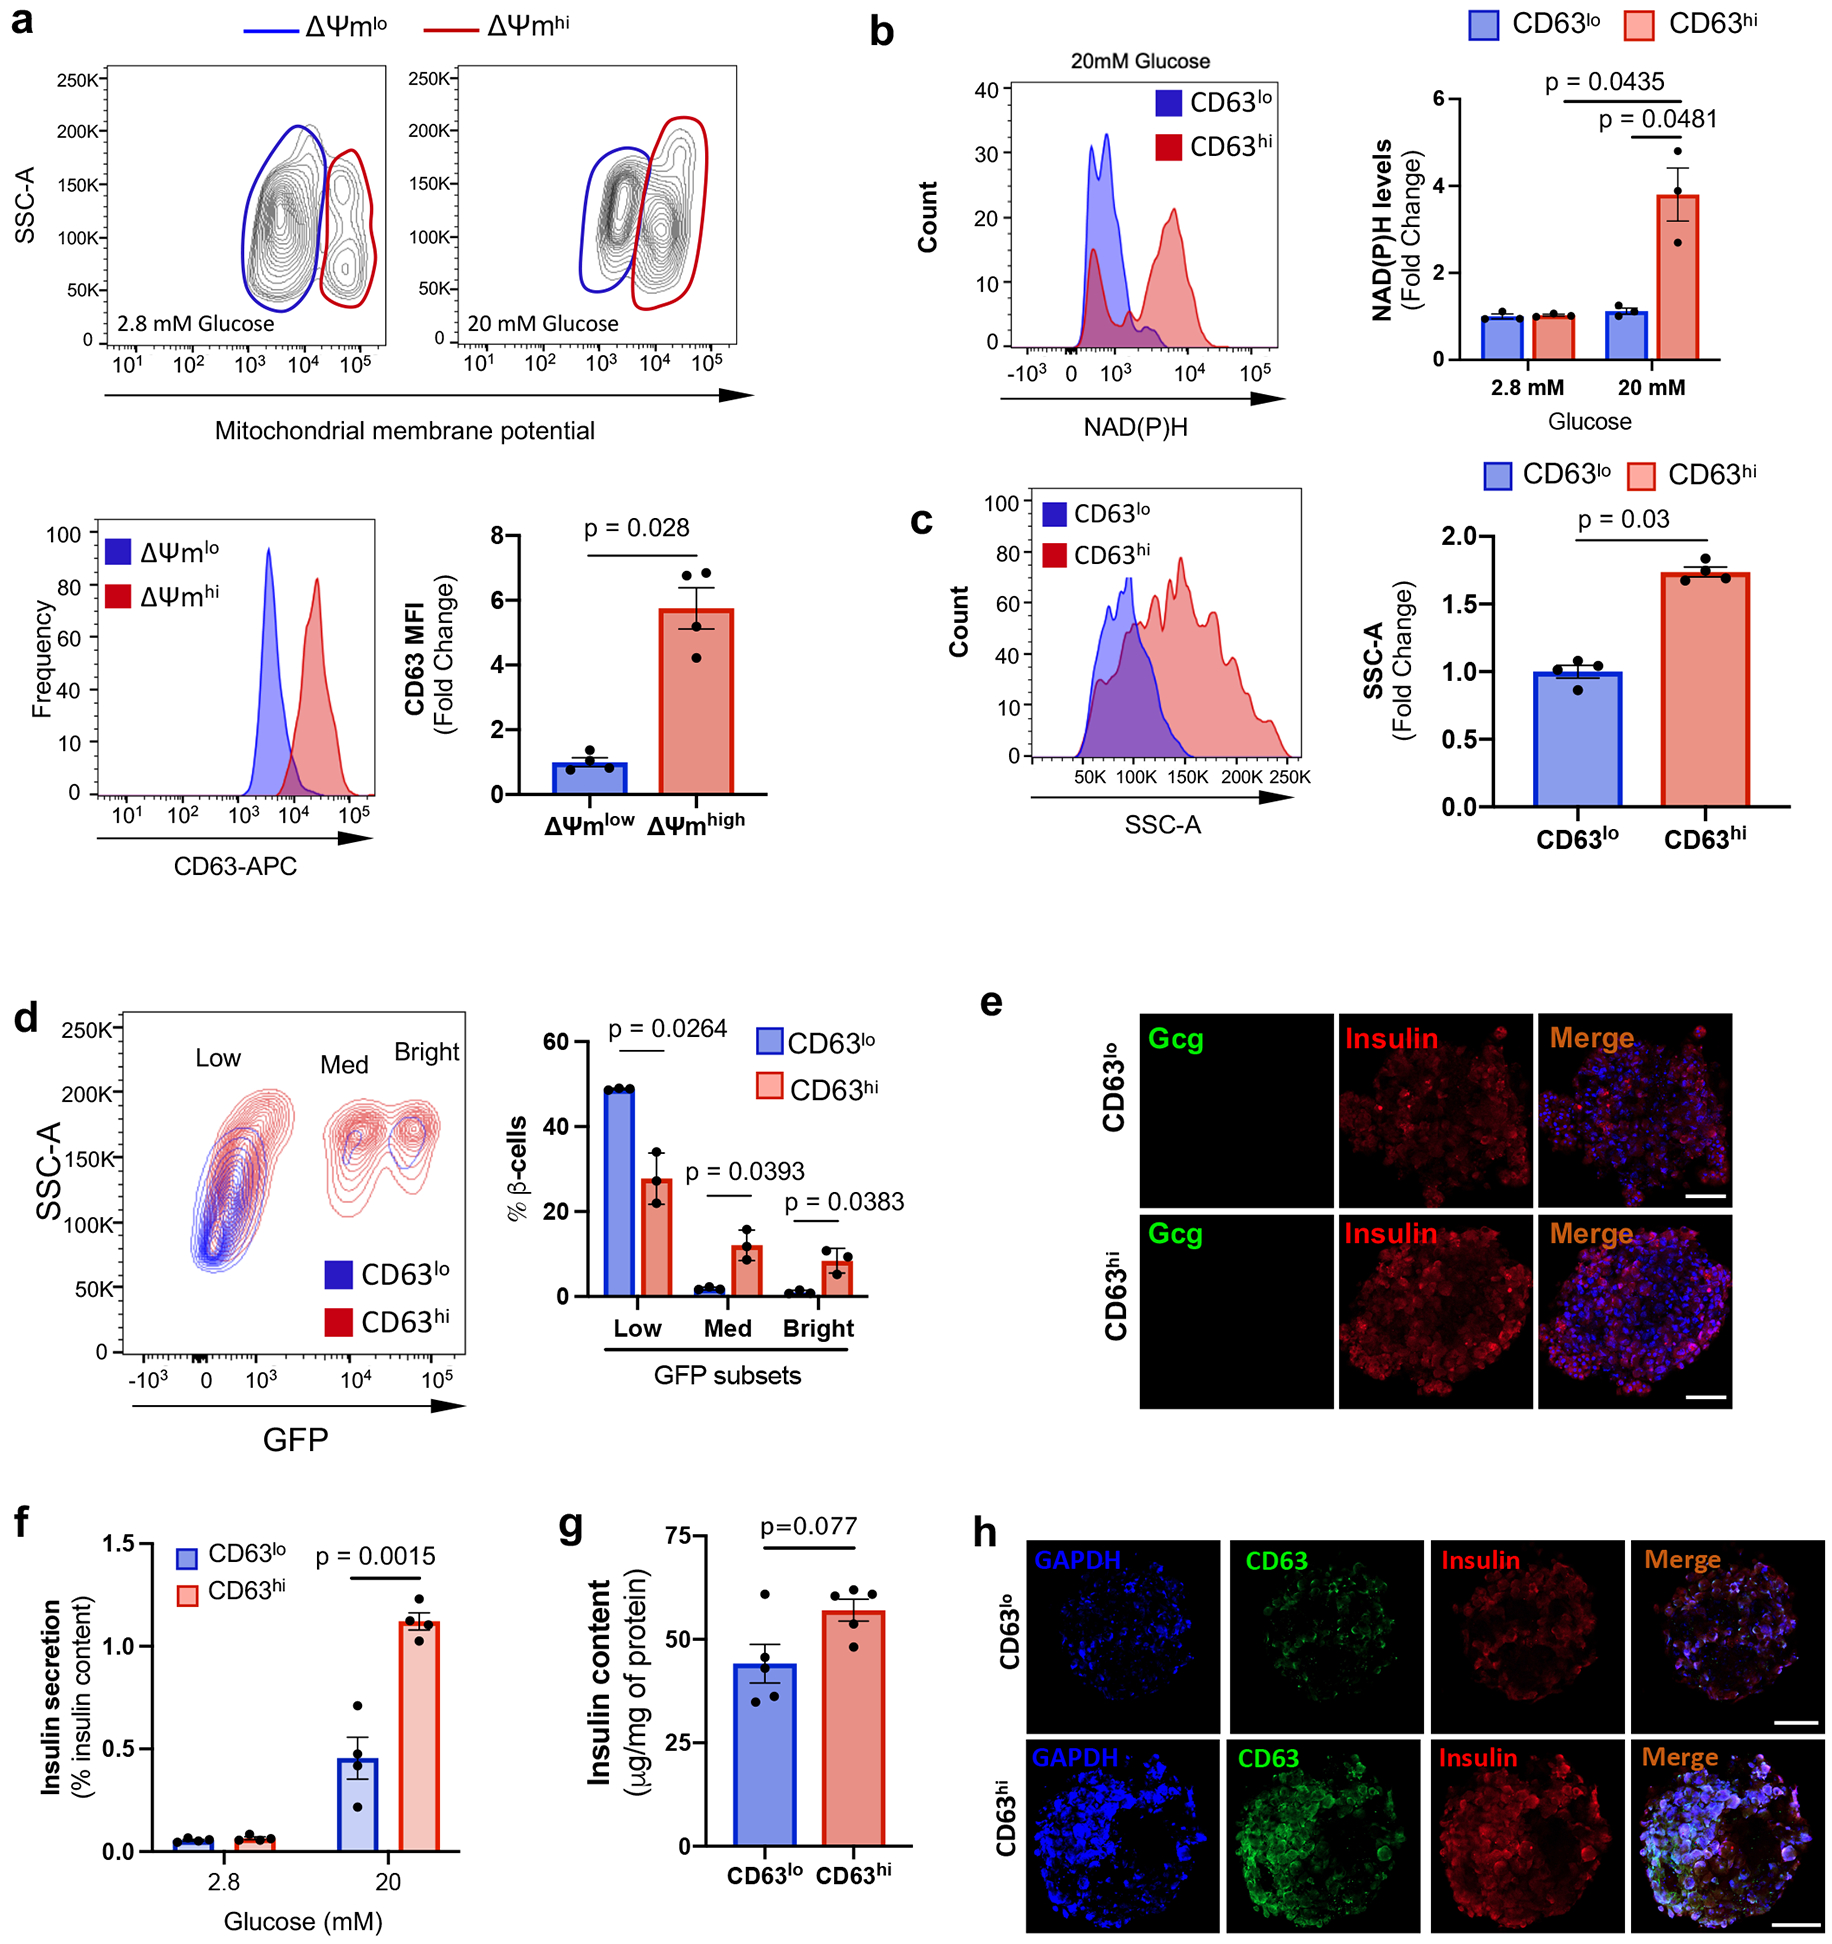
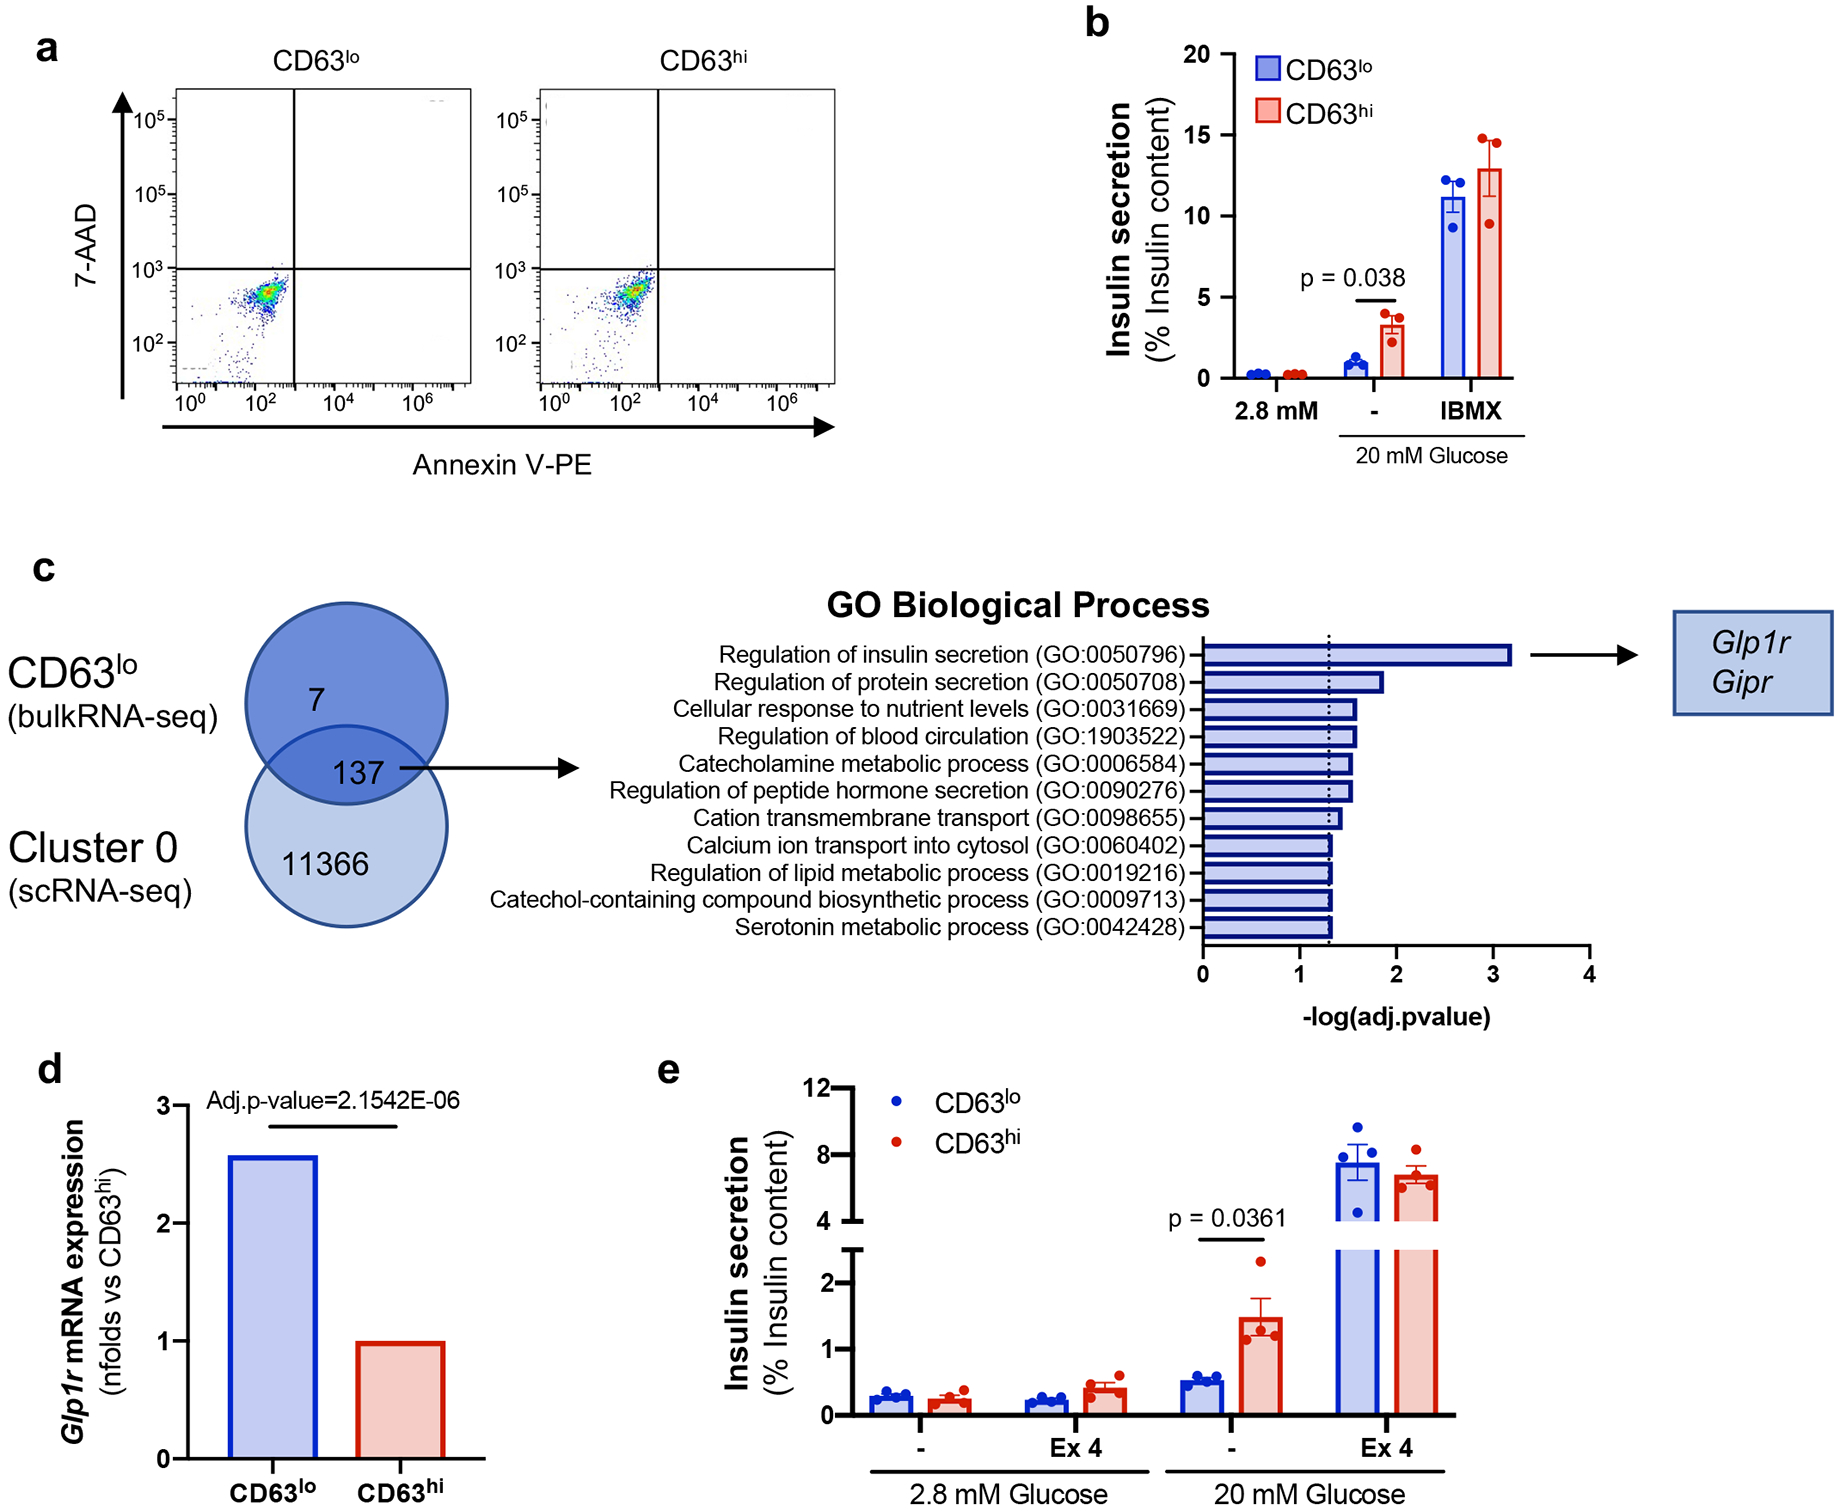
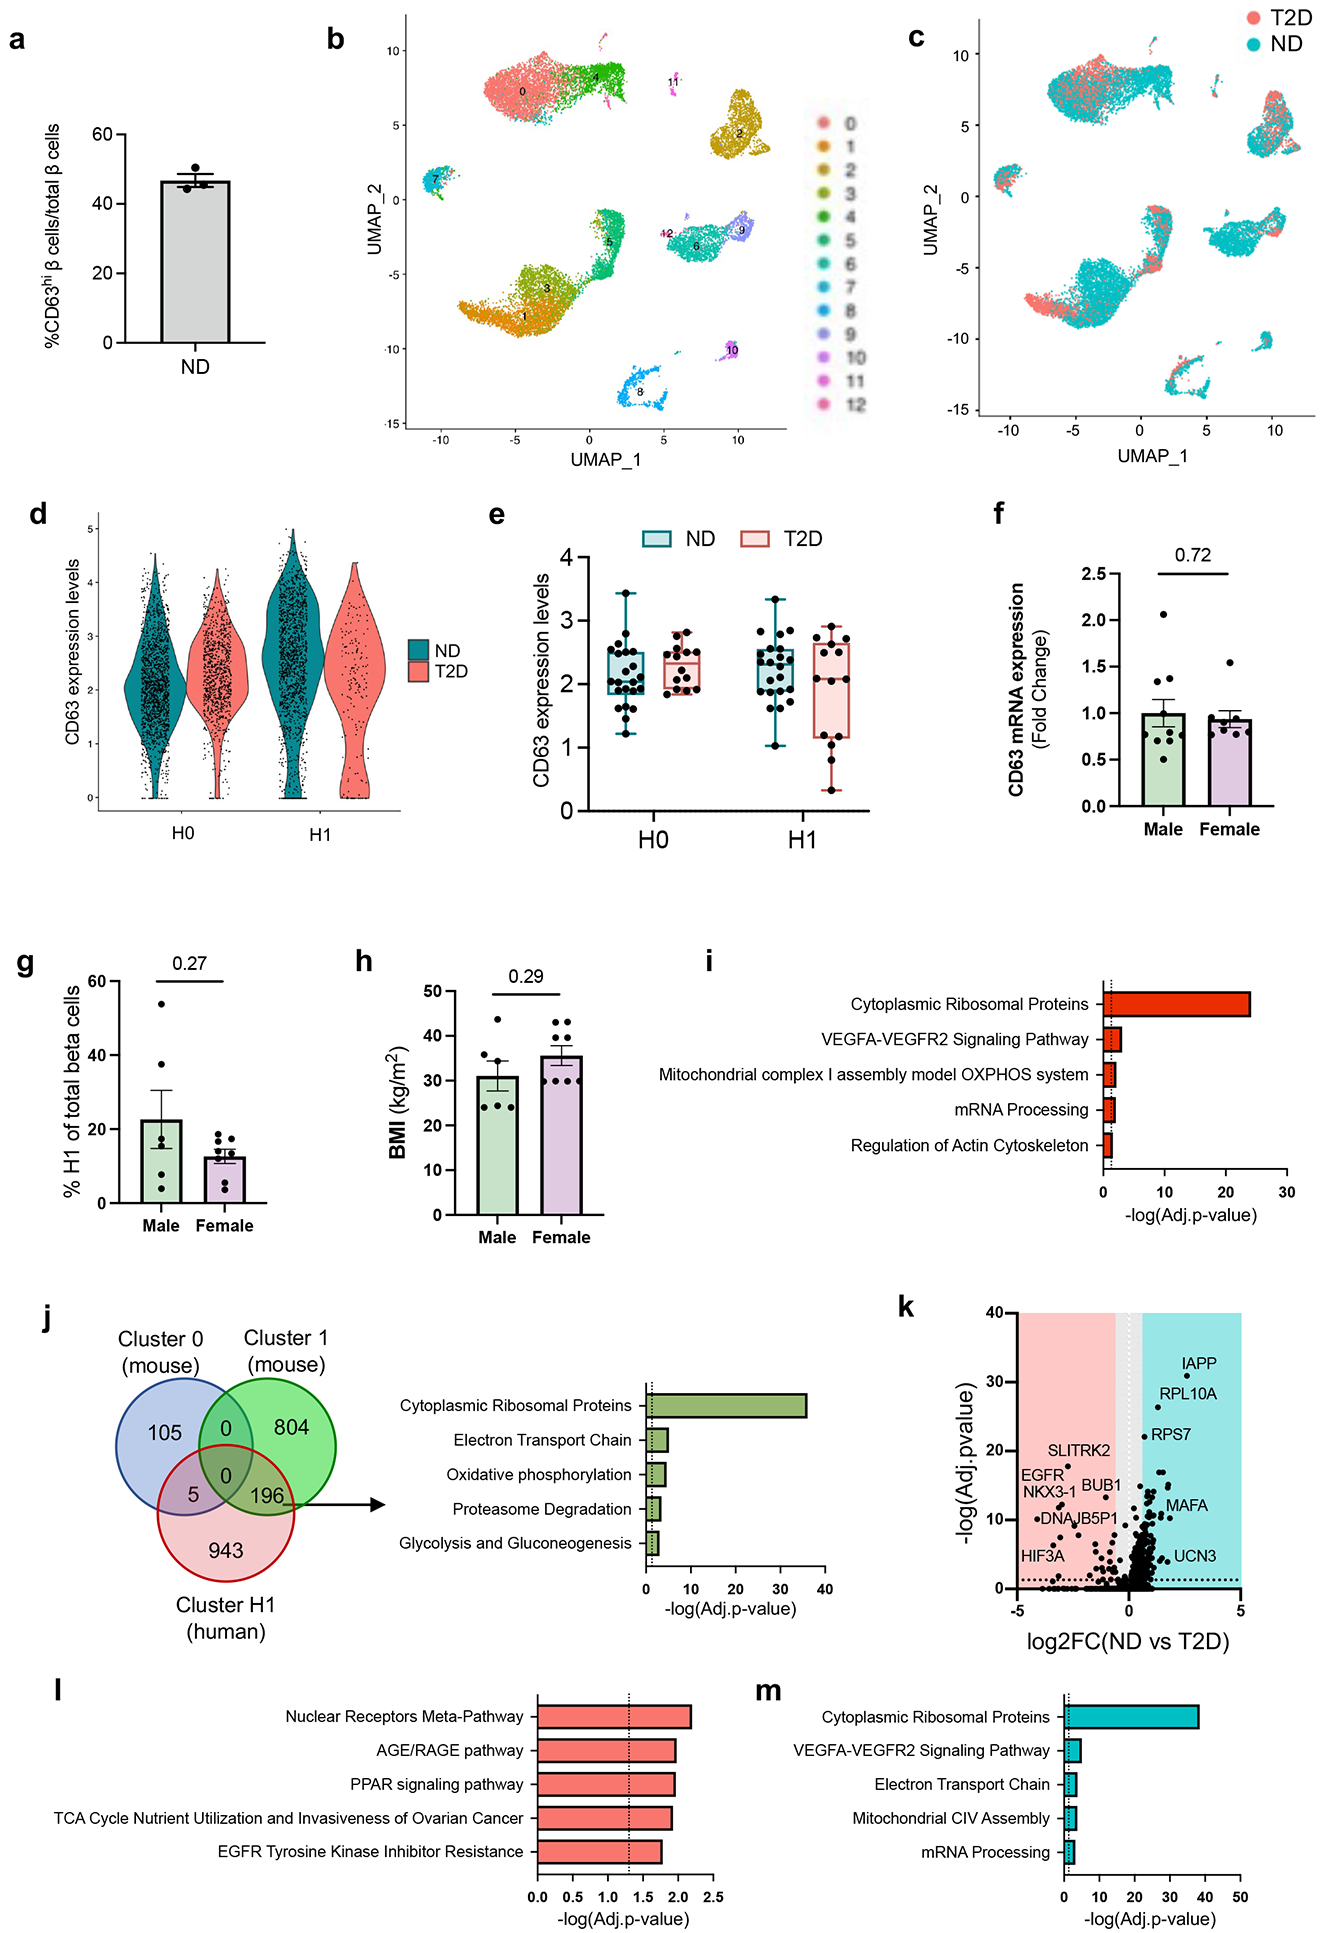
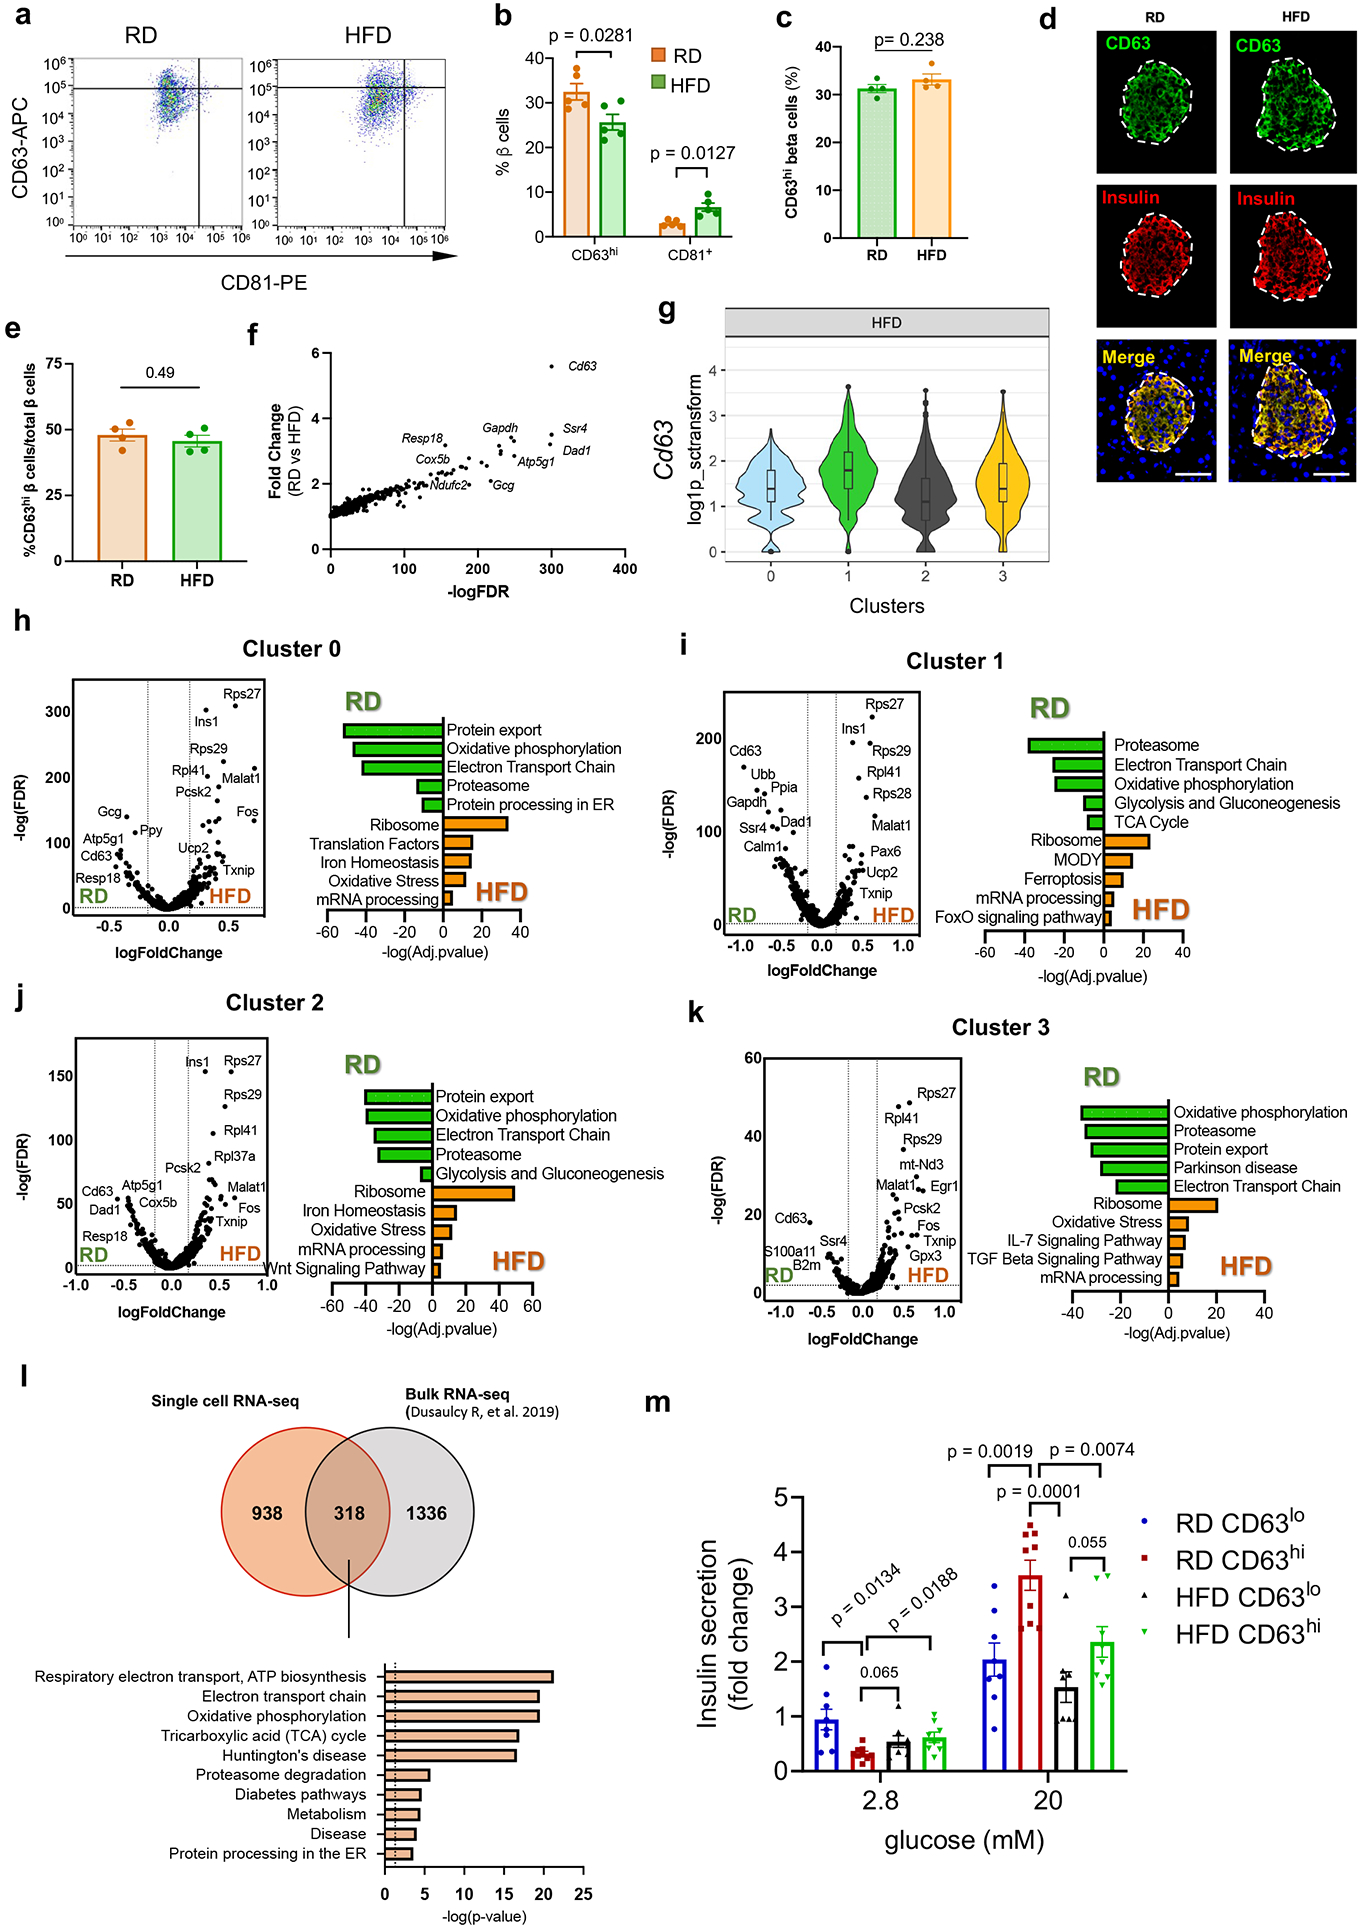
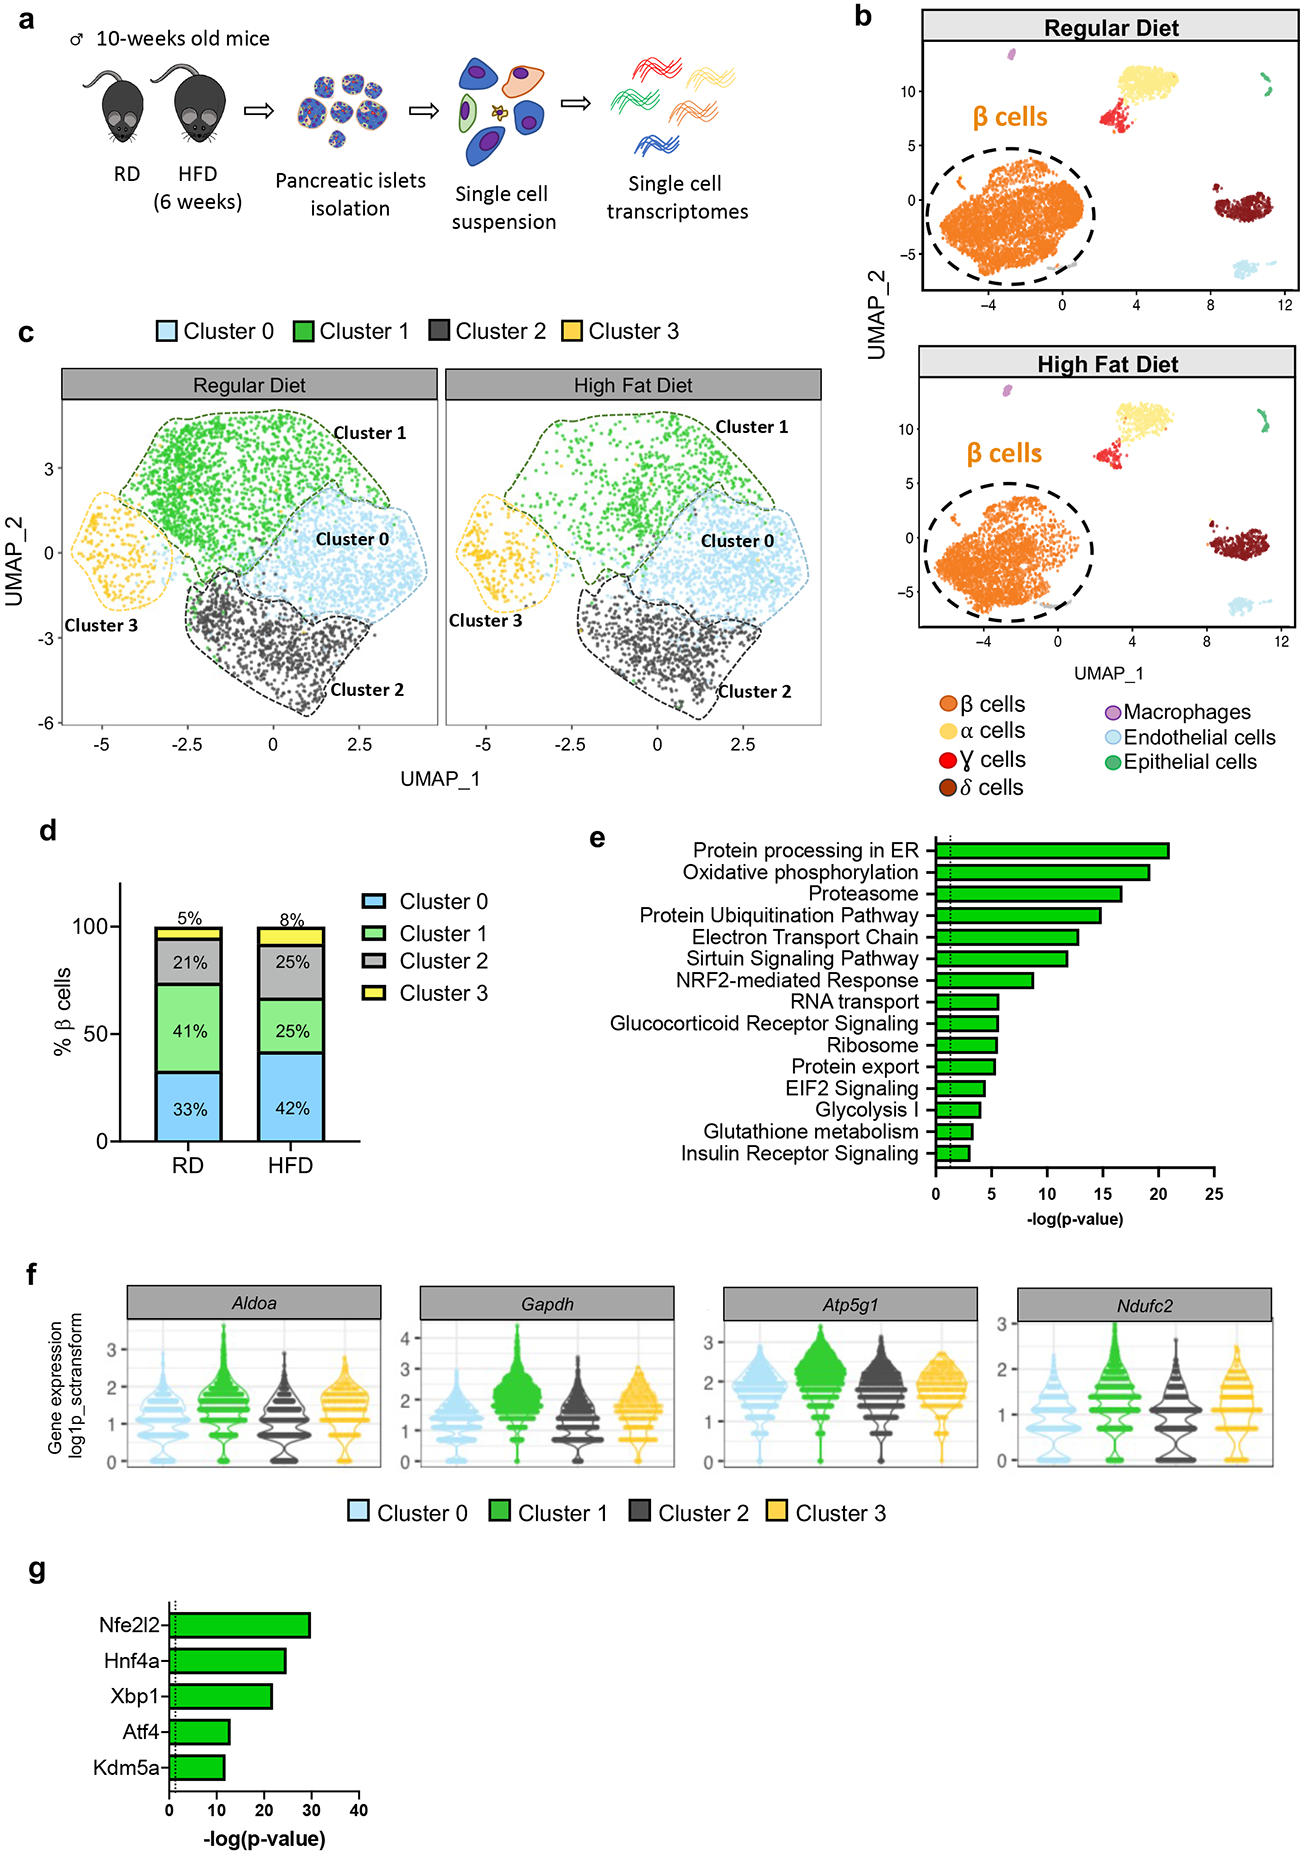
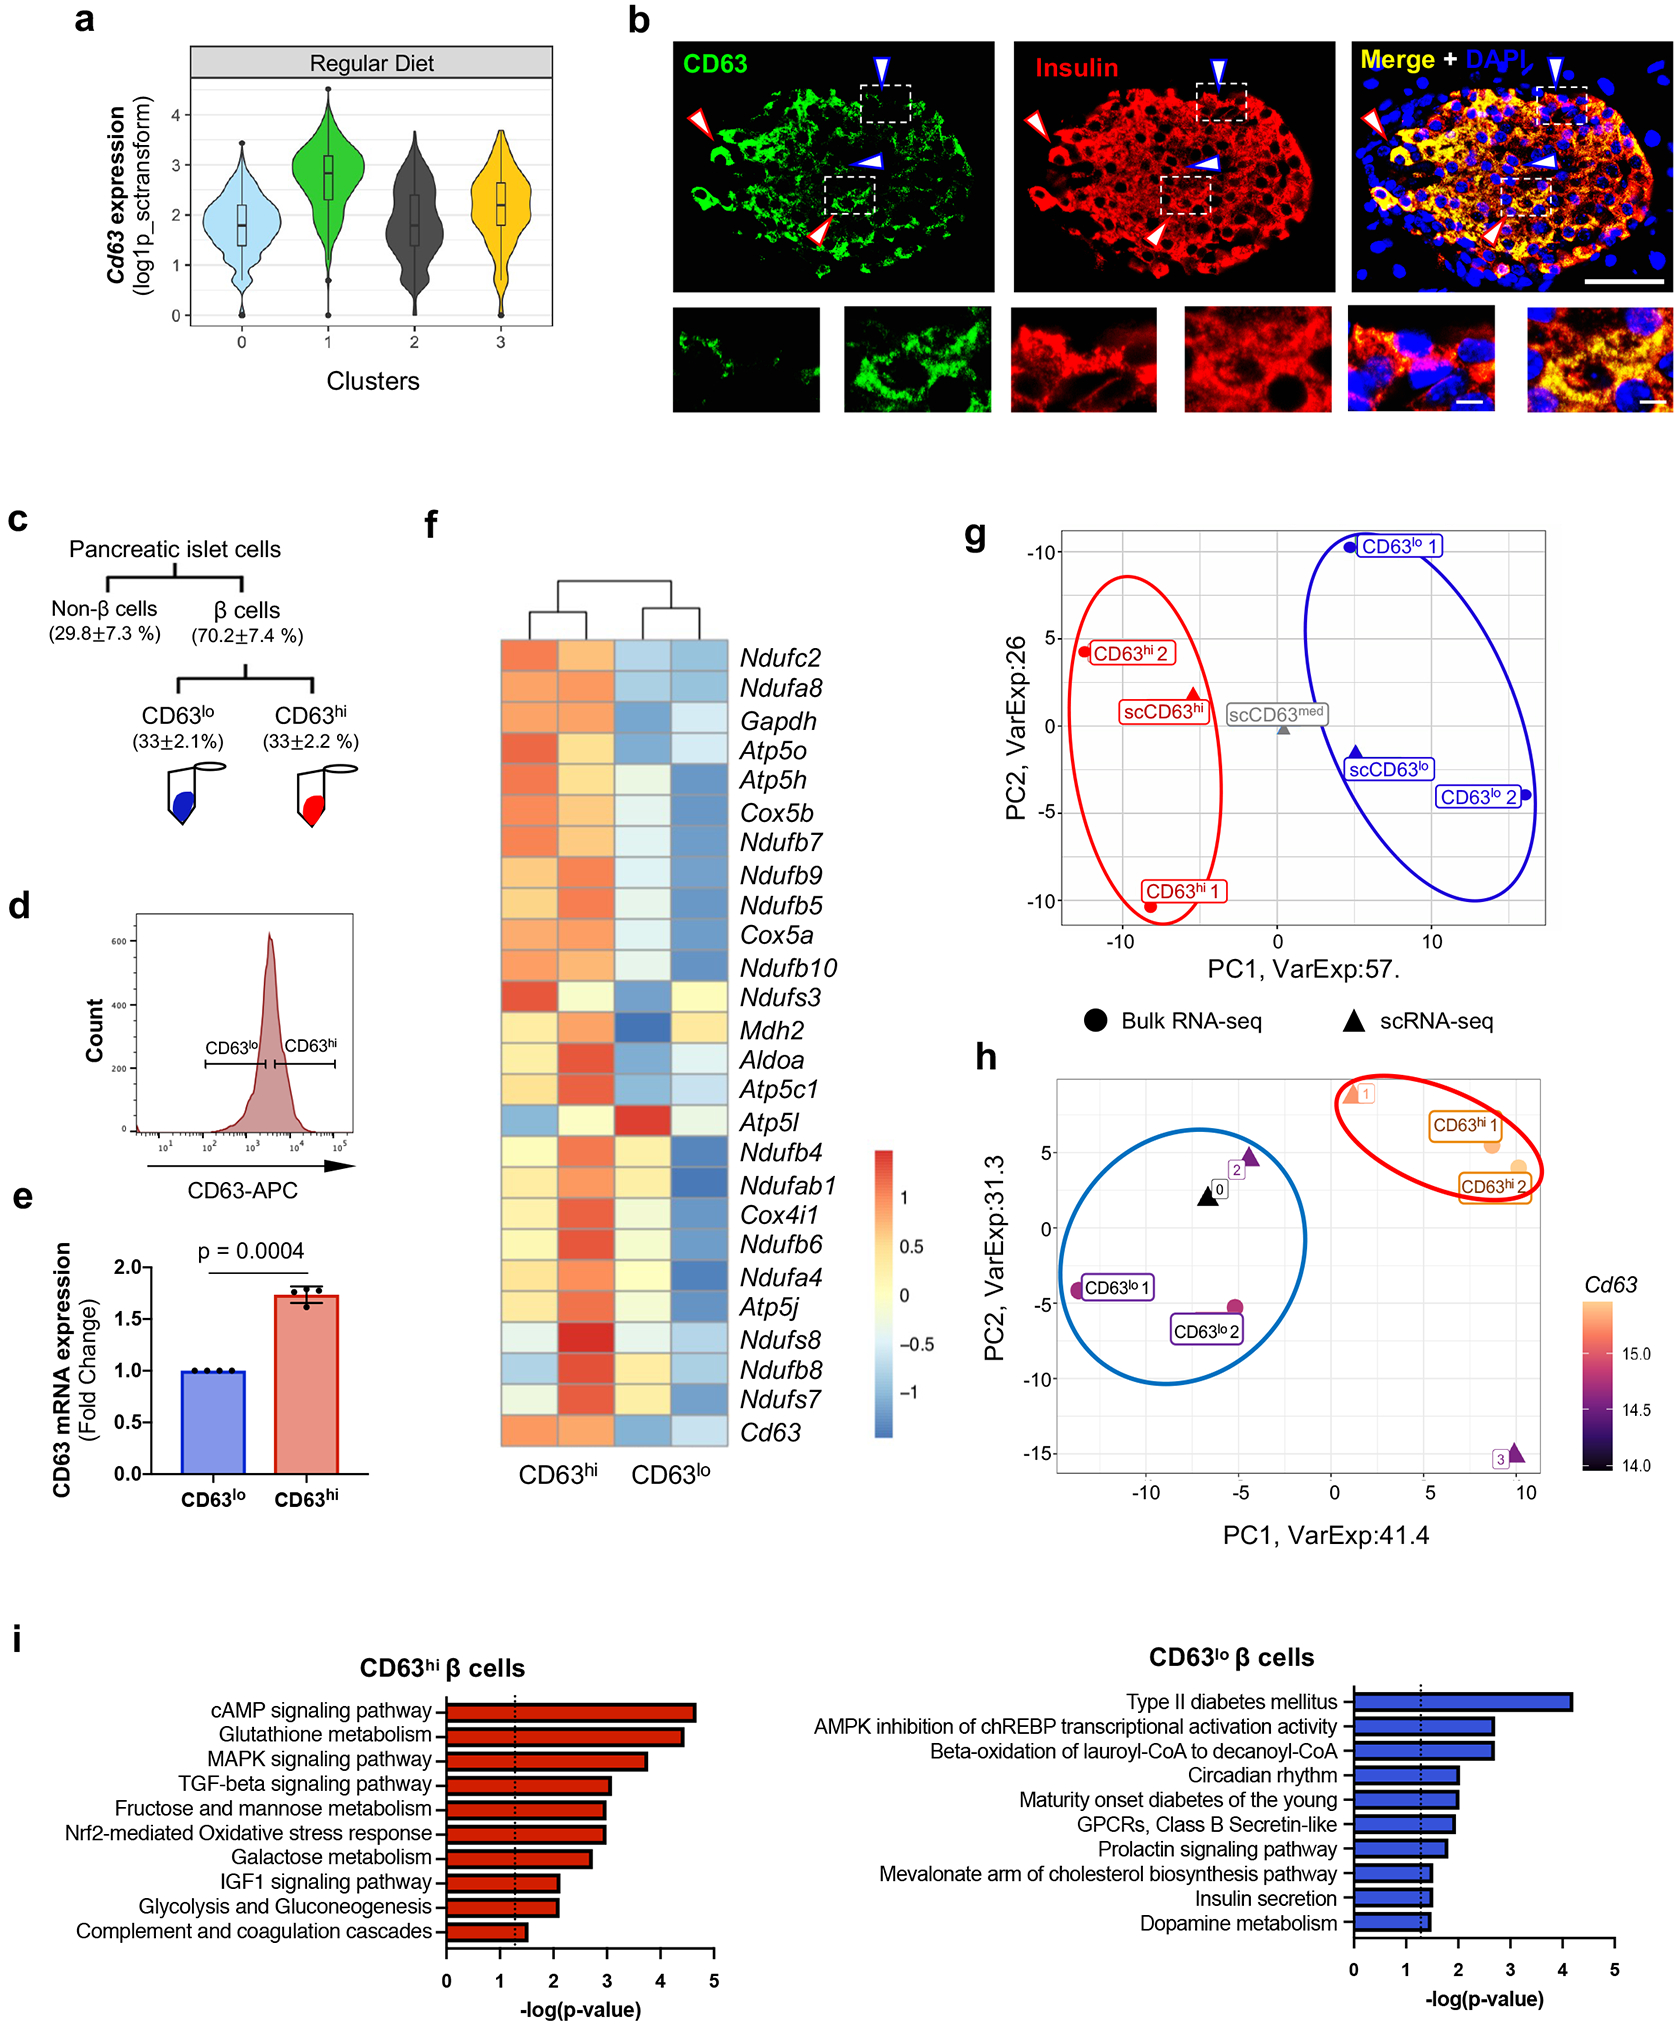
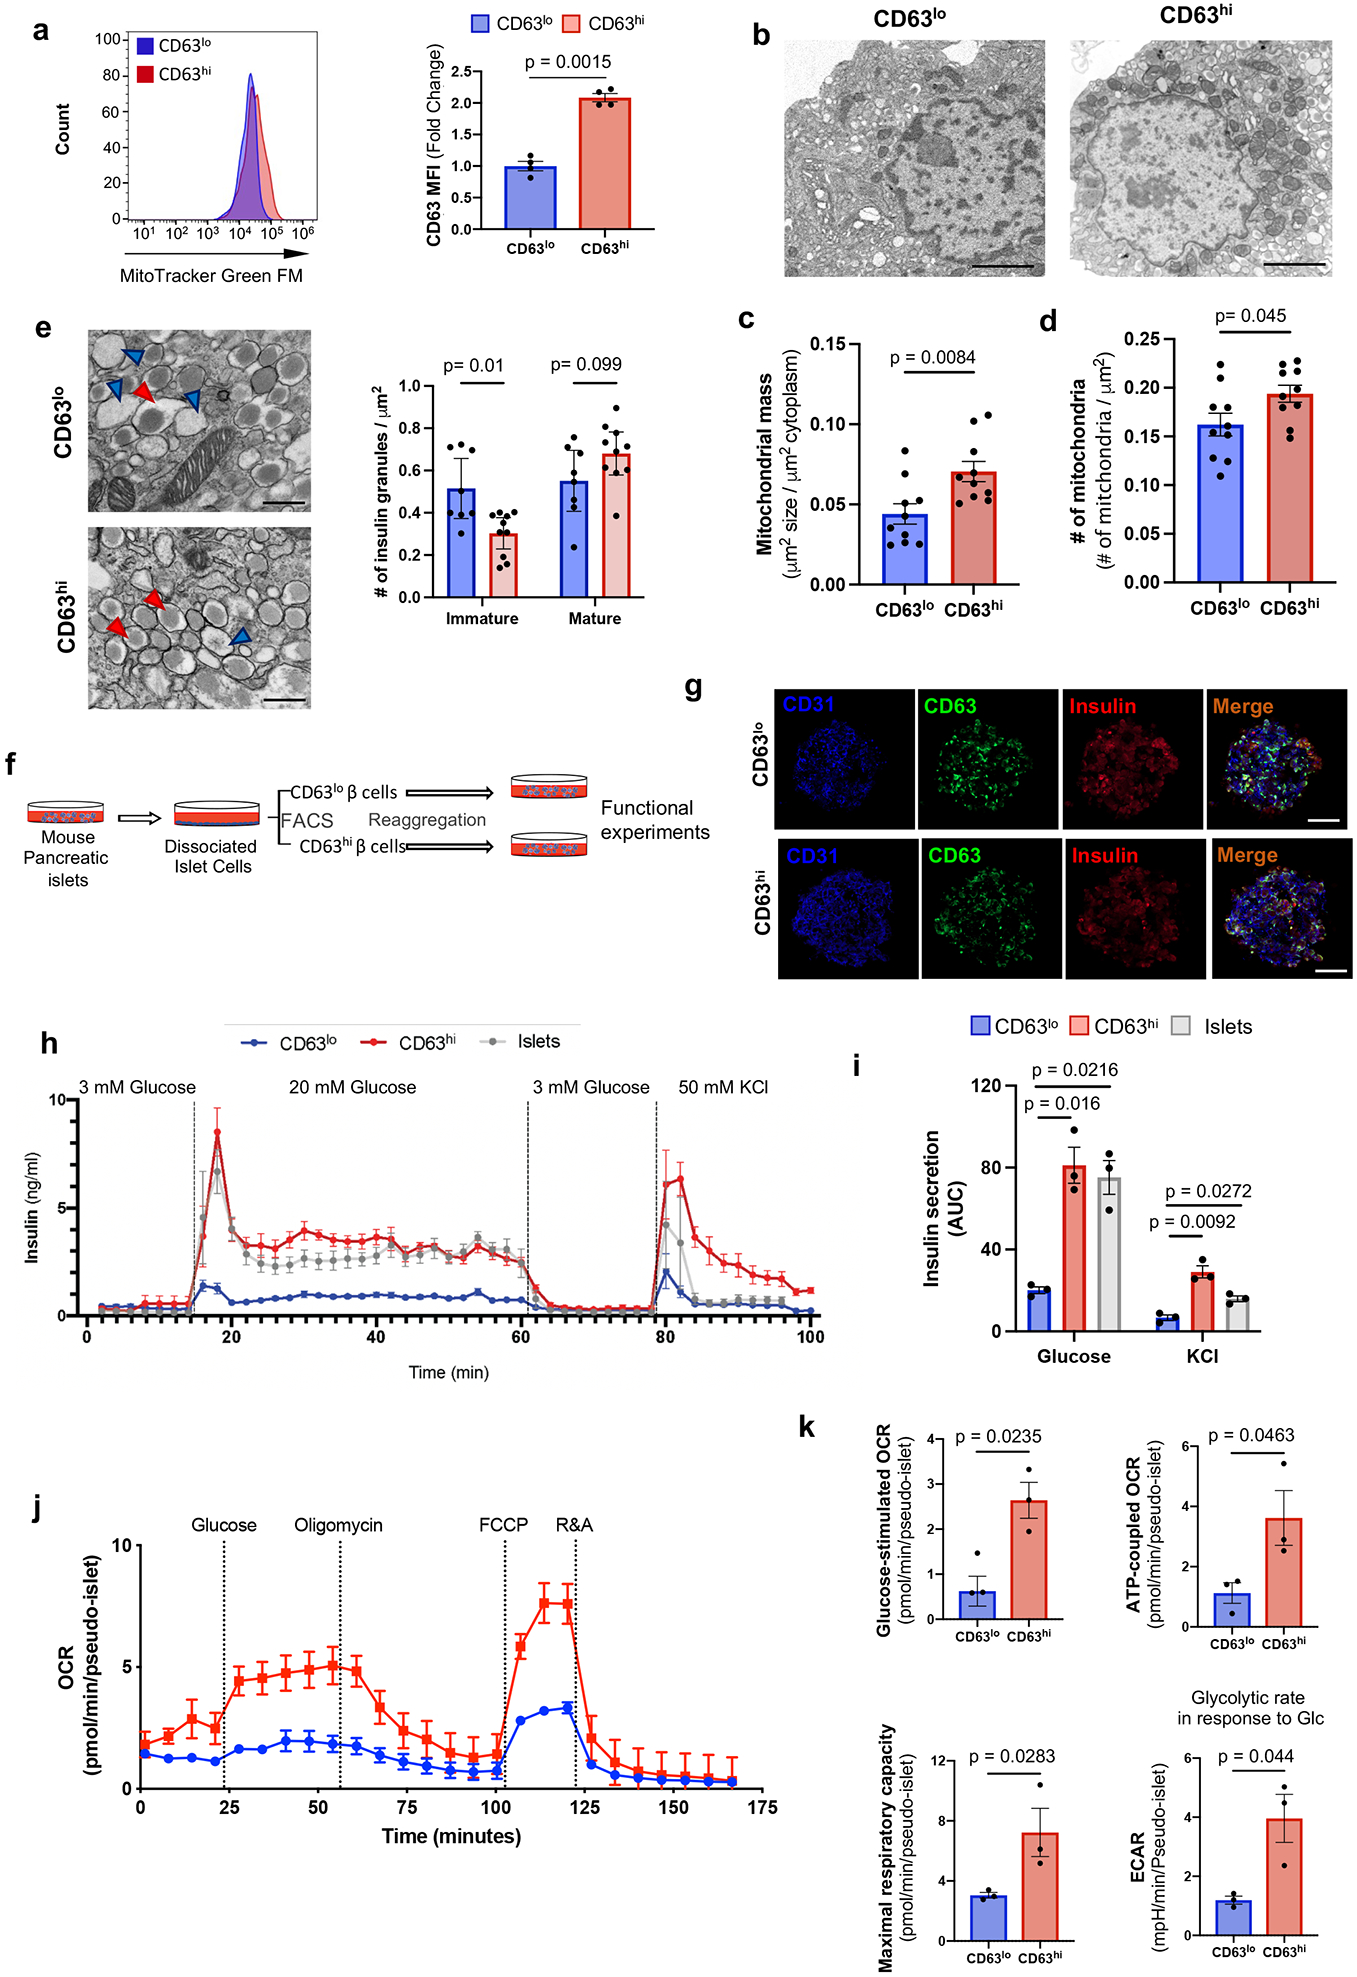
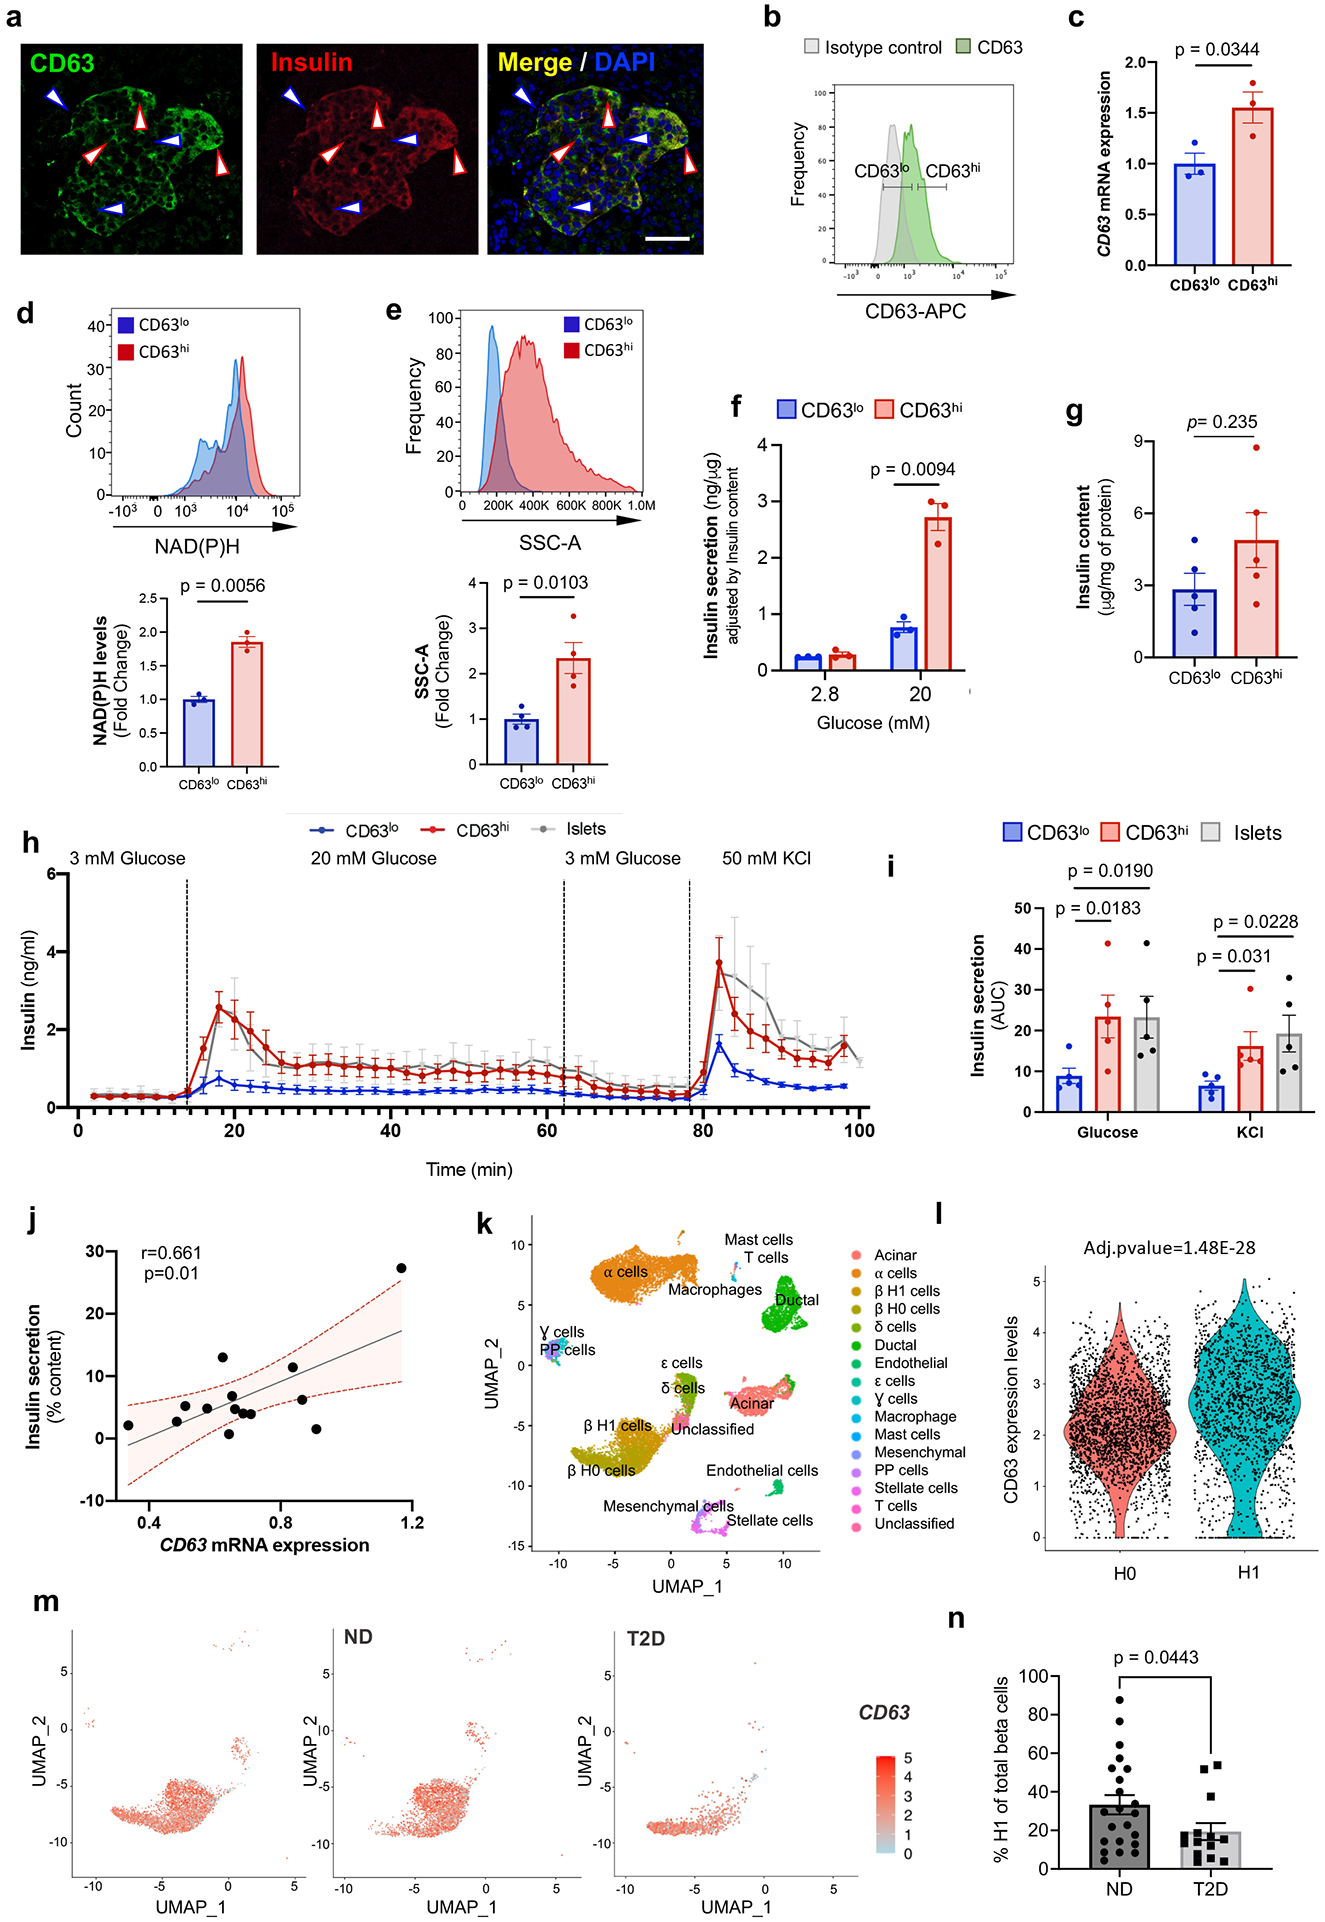
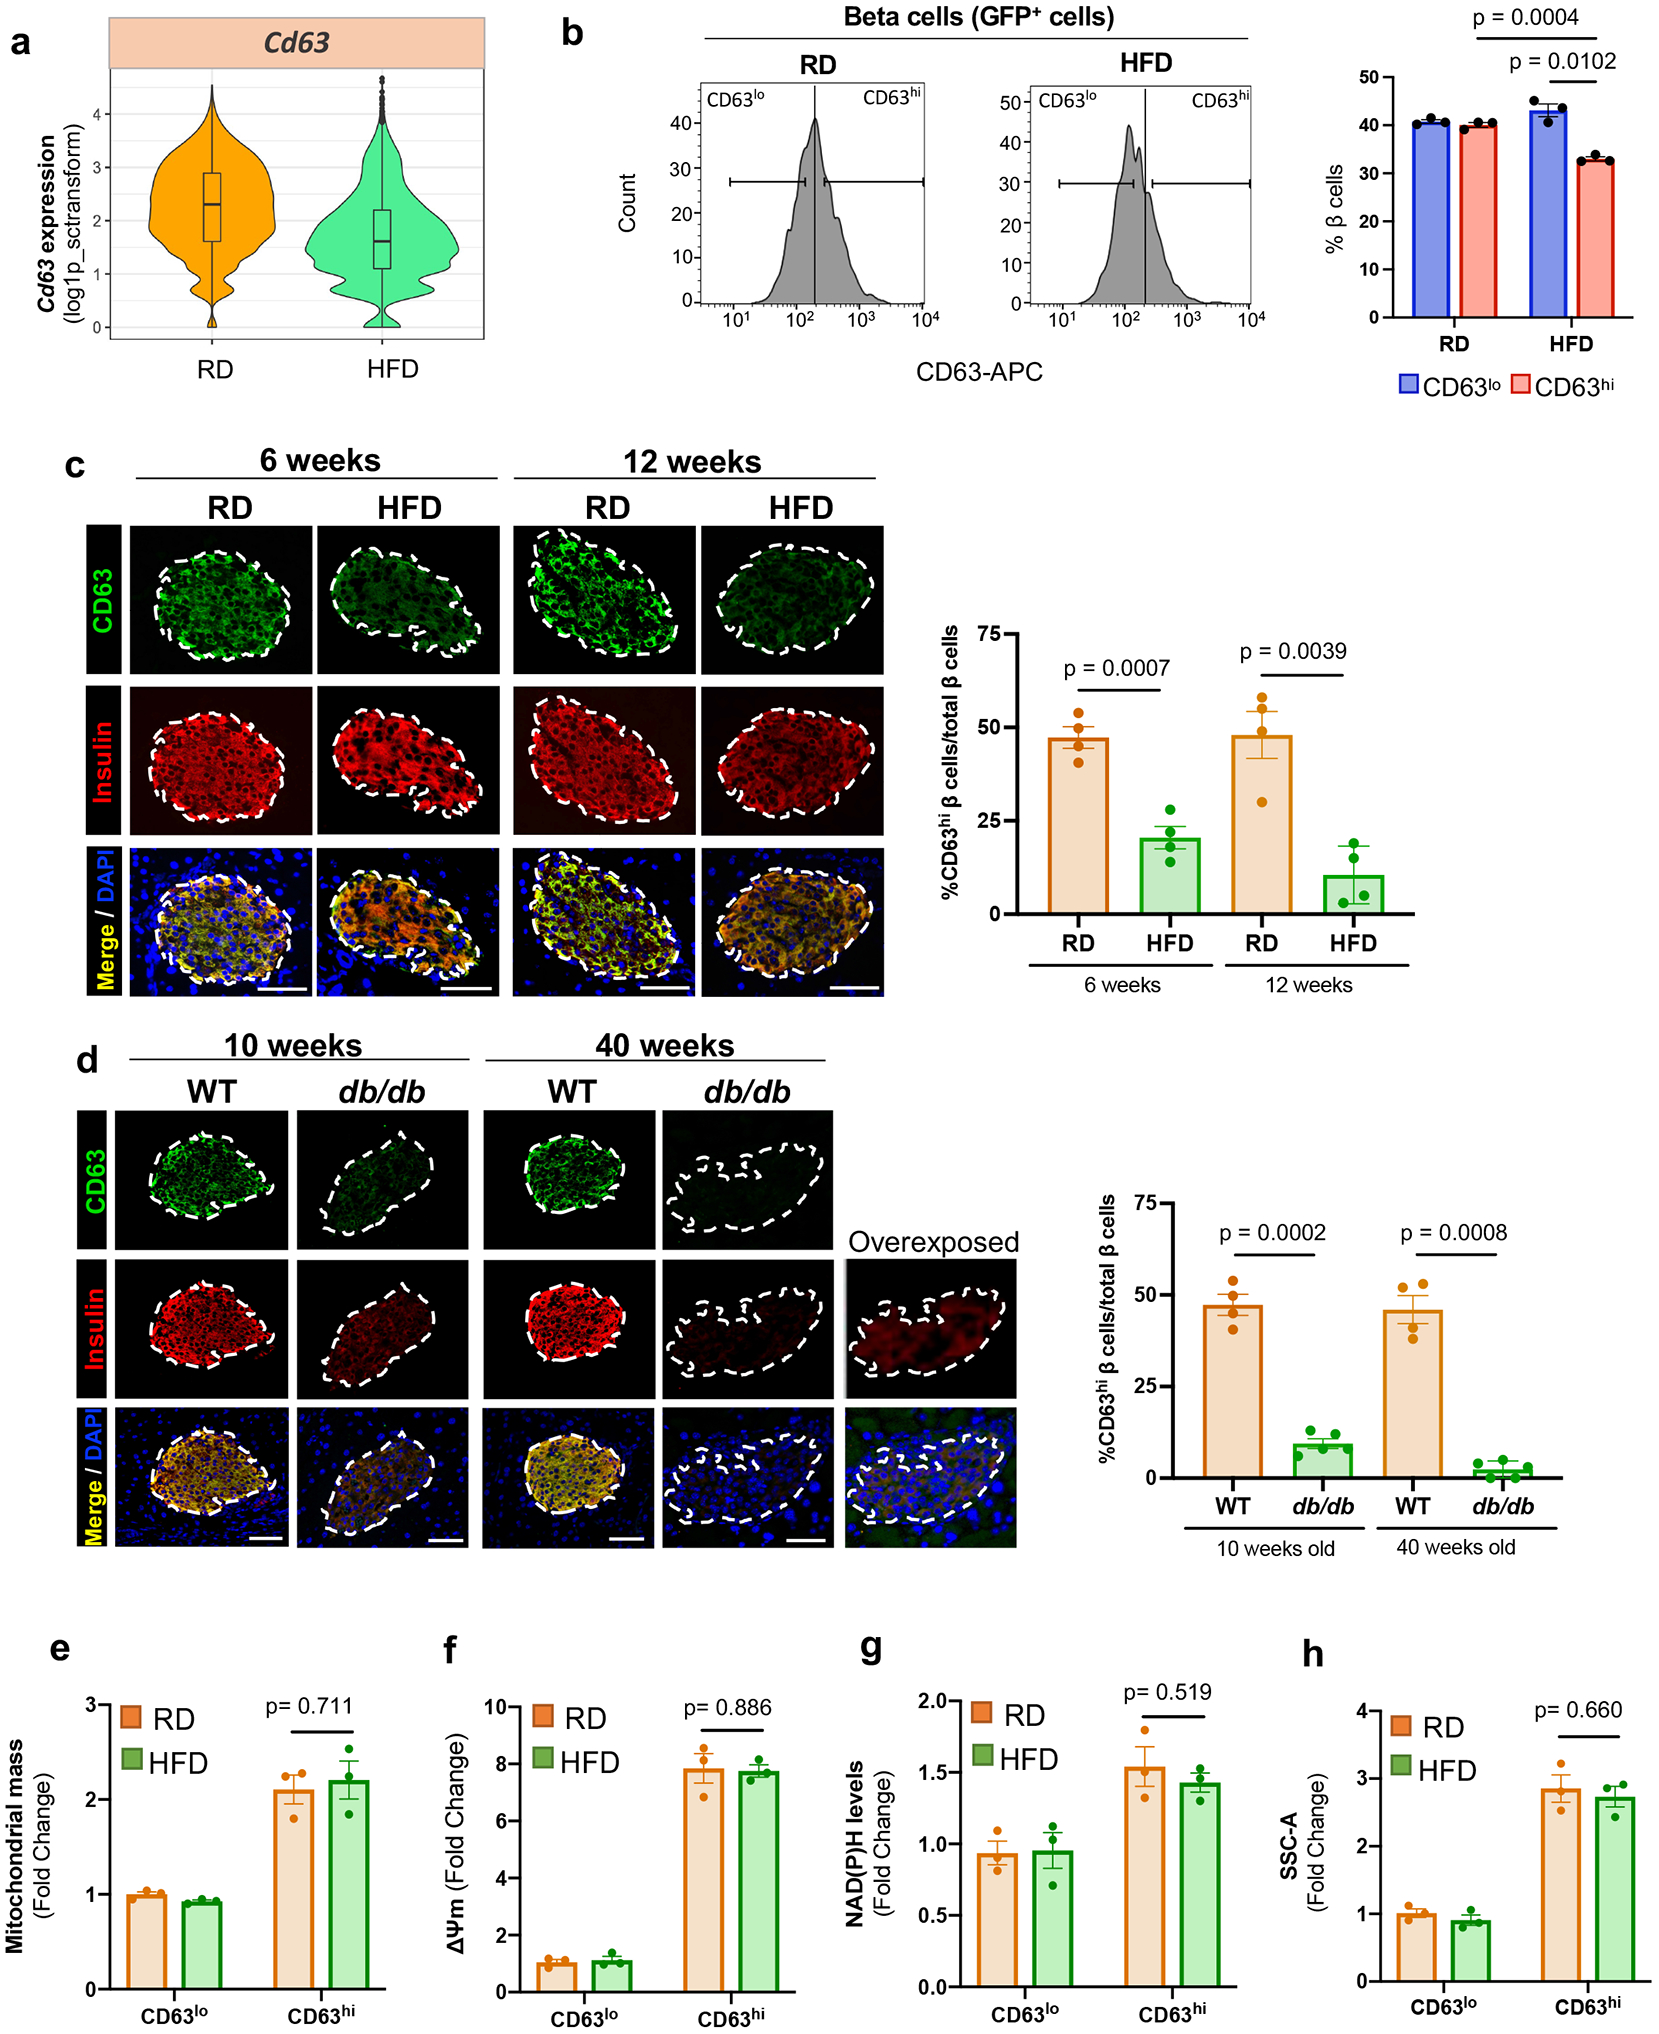
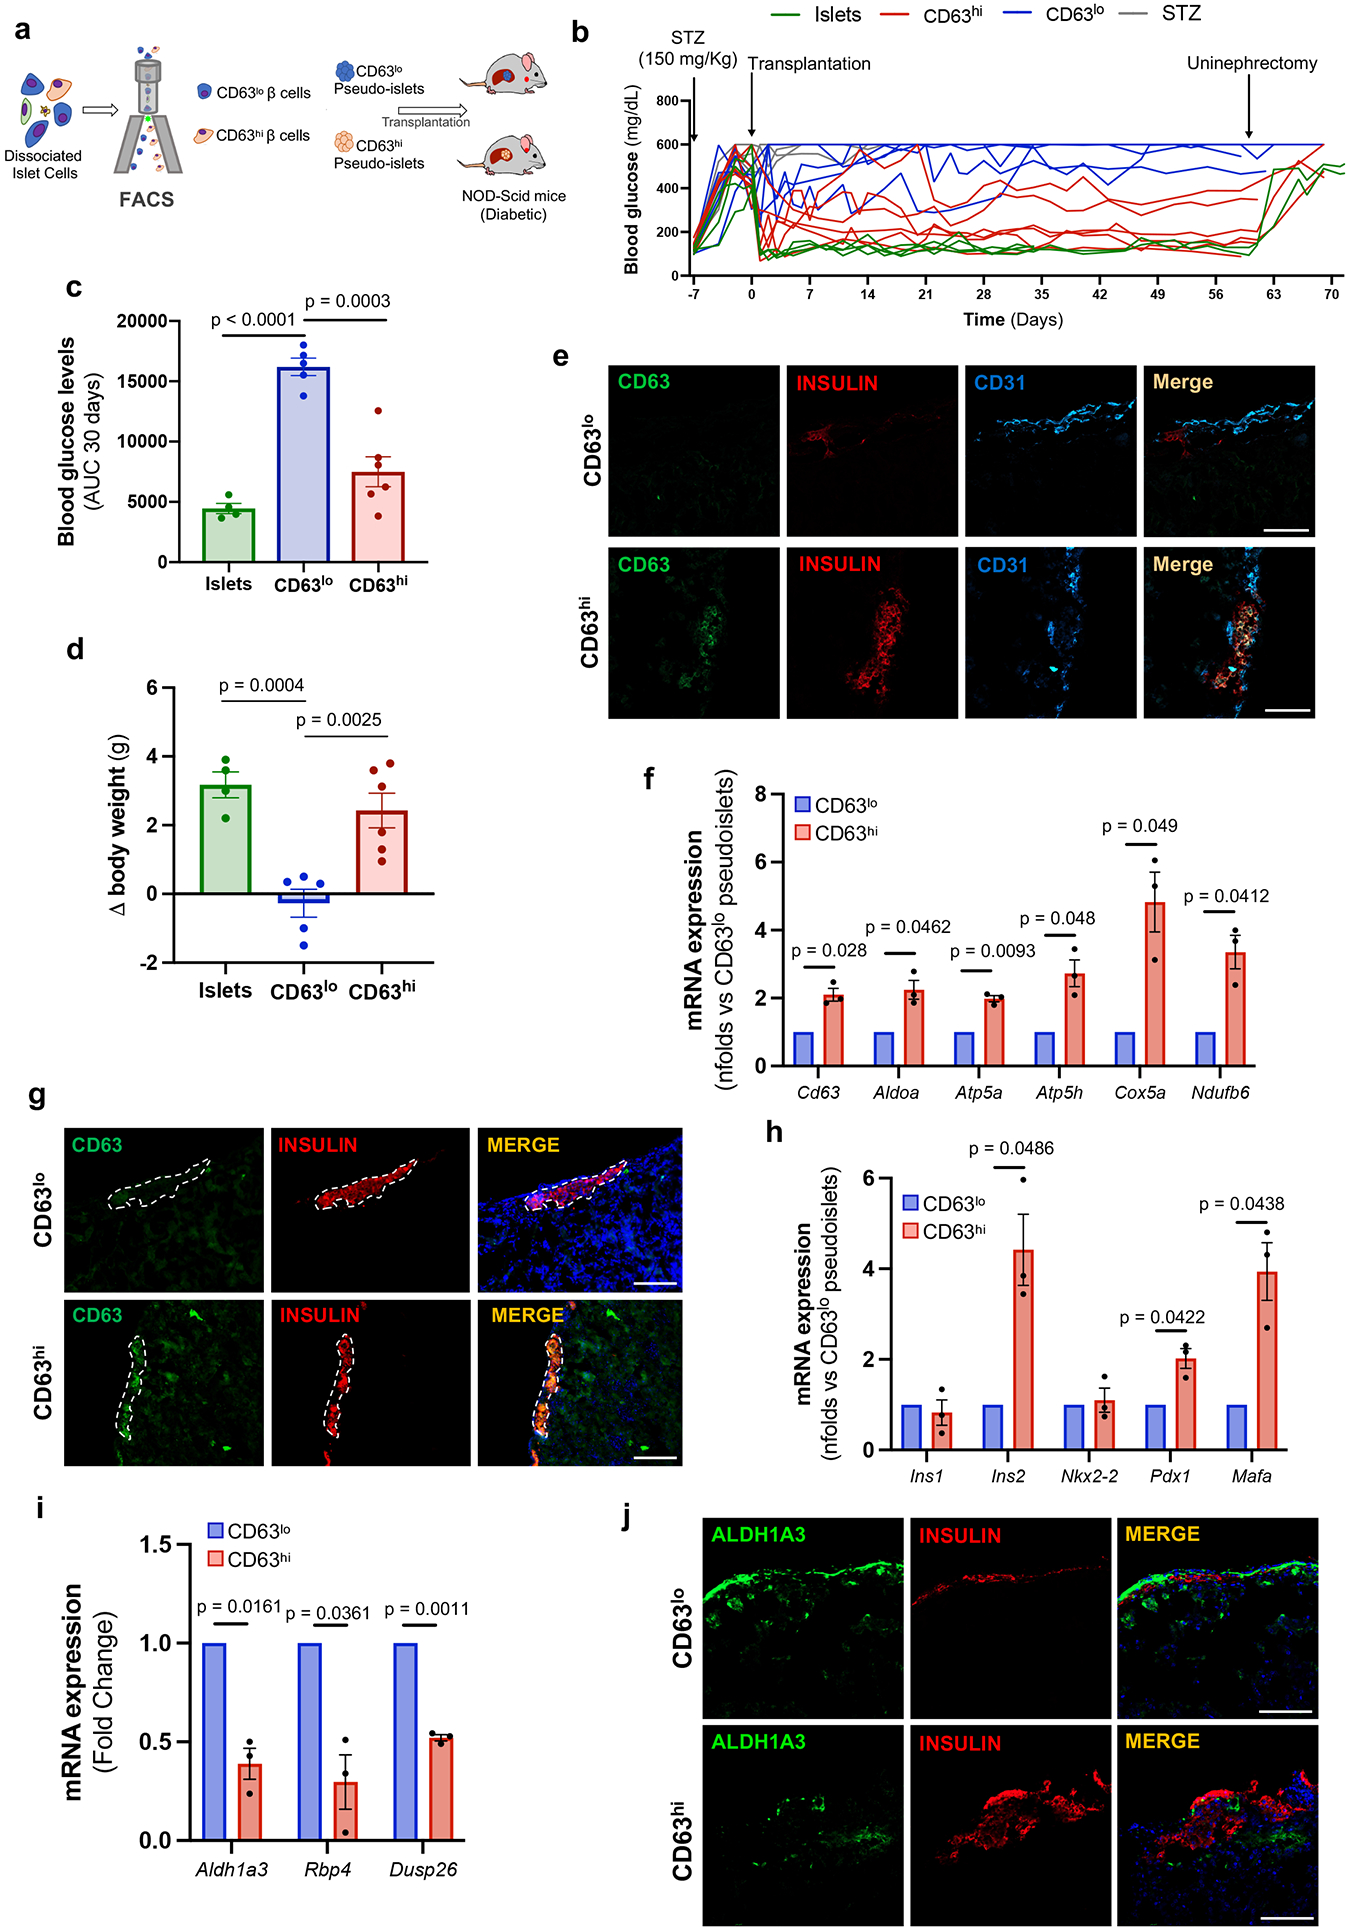
The pancreatic islets are composed of discrete hormone-producing cells that orchestrate systemic glucose homeostasis. Here we identify subsets of beta cells using a single-cell transcriptomic approach. One subset of beta cells marked by high CD63 expression is enriched for the expression of mitochondrial metabolism genes and exhibits higher mitochondrial respiration compared with CD63lo beta cells. Human and murine pseudo-islets derived from CD63hi beta cells demonstrate enhanced glucose-stimulated insulin secretion compared with pseudo-islets from CD63lo beta cells. We show that CD63hi beta cells are diminished in mouse models of and in humans with type 2 diabetes. Finally, transplantation of pseudo-islets generated from CD63hi but not CD63lo beta cells into diabetic mice restores glucose homeostasis. These findings suggest that loss of a specific subset of beta cells may lead to diabetes. Strategies to reconstitute or maintain CD63hi beta cells may represent a potential anti-diabetic therapy.


Conflict of interest statement

Declaration of Interests

No competing interests from the authors.

Figures

Extended Data Figure 1.
Extended Data Figure 1.. Characteristics of diet-induced obesity model used for scRNA-Seq.
a-b, Percentages of fat mass (a), lean mass (b) in male mice fed with regular diet (RD, N=7) or high fat diet (HFD, N=8) for 6 weeks after weaning. c-e, Body weights (c), 6 hours fasting blood glucose (d), 6 hours fasting insulin (e) levels in male mice fed with RD (N=11) or HFD (N=12) for 6 weeks after weaning. f-g, Glucose tolerance test (GTT) was performed on RD (N=7) and HFD (N=8) fed male mice for 6 weeks with measurement of blood glucose concentrations (f). Area under the curve (AUC) of blood glucose levels (g). h-k, Insulin tolerance test (ITT) was performed on RD (N=7) and HFD (N=8) fed male mice for 7 weeks (h). AUC of blood glucose levels in h (i). ITT plotted as a % of starting glucose value (j). AUC of values plotted in j after t0 (k). l, Homeostasis model assessment for insulin resistance (HOMA-IR) index of male mice fed with RD (N=11) or HFD (N=12) for 6 weeks after weaning (insulin [mU/L]* glucose [mg/dL] )/405. m-n, Quantification of β cell area (m) and mass (n) in RD (n=4) and HFD (n=5) fed male mice. o-r, Body weights (o), 6 hours fasting blood glucose (p), 6 hours fasting insulin levels (q), HOMA-IR (r) of female mice fed with regular diet (RD, N=4) or high fat diet (HFD, N=5) for 6 weeks after weaning. s-t, Quantification of β cell area (s) and mass (t) in RD (n=4) and HFD (n=5) fed female mice. u, Distribution of pancreatic islet cell clusters from RD (left chart) and HFD (right chart) fed male mice. v, UMAPs representing expression of known marker genes across the cell clusters Ins1 (beta cells), Gcg (alpha cells), Sst (delta cells), Ftl1 (endothelial cells), Ppt (gamma cells), and Cd74 (immune cells) in male mice fed with RD (left panel) and HFD (right panel). All data are presented as mean ± S.E.M. and Welch’s unpaired two-tailed t test is used for comparison. Source numerical data are available in source data.
Extended Data Figure 2.
Extended Data Figure 2.. Molecular analysis of β cell clusters.
a, Top 4 enriched biological processes for the indicated β cell clusters (p-value was calculated using two-tailed Benjamini-Hochberg). b, Heatmap showing select genes previously identified to be heterogeneously expressed in β cells in each of the indicated β cell clusters. c, Top 5 differentially expressed genes (DEGs) for the indicated β cell clusters. d, Pathway enrichment analysis of DEGs in Cluster 0, Cluster 2, and Cluster 3 β cells ordered by statistical significance (p-value was calculated using two-tailed Benjamini-Hochberg). e, Top 5 transcription factors predicted in Cluster 0, Cluster 2, and Cluster 3 β cells ordered by statistical significance (p-value was calculated using two-tailed Benjamini-Hochberg). f, Trajectory of the different β cell clusters predicted by Slingshot analysis. Source numerical data are available in source data.
Extended Data Figure 3.
Extended Data Figure 3.. CD63 expression in pancreatic islet cells.
a, Representative immunofluorescence images of CD63 (green) and insulin (red) (upper panel), and CD63 (green) and glucagon (red) (lower panel) in pancreatic islets (Scale bars, 50 μm). Data are presented as mean±S.E.M. Paired two-tailed t test is used for comparison. (N=3 independent experiments). b, Violin plots representing expression of Cd63 across different pancreatic islet cell types from mice fed with RD and HFD. Minimum to maximum values are shown by the whiskers, the bounds of boxes represent the first and third quartiles and the center line indicates the median. α cells [RD= 802 cells, HFD=430 cells]; β cells [RD=4514 cells, HFD= 3050 cells]; γ cells [RD= 182 cells, HFD= 130 cells]; δ cells [RD= 461 cells, HFD= 377 cells]; Endothelial cells [RD= 196 cells, HFD 140 cells]; Epithelial cells [RD= 60 cells, HFD=79 cells]; Immune cells [RD= 69 cells, HFD= 92 cells]. c, Representative immunofluorescence images showing CD63 (green) and insulin (red) in the different portions of the pancreas (head, body and tail) from 10-week old WT male mice (left panel) (Scale bars, 50 μm). Quantification of the percentage of β cells that are CD63hi in the different parts of the pancreas (right panel) (N = 4 mice per group). Data are presented as mean ± S.E.M. Two-way ANOVA is used for comparison of multiple groups. d, Scatterplots showing the sequential gating scheme to determine CD63 protein expression by flow cytometry in β cells from mouse insulin promoter-GFP transgenic mice. Results are representative of 3 independent experiments. e, Scatterplots showing the sequential gating protocol to isolate CD63hi and CD63lo β cells from WT mice by FACS (in total 60057 CD63hi and 60064 CD63lo β cells). Data are presented as mean ± S.E.M. Source numerical data are available in source data.
Extended Data Figure 4.
Extended Data Figure 4.. Molecular characterization of CD63hi β cells
a, Venn diagram illustrating the overlap of differentially expressed genes (DEGs) obtained by bulk RNA-Seq and genes enriched in macrophages (left panel). Scatterplot of RNA-Seq analysis from FAC-sorted CD63hi and CD63lo β cells. DEGs with a false discovery rate (FDR) < 0.05 are in green and those that are not differentially expressed are in grey (right panel). b, Heatmap of 396 DEGs from FAC-sorted CD63hi and CD63lo β cells obtained through bulk RNA-Seq. (N = 2, each replicate is pooled from 5 mice). c, Heatmap showing the enriched pathways in β cell clusters 0-3 and CD63hi and CD63lo β cells. d, Differentially expressed transcription factors (DETs) in both CD63hi and CD63lo β cells (p-value was calculated using two-tailed Benjamini-Hochberg). e, Top 20 transcription factors predicted by upstream pathway analysis in CD63hi β cells ordered by statistical significance (p-value was calculated using two-tailed Benjamini-Hochberg). f, Statistical significance of the predicted transcription factors from CD63hi β cells (e) in Cluster 1 β cells (p-value was calculated using two-tailed Benjamini-Hochberg). Source numerical data are available in source data.
Extended Data Figure 5.
Extended Data Figure 5.. CD63hi β cell maturation.
a, Volcano plot showing differentially expressed genes (DEGs) in immature and mature β cells. b, Gene expression of Cd63, Ins1, Cd81 and Rbp4 by RNA-Seq on FAC-sorted β cells during maturation. Gene structure and chromosome number are indicated for each panel. Data are publicly available at Huising Lab website https://www.huisinglab.com/). c, Volcano plot showing differentially expressed genes (DEGs) in embryonic and mature β cells. d, Gene expression of Cd63 and Ins1 by RNA-seq on FAC-sorted β cells during perinatal maturation. Gene structure and chromosome number are indicated for each panel. Data are publicly available at Huising Lab website (https://www.huisinglab.com/).
Extended Data Figure 6.
Extended Data Figure 6.. Functional analysis of CD63hi β cells.
a, Contour plots of mitochondrial membrane potential in β cells incubated with 2.8 or 20 mM glucose. Histogram and quantification of CD63 expression in β cells with low and high mitochondrial membrane potential after incubation with 20 mM glucose. Results are representative of 4 independent experiments. Data are presented as mean ± S.E.M. Paired two-tailed t test is used for comparison. b, NAD(P)H fluorescent patterns of CD63hi and CD63lo β cells after incubation with 20 mM glucose. Quantification of NAD(P)H levels after incubation with 2.8 or 20 mM glucose (N = 3 independent experiments per group). Paired two-tailed t test is used for comparison. c, Analysis and quantification of cellular granularity in CD63hi and CD63lo β cells assessed by side scatter (SSC). (N = 4 independent experiments per group). Paired two-tailed t test is used for comparison. d, Scatterplots and quantification showing the distribution of CD63hi and CD63lo β cells in the different subpopulations of mouse insulin promoter-GFP transgenic β cells (N = 3 independent experiments per group; 5 mice per experiment). Welch’s unpaired two-tailed t test is used for comparison. e, Representative immunofluorescence images of pseudo-islets from mice showing β cells (Insulin, Red) and α cells (Glucagon, Green) (Scale bars, 50 μm). N = 5 pseudo-islets per group.. f, Static glucose-stimulated insulin secretion (GSIS) assay normalized by insulin content in CD63hi and CD63lo murine pseudo-islets. Data are pooled from 4 independent experiments. Paired two-tailed t test is used for comparison. g, Insulin content of CD63hi and CD63lo murine pseudo-islets normalized by intracellular protein (N = 5 independent experiments per group). Paired two-tailed t test is used for comparison. h, Representative immunofluorescence images of murine pseudo-islets showing Insulin (Red), CD63 (Green) and GADPH (Blue) (Scale bars, 50 μm). N = 5 pseudo-islets per group. Data are presented as mean ± S.E.M. Source numerical data are available in source data.
Extended Data Figure 7.
Extended Data Figure 7.. Insulin secretion of CD63hi and CD63lo β cells in response to GLP-1 agonist.
a, Flow cytometry analysis for annexin V and 7-AAD in isolated CD63hi and CD63lo β cells from WT mice. Data are representative of 3 independent experiments (cells pooled from at least 5 mice per experiment). b, Static glucose-stimulated insulin secretion (GSIS) assay in the absence or presence of 100 μM 3-isobutyl-1-methylxanthine (IBMX). Results are normalized by insulin content in CD63hi and CD63lo murine pseudo-islets (N = 3 per group). Welch’s unpaired two-tailed t test is used for comparison. c, Venn diagram illustrating the overlap of differentially expressed genes (FDR<0.01) between Cluster 0 β cells obtained by scRNA-seq and sorted CD63lo β cells determined through bulk RNA-Seq. Biological process enrichment analysis of differentially expressed genes in both Cluster 0 and CD63lo β cells. d, Glp1r mRNA expression in sorted CD63hi and CD63lo mouse β cells determined by bulk RNA-Seq. Comparisons were performed by Wald test. Benjamini–Hochberg corrected two-tiled p-value. e, Static GSIS assay in the absence or presence of 5 nM Exendin-4 (Ex4). Results are normalized by insulin content in CD63hi and CD63lo murine pseudo-islets (N = 4 replicates per group). Results are representative of 3 independent experiments. Data are presented as mean ± S.E.M. Paired two-tailed t test is used for comparison. Source numerical data are available in source data.
Extended Data Figure 8.
Extended Data Figure 8.. Molecular analysis of human CD63hi β cells.
a, Quantification of the percentage of human β cells that are CD63hi (Fig. 3a). N = 3 non-diabetic human donors. Data are presented as mean ± S.E.M. b, UMAP showing the clustering of cells by constructing a Shared Nearest Neighbor (SNN) graph with resolution of 0.5 integrating cells from non-diabetic (ND) and donors with type 2 diabetes (T2D). c, UMAP indicating cells from ND and T2D donors in Extended Data Fig. 8a. d, Violin plots showing CD63 expression in H0 and H1 β cell subclusters in ND and T2D. e, Box plots showing the pseudo bulked median expression levels of CD63 in H0 and H1 β cell subclusters from ND (N=22) and T2D (N=14) donors. Each dot represents the median expression of one donor. Boxes represent the first and third quartiles, center line denotes the median and whiskers showed the maximum and minimum value. f, CD63 mRNA expression in whole islets from male (N=10) and female (N=8) ND donors determined by RT-qPCR. g-h, Frequency of Cluster H1 cells (g) and body mass index (BMI) (h) in T2D donors by sex. Donors with at least 13 β cells are included in the analysis. Male (N=6), Female (N=8). i, Pathway enrichment analysis of differentially expressed genes (DEGs) in human Cluster H1 β cells. j, Venn diagram illustrating the overlap of DEGs (FDR<0.01) among Cluster 0 and 1 mouse β cells obtained by scRNA-Seq and human H1 subcluster. Pathway enrichment analysis of DEGs by scRNA-Seq in Cluster 1 mouse and human H1 β cells. k, Volcano plot showing DEGs in H1 β cells between T2D and ND donors. l, Pathway enrichment analysis of DEGs in H1 β cells from T2D donors. m, Pathway enrichment analysis of DEGs in H1 β cells from ND donors. Data are presented as mean ± S.E.M. and Welch’s unpaired two-tailed t test is used for comparison (f, g, and h), and p-values were calculated using two-tailed Benjamini-Hochberg in I, j, l and m. Source numerical data are available in source data.
Extended Data Figure 9.
Extended Data Figure 9.. Effects of obesity on functional and transcriptional profiles of β cells.
a, Representative flow cytometry plot for CD63 and CD81 staining on β cells from regular diet (RD) and high fat diet (HFD) fed male mice. b, Percentage of CD63hi and CD81+ β cells from RD and 6-weeks HFD-fed male mice. N = 5 mice per group. c, Percentage of CD63hi β cells from RD and 6-weeks HFD-fed female mice using flow cytometry. N = 4 mice per group. d, Representative immunofluorescence images showing CD63 (green) and insulin (red) in pancreas from WT female mice fed with RD or HFD for 6 weeks. (Scale bars, 50 μm). e, Quantification of the percentage of β cells that are CD63hi in female mice fed RD or HFD for 67 weeks (N = 4 mice per group). f, Plot showing differentially expressed genes (DEG) between β cells from RD and HFD-fed male mice. g, Violin plots representing expression of Cd63 across different β cell clusters from male mice fed with HFD. Whiskers show the minimum to maximum values, bounds of boxes represent first and third quartiles and the center line indicates the median. Cluster 0 (N= 1281 cells), Cluster 1 (N= 758), Cluster 2 (N= 767), Cluster 3 (N= 244 cells). h-k, Volcano plot showing DEGs between RD- and HFD-fed mice and pathways enriched in Cluster 0 (h), Cluster 1 (i), Cluster 2 (j) and Cluster 3 (k) β cells. l, Venn diagram illustrating the overlap of DEGs (FDR<0.01) between the bulk β cell population (all β cells from this scRNA-Seq study) from mice fed with HFD and β cell population from mice fed with HFD determined through bulk RNA-Seq. Pathway analysis of shared DEGs. m, Glucose stimulated insulin secretion assay from pseudo-islets derived from CD63hi and CD63lo β cells from RD and HFD-fed mice. CD63lo (RD [N = 8 Samples]; HFD [N = 8 Samples) and CD63hi β cells (RD [N=9 Samples]; HFD (N= 8 Samples). Data are presented as mean ± S.E.M. and P values were determined by Welch’s unpaired two-tailed t test (b, c, e, and m). Source numerical data are available in source data.
Figure 1.
Figure 1.. scRNA-seq analysis reveals changes in β cell heterogeneity promoted by diet-induced obesity.
a, Schematic representation of the workflow used for single cell RNA-sequencing (scRNA-Seq) of pancreatic islet cells. b, Unsupervised clustering of single cell transcriptome visualized with uniform manifold approximation and projection (UMAP) analysis. Data represent pancreatic islet cells (N=10,582) from mice fed with Regular Diet (RD, N=6,284 cells pooled from 4 mice) or High Fat Diet (HFD, N=4,298 cells pooled from 5 mice) for 6 weeks after weaning. Annotated cell types are assigned based on known marker gene expression. c, Projection of β cells (N=7,564) from both RD and 6-weeks HFD-fed mice using UMAP analysis. β cell groups are defined according to kNN-based clusters. d, Distribution of β cell clusters in RD- and HFD-fed mice. e, Pathway enrichment analysis of differentially expressed genes in Cluster 1 β cells (p-value was calculated using two-tailed Benjamini-Hochberg). f, Violin plots representing the expression levels (log2(TPM+1)) of genes involved in glycolysis (Aldoa and Gapdh) and electron transport chain (Atp5g1 and Ndufc2) in each β cell cluster. g, Top 5 most statistically significant predicted transcription factors in Cluster 1 β cells (p-value was calculated using two-tailed Benjamini-Hochberg). Source numerical data are available in source data.
Figure 2.
Figure 2.. Identification of a metabolically active β cell cluster.
a, Violin plots showing Cd63 expression across β cell clusters in Regular Diet (RD) fed mice. Minimum to maximum values are shown by the whiskers, the bounds of boxes represent the first and third quartiles and the center line indicates the median. b, CD63 protein expression in β cells determined by immunofluorescence staining for CD63 (green), Insulin (red), and DAPI (blue) from RD-fed mice (10-weeks old) (Scale bar, 50 μm) (Magnified insets shown below. Scale bar, 5 μm). This is representative of more than 20 fields (N = 10 mice). Blue arrows mark CD63lo β cells and red arrows mark CD63hi β cells. c, Schematic for the FACS analysis to isolate CD63hi and CD63lo β cells from mouse pancreatic islets. d, Histogram of CD63 expression in β cells from mouse β cells. e, Cd63 mRNA expression in sorted CD63hi and CD63lo β cells determined by RT-qPCR (N=4 independent experiments per group). Data are presented as mean± S.E.M. Paired two-tailed t test is used for comparison. ***p < 0.001. f, Heatmap of glycolysis, TCA cycle, and mitochondrial genes from FAC-sorted CD63hi and CD63lo β cells obtained through bulk RNA-Seq (N=2 per group). The significance of DEGs between pairwise comparisons were identified by Wald test using DESeq2 v1.26.0. Benjamini–Hochberg corrected two-tiled p-values<0.05 were considered statistically significant g, PCA scatter plot comparing the transcriptomes of FAC-sorted CD63hi and CD63lo β cells obtained through bulk RNA-Seq to scRNA-Seq analyses of CD63hi, CD63med, and CD63lo β cells. (N=2, each replicate is pooled from 5 mice).. h, PCA scatter plot comparing the transcriptomes of FAC-sorted CD63hi and CD63lo β cells obtained through bulk RNA-Seq to β cell Clusters 0, 1, 2 and 3 obtained by scRNA-Seq. i, Pathway enrichment analysis of differentially expressed genes in CD63hi and CD63lo β cells ordered by statistical significance (p-value was calculated using two-tailed Benjamini-Hochberg). Source numerical data are available in source data.
Figure 3.
Figure 3.. Functional characterization of a metabolically active β cell cluster
a, Mitochondrial mass in CD63hi and CD63lo β cells assessed by Mitotracker green (MTG). Results are representative of 4 independent experiments. Data are presented as mean±S.E.M. Paired two-tailed t test is used for comparison. b-d, Transmission electron microscopy (TEM) of FAC-sorted CD63hi and CD63lo β cells (Scale bars, 2 μm) (b). Mitochondrial mass (c) and numbers (d) were counted in a blinded manner from 10 fields per group with about 3 cells per field. Welch’s unpaired two-tailed t test is used for comparison. e, Representative TEM images of FAC-sorted CD63hi and CD63lo β cells from mice fed with RD. Blue arrows point to immature secretory granules. Red arrows indicate mature insulin secretory granules. Magnification 30,000x (Scale bars, 500 nm). Quantification of insulin granules normalized by area (right panel). Welch’s unpaired two-tailed t test is used for comparison. Results of granules from CD63lo β cells (8 fields) and CD63hi (10 fields) were pooled from 5mice. f, Schematic illustration of strategy to assemble pseudo-islets from FAC-sorted CD63hi and CD63lo β cells prior to functional assays. g, Representative immunofluorescence images of pseudo-islets showing Insulin (Red), CD63 (Green) and CD31 (Blue) (Scale bars, 50 μm). N=5 pseudo-islets per group. h, Dynamic glucose-stimulated insulin secretion assay of perifused CD63hi and CD63lo pseudo-islets, and whole islets (20 pseudo-islets or whole islets per replicate). Results are representative of 3 independent experiments with 3 replicates. i, Area under the curve (AUC) for insulin secretion in response to glucose and KCl from 3 different perifusion experiments. Data are presented as mean±S.E.M. Paired two-tailed t test is used for comparison. j, Oxygen consumption rates (OCR) of CD63hi and CD63lo pseudo-islets normalized to the number of pseudo-islets per well (20 pseudo-islets). Results are representative of 3 independent experiments. k, Quantification of glucose-stimulated OCR, ATP-coupled OCR, maximal respiratory capacity, and glycolytic rate in response to 20 mM glucose (at least 4 replicates in 3 independent experiments). Data are presented as mean±S.E.M. Unpaired two-tailed t test is used for comparison. Source numerical data are available in source data.
Figure 4.
Figure 4.. CD63 marks human beta cells with enhanced insulin secretion.
a, Immunofluorescence for CD63 (green), Insulin (red), and DAPI (blue) in human β cells (Scale bar, 50 μm). Blue arrows (CD63lo β cells). Red (CD63hi β cells). Representative of more than 10 fields. b, Flow cytometry analysis of CD63 in human β cells. Representative of 5 independent experiments. c, CD63 expression in sorted human CD63hi and CD63lo β cells determined by RT-qPCR (N=3 independent experiments) d, NAD(P)H levels in human CD63hi and CD63lo β cells. (N=3 independent experiments). e, Analysis of cellular granularity in human CD63hi and CD63lo β cells assessed by side scatter (SSC) (N=4 independent experiments). f, Static glucose-stimulated insulin secretion (GSIS) assay in CD63hi and CD63lo human pseudo-islets at 2.8 or 20 mM glucose (N=3 independent experiments). g, Insulin content of CD63hi and CD63lo human pseudo-islets normalized by intracellular protein (N=5 samples per group). h, Dynamic GSIS in CD63hi and CD63lo human pseudo-islets subjected to indicated concentrations of glucose and KCl (20 pseudo-islets or whole islets per replicate. i, Area under the curve (AUC) for insulin secretion in response to 20mM glucose and 50mM KCl shown in h (N = 5 independent experiments [5 donors]). j, Correlation between human islet CD63 expression and insulin secretion to 16.7mM glucose (N=14 donors). Linear regression with Pearson correlation coefficient analysis (bars indicate the 95% confidence intervals). k, UMAP projection of human pancreatic cells from integrated analysis of five human pancreatic islet scRNA-Seq studies across non-diabetic (ND, N=29) and type 2 diabetes (T2D, N=15) donors. l, Violin plots for CD63 in H0 and H1 β cell subclusters. m, CD63 expression in β cells in ND and T2D donors using UMAP analysis. All β cells on left panel. n, Frequency of Cluster H1 cells in ND (N=22) and T2D (N=14) donors with at least 13 β cells. Data are presented as mean±S.E.M and paired two-tailed t test is used for comparison in c, d, e, f, g, and i. Welch’s unpaired two-tailed t test is used for comparison in m. Source numerical data are available in source data.
Figure 5.
Figure 5.. CD63 expression on beta cells in mouse models of T2D.
a, Violin plots showing Cd63 expression in β cells from regular diet (RD) and high fat diet (HFD) fed mice (scRNA-Seq data). Minimum to maximum values are shown by the whiskers, the bounds of boxes represent the first and third quartiles and the center line indicates the median. RD=4514 cells; HFD=3050 cells. b, Percentage of CD63hi and CD63lo β cells in MIP-GFP mice fed RD or HFD for 6 weeks assessed by flow cytometry (N=3 independent experiments). c, Representative immunofluorescence images showing CD63 (green) and insulin (red) in pancreas sections from WT mice fed with RD or HFD (6 and 12 weeks) (left panel) (Scale bars, 50 μm). Quantification of the percentage of β cells that are CD63hi (right panel) (N=4 mice per group) d, Representative immunofluorescence showing CD63 (green) and insulin (red) in pancreas sections from WT and db/db mice (10 and 40 weeks old) (left panel) (Scale bars, 50 μm). Quantification of the percentage of β cells that are CD63hi (right panel). WT (N=4 mice per group) and db/db (N=5 mice per group) mice (10 and 40 weeks old) . e, Mitochondrial mass in CD63hi and CD63lo β cells from RD and HFD-fed mice assessed by Mitotracker green (MTG). Results are representative of 3 independent experiments (5 mice per experiment). f, Mitochondrial membrane potential in CD63hi and CD63lo β cells from RD and HFD-fed mice previously incubated with 20 mM glucose. Results are representative of 3 independent experiments (5 mice per experiment). g, NAD(P)H fluorescence patterns of CD63hi and CD63lo β cells from RD and HFD-fed mice after incubation with 20 mM glucose. Results are representative of 3 independent experiments (5 mice per experiment). h, Analysis and quantification of cellular granularity in CD63hi and CD63lo β cells from RD and HFD-fed mice assessed by side scatter (SSC). Results are representative of 3 independent experiments (5 mice per experiment). Data are presented as mean ± S.E.M and Welch’s unpaired two-tailed t test is used for comparison unless otherwise stated. Source numerical data are available in source data.
Figure 6.
Figure 6.. CD63hi beta cells restores euglycemia to diabetic mice.
a, Schematic illustration of CD63hi and CD63lo pseudo-islet transplantation into diabetic NOD-SCID mice previously treated with streptozotocin (STZ). b, Random-fed blood glucose levels in mice transplanted with 150 whole islets (N=4; 2 were followed for 30 days), CD63lo pseudo-islets (N=5), or CD63hi pseudo-islets (N=6). Untransplanted STZ mice remained hyperglycemic (N=3). c, Area under the curve (AUC) of blood glucose levels for 30 days after transplantation until uninephrectomy. Whole islets (N=4), CD63lo pseudo-islets (N=5), or CD63hi pseudo-islets (N=6). Welch’s unpaired two-tailed t test is used for comparison. d, Change in body weight 30 days after transplantation in diabetic NOD-SCID transplanted with 150 whole islets (N=4), CD63lo pseudo-islets (N=5), or CD63hi pseudo-islets (N=6). Data are presented as mean±S.E.M. Welch’s unpaired two-tailed t test is used for comparison. e, Representative immunofluorescence images showing CD63 (green) and insulin (red) and CD31 (blue) in grafted kidney sections from NOD-SCID mice 60 days post-transplantation (N=3 per group) (Scale bars, 100 μm). f, mRNA expression of Cd63 and indicated metabolic genes in CD63hi and CD63lo pseudo-islets 60 days after transplantation determined by RT-qPCR. Paired two-tailed t test is used for comparison (N=3 per group). g, Representative immunofluorescence images of CD63 (green) and insulin (red) in grafted kidney sections 60 days post-transplantation (Scale bars, 100 μm) (N=3 independent experiments). h, mRNA expression ofβ cell signature genes in CD63hi and CD63lo pseudo-islets 60 days after transplantation determined by RT-qPCR. Paired two-tailed t test is used for comparison (N=3 per group). i, mRNA expression of indicated genes in grafted CD63hi and CD63lo pseudo-islets determined by RT-qPCR. Paired two-tailed t test is used for comparison (N=3 per group). j, Representative immunofluorescence images of Aldh1a3 (green) and insulin (red) in grafted kidney sections 60 days post-transplantation (Scale bars, 100 μm). Paired two-tailed t test is used for comparison (N=3 per group). Data are presented as mean±S.E.M. Source numerical data are available in source data.

References

    1. Festa A, Williams K, D'Agostino R Jr., Wagenknecht LE & Haffner SM The natural course of beta-cell function in nondiabetic and diabetic individuals: the Insulin Resistance Atherosclerosis Study. Diabetes 55, 1114–1120 (2006). - PubMed
    1. Ahlqvist E et al. Novel subgroups of adult-onset diabetes and their association with outcomes: a data-driven cluster analysis of six variables. Lancet Diabetes Endocrinol 6, 361–369 (2018). - PubMed
    1. Gomez-Banoy N et al. Adipsin preserves beta cells in diabetic mice and associates with protection from type 2 diabetes in humans. Nat Med 25, 1739–1747 (2019). - PMC - PubMed
    1. Tabak AG et al. Trajectories of glycaemia, insulin sensitivity, and insulin secretion before diagnosis of type 2 diabetes: an analysis from the Whitehall II study. Lancet 373, 2215–2221 (2009). - PMC - PubMed
    1. Wagner R et al. Pathophysiology-based subphenotyping of individuals at elevated risk for type 2 diabetes. Nat Med 27, 49–57 (2021). - PubMed

Publication types