Review
. 2023 Oct;24(5):809-823.
doi: 10.1007/s11154-023-09796-3. Epub 2023 Mar 17.

Relevance of body composition in phenotyping the obesities

Affiliations
Review

Relevance of body composition in phenotyping the obesities

Laura Salmón-Gómez et al. Rev Endocr Metab Disord. 2023 Oct.

Abstract

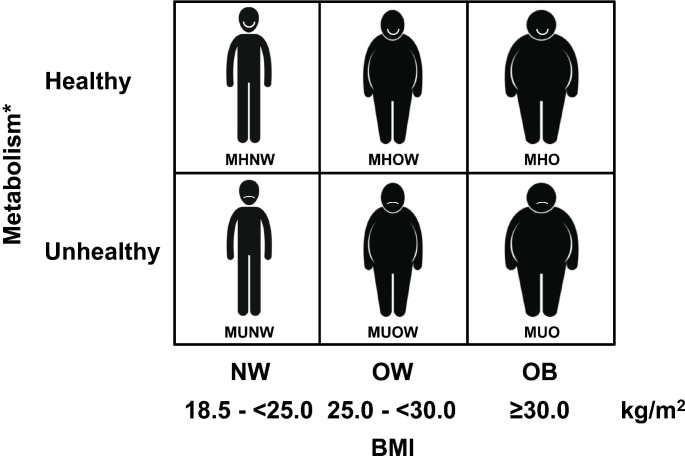
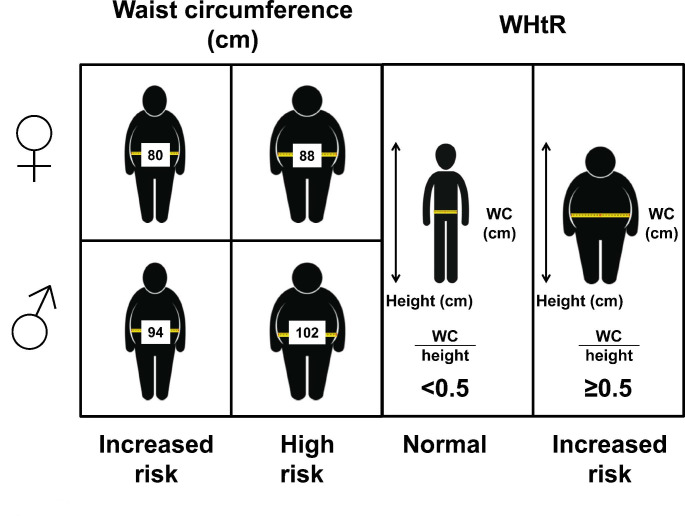
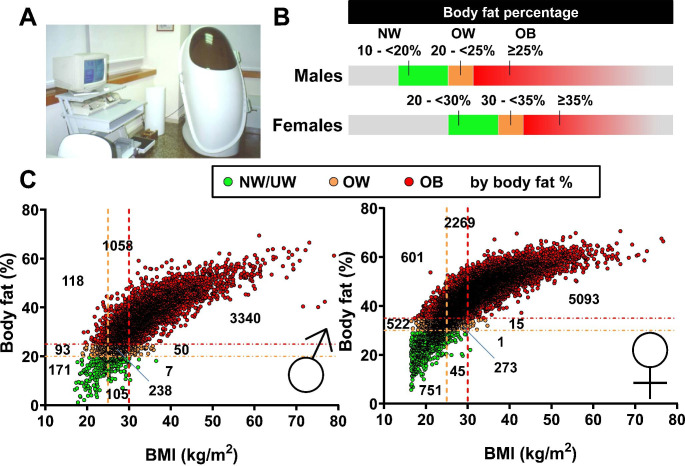
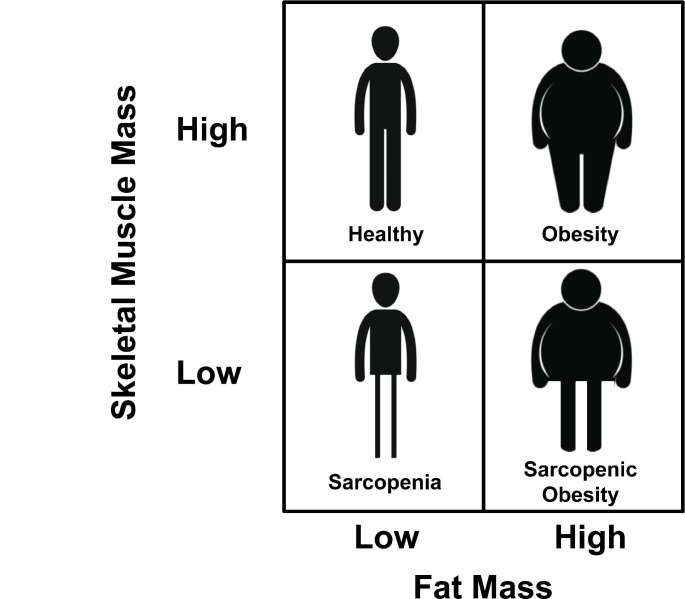
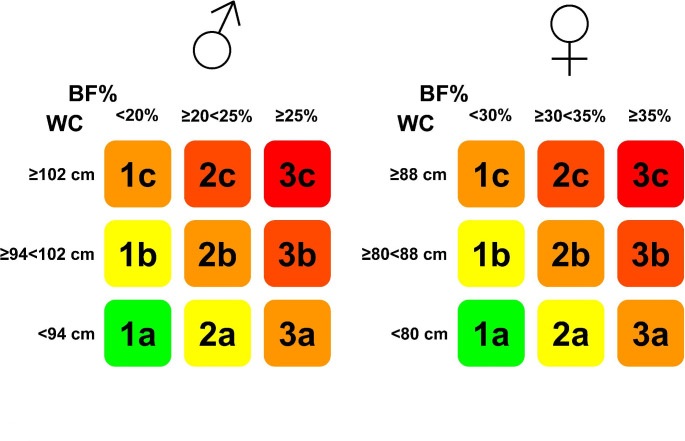
Obesity is the most extended metabolic alteration worldwide increasing the risk for the development of cardiometabolic alterations such as type 2 diabetes, hypertension, and dyslipidemia. Body mass index (BMI) remains the most frequently used tool for classifying patients with obesity, but it does not accurately reflect body adiposity. In this document we review classical and new classification systems for phenotyping the obesities. Greater accuracy of and accessibility to body composition techniques at the same time as increased knowledge and use of cardiometabolic risk factors is leading to a more refined phenotyping of patients with obesity. It is time to incorporate these advances into routine clinical practice to better diagnose overweight and obesity, and to optimize the treatment of patients living with obesity.

Keywords: BMI; Body composition; Body fat percentage; Cardiometabolic risk; Metabolic health; Obesity; Phenotyping; Visceral adipose tissue; Waist circumference.


Conflict of interest statement

No potential conflicts of interest were disclosed.

Figures

Fig. 1
Fig. 1
Phenotyping system according to body mass index (BMI) and metabolic health. MHNW, metabolically healthy normal weight (NW); MHOW, metabolically healthy overweight (OW); MHO, metabolically healthy obesity; MUNW, metabolically unhealthy NW; MUOW, metabolically unhealthy OW; MUO, metabolically unhealthy obesity. NW: BMI 18.5 - <25.0 kg/m2; OW: BMI 25.0 - <30.0 kg/m2; obesity (OB): BMI ≥ 30.0 kg/m2. *The criteria for defining healthy vs. unhealthy metabolism are commented in the text
Fig. 2
Fig. 2
Threshold values to estimate cardiometabolic risk according to waist circumference for females and males (left) and waist-to-height ratio (WHtR, right)
Fig. 3
Fig. 3
Body mass index (BMI) misclassifies a high number of patients with overweight or obesity defined by body fat percentage (BF%). (A) Air displacement plethysmography equipment used to estimate BF% in people with a BMI ≥ 16.5 kg/m2 attending the Department of Endocrinology and Nutrition at the Clínica Universidad de Navarra in Pamplona, Spain. (B) Cut-off points used to define overweight and obesity according to BF% in men and women. (C) Correlation between BMI and BF% of a sample of 14,750 individuals stratified by gender. Left: Men (n = 5,180). Right: Women (n = 9,570). Vertical dashed lines indicate cut-offs for defining overweight (OW) and obesity (OB) according to BMI (25.0 and 30.0 kg/m2, respectively) while horizontal lines indicate cut-offs for defining OW and OB according to BF% (20.0 and 25.0% in males and 30.0 and 35.0% in females, respectively). The number of subjects in each quadrant is indicated. Colors denote normal weight/underweight (NW/UW), OW or OB according to BF%
Fig. 4
Fig. 4
Phenotyping system according to fat mass and skeletal muscle mass. The evaluation regarding skeletal muscle mass includes amount and functionality. The diagnostic criteria are reported in a consensus statement [136]
Fig. 5
Fig. 5
Proposed phenotyping system based on a combination of the actual adiposity expressed as body fat percentage (BF%) and waist circumference (WC) as a measure of adiposity distribution. The cutoff points are those defined by the WHO for WC and the most frequently used for BF% (see text). This phenotyping system establishes nine different types (1a to 3c) clustered in five different phenotypes according to the cardiometabolic risk. Green: no risk; yellow: slightly increased risk; orange: increased risk; dark orange: high risk and red: very high risk

References

    1. Blüher M. Obesity: global epidemiology and pathogenesis. Nat Rev Endocrinol. 2019;15:288–98. doi: 10.1038/s41574-019-0176-8. - DOI - PubMed
    1. The GBD 2015 Obesity Collaborators Health effects of overweight and obesity in 195 countries over 25 years. N Engl J Med. 2017;377:13–27. doi: 10.1056/NEJMoa1614362. - DOI - PMC - PubMed
    1. Catalán V, Avilés-Olmos I, Rodríguez A, Becerril S, Fernández-Formoso JA, et al. Time to consider the “Exposome Hypothesis” in the development of the obesity pandemic. Nutrients. 2022;14:1597. doi: 10.3390/nu14081597. - DOI - PMC - PubMed
    1. Bray GA, Heisel WE, Afshin A, Jensen MD, Dietz WH, et al. The science of obesity management: an Endocrine Society scientific statement. Endocr Rev. 2018;39:79–132. doi: 10.1210/er.2017-00253. - DOI - PMC - PubMed
    1. Frühbeck G, Busetto L, Dicker D, Yumuk V, Goossens GH, et al. The ABCD of obesity: an EASO position statement on a diagnostic term with clinical and scientific implications. Obes Facts. 2019;12:131–6. doi: 10.1159/000497124. - DOI - PMC - PubMed

Publication types