. 2023 Apr;29(4):917-926.
doi: 10.1038/s41591-023-02255-1. Epub 2023 Mar 16.

Multiomic neuropathology improves diagnostic accuracy in pediatric neuro-oncology

Dominik Sturm  1   2   3 David Capper  4   5 Felipe Andreiuolo  6   7   8 Marco Gessi  6 Christian Kölsche  9 Annekathrin Reinhardt  10 Philipp Sievers  10 Annika K Wefers  11 Azadeh Ebrahimi  6   10   12 Abigail K Suwala  10   12   13 Gerrit H Gielen  6 Martin Sill  1   14 Daniel Schrimpf  10 Damian Stichel  10   12 Volker Hovestadt  15   16 Bjarne Daenekas  4   15   16 Agata Rode  1   2 Stefan Hamelmann  10   12 Christopher Previti  1   14 Natalie Jäger  1   14 Ivo Buchhalter  17 Mirjam Blattner-Johnson  1   2 Barbara C Jones  1   2   3 Monika Warmuth-Metz  18   19 Brigitte Bison  19   20 Kerstin Grund  21 Christian Sutter  21 Steffen Hirsch  1   14   21 Nicola Dikow  21 Martin Hasselblatt  22 Ulrich Schüller  11   23   24 Arend Koch  4 Nicolas U Gerber  25 Christine L White  26   27   28 Molly K Buntine  26   27 Kathryn Kinross  29 Elizabeth M Algar  26   27   30 Jordan R Hansford  31 Nicholas G Gottardo  32   33   34 Martin U Schuhmann  35 Ulrich W Thomale  36 Pablo Hernáiz Driever  37 Astrid Gnekow  38 Olaf Witt  1   3   39 Hermann L Müller  40 Gabriele Calaminus  41 Gudrun Fleischhack  42 Uwe Kordes  23 Martin Mynarek  23   43 Stefan Rutkowski  23 Michael C Frühwald  38 Christof M Kramm  44 Andreas von Deimling  10   12 Torsten Pietsch  6 Felix Sahm  1   10   12 Stefan M Pfister  1   3   14 David T W Jones  45   46
Affiliations

Multiomic neuropathology improves diagnostic accuracy in pediatric neuro-oncology

Dominik Sturm et al. Nat Med. 2023 Apr.

Erratum in

  • Author Correction: Multiomic neuropathology improves diagnostic accuracy in pediatric neuro-oncology.
    Sturm D, Capper D, Andreiuolo F, Gessi M, Kölsche C, Reinhardt A, Sievers P, Wefers AK, Ebrahimi A, Suwala AK, Gielen GH, Sill M, Schrimpf D, Stichel D, Hovestadt V, Daenekas B, Rode A, Hamelmann S, Previti C, Jäger N, Buchhalter I, Blattner-Johnson M, Jones BC, Warmuth-Metz M, Bison B, Grund K, Sutter C, Hirsch S, Dikow N, Hasselblatt M, Schüller U, Koch A, Gerber NU, White CL, Buntine MK, Kinross K, Algar EM, Hansford JR, Gottardo NG, Schuhmann MU, Thomale UW, Hernáiz Driever P, Gnekow A, Witt O, Müller HL, Calaminus G, Fleischhack G, Kordes U, Mynarek M, Rutkowski S, Frühwald MC, Kramm CM, von Deimling A, Pietsch T, Sahm F, Pfister SM, Jones DTW. Sturm D, et al. Nat Med. 2024 Jan;30(1):306. doi: 10.1038/s41591-023-02652-6. Nat Med. 2024. PMID: 37875569 Free PMC article. No abstract available.

Abstract

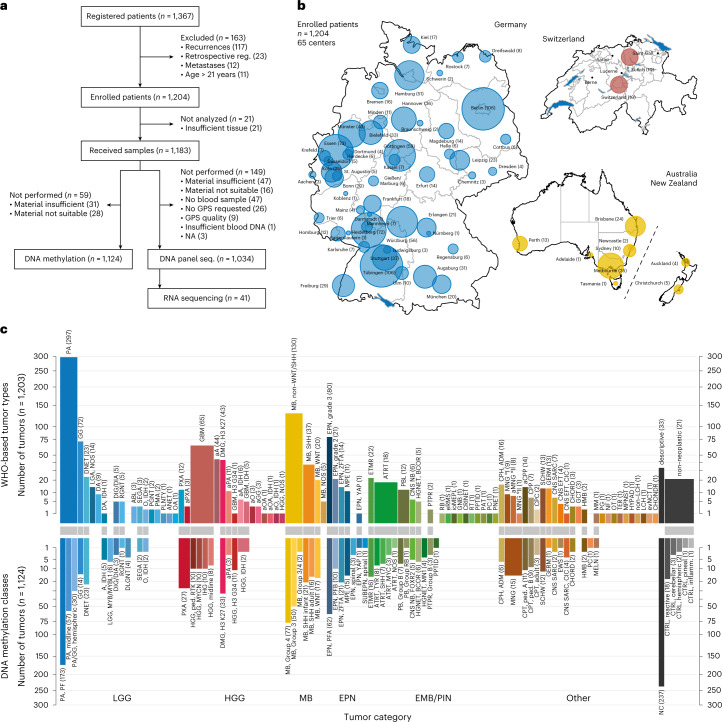
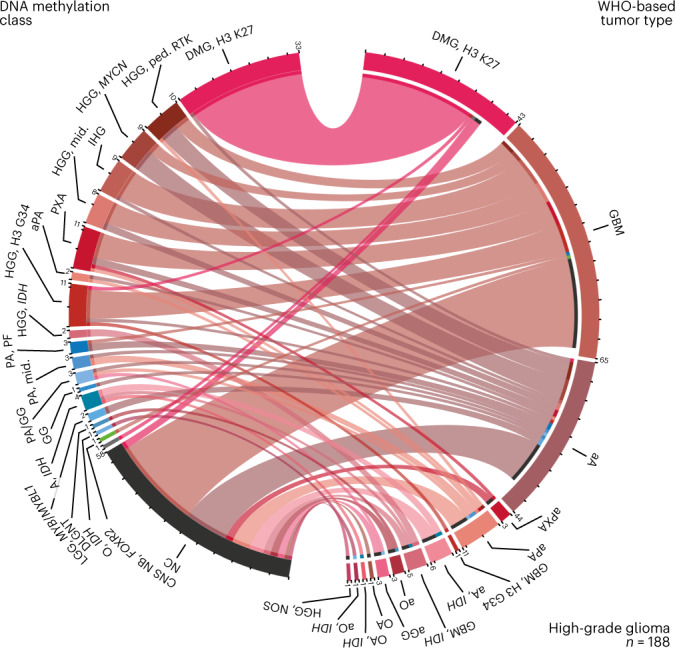
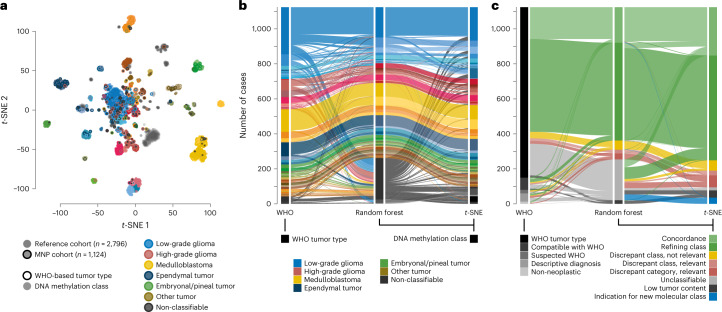
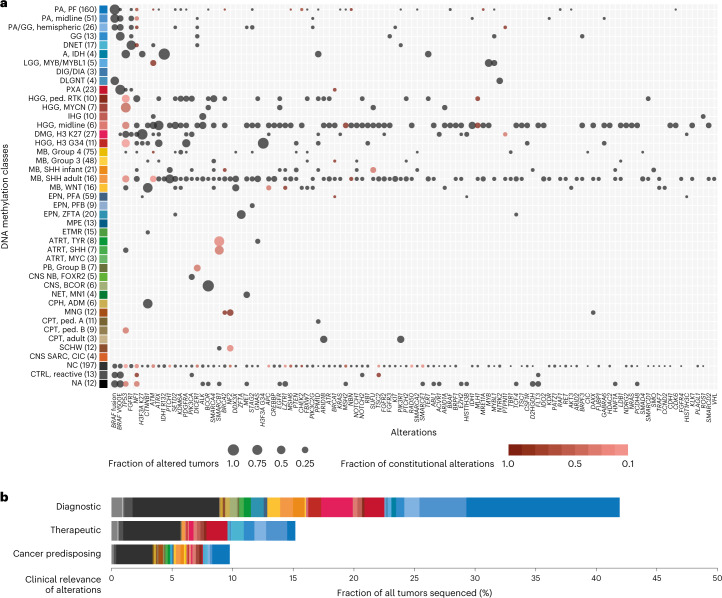
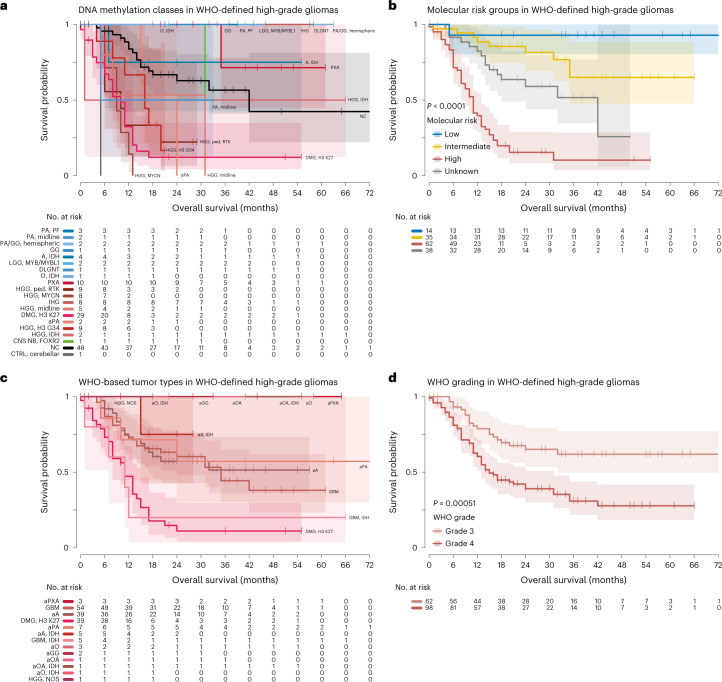
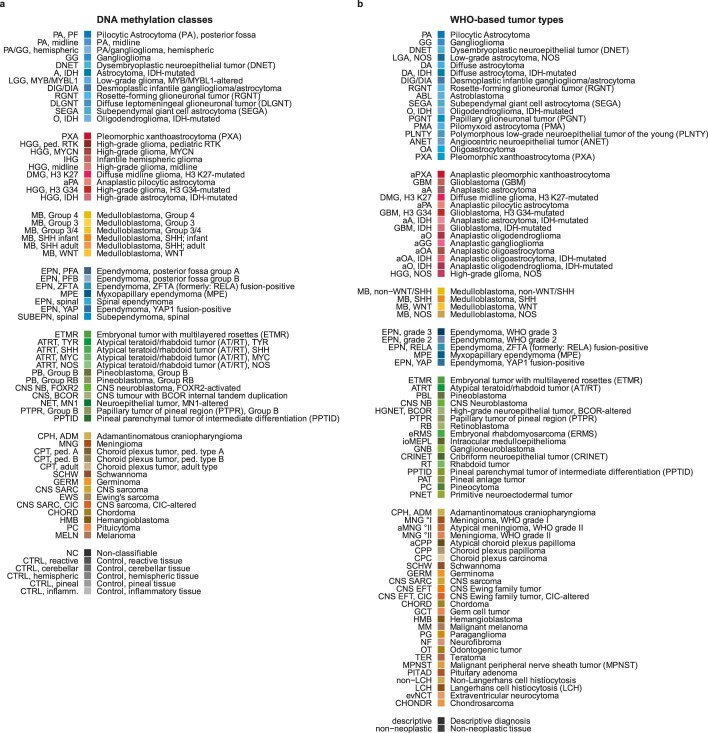
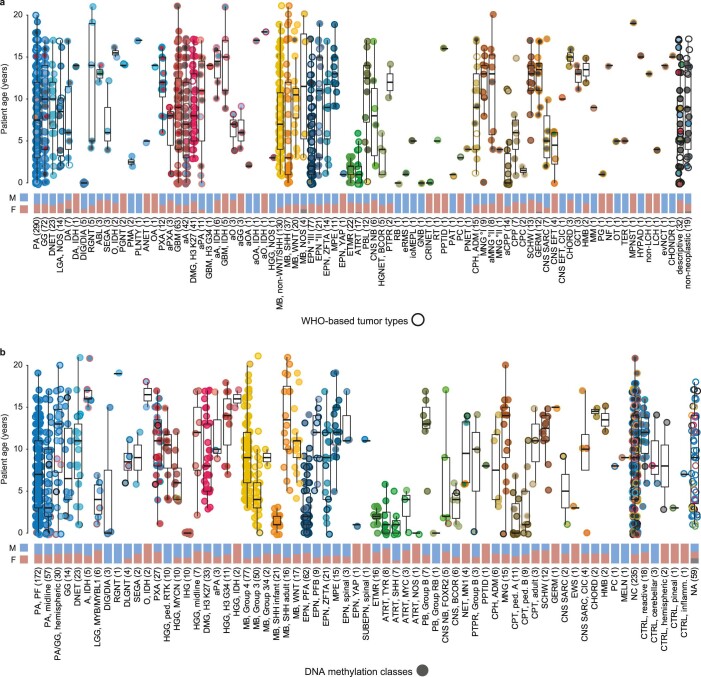
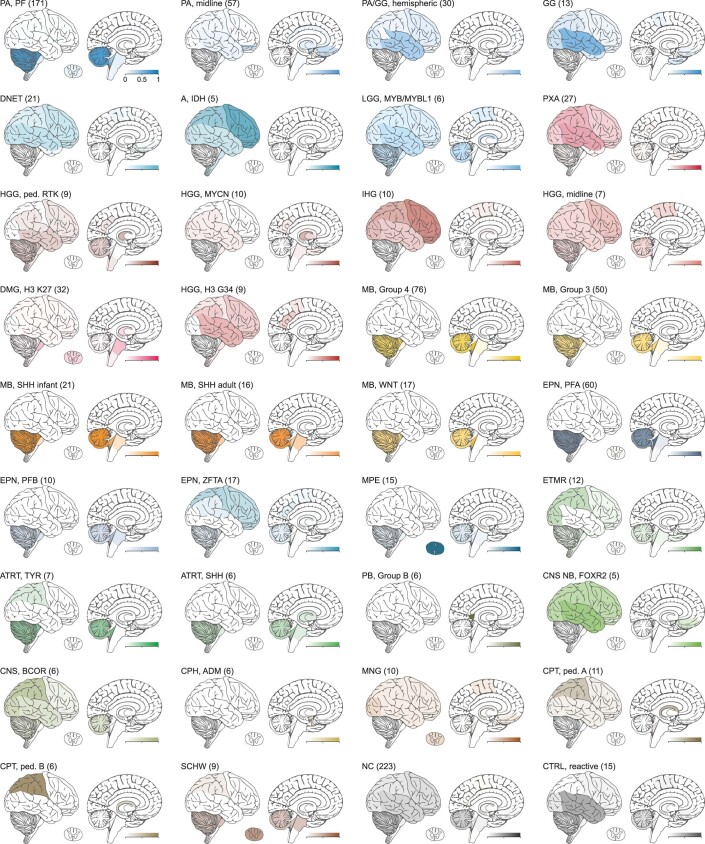
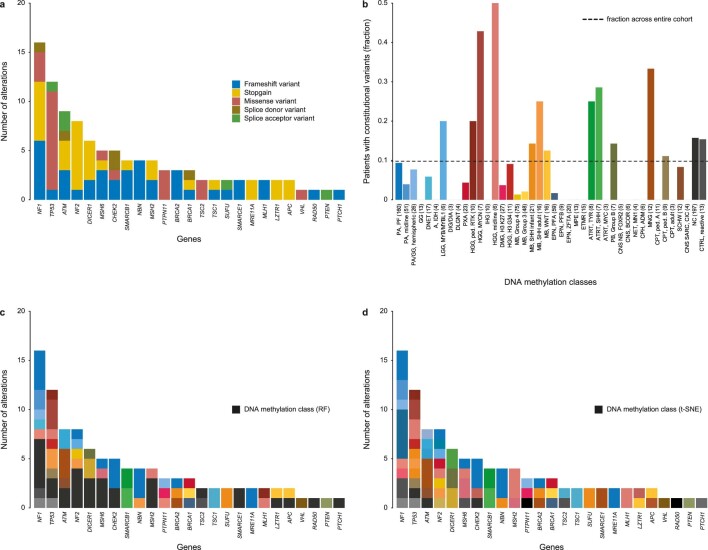
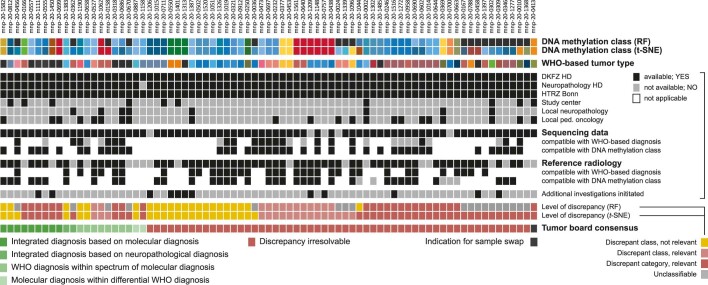
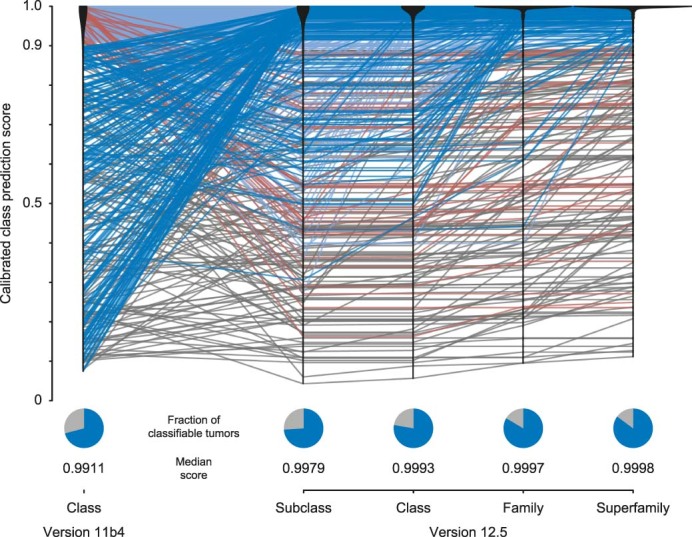
The large diversity of central nervous system (CNS) tumor types in children and adolescents results in disparate patient outcomes and renders accurate diagnosis challenging. In this study, we prospectively integrated DNA methylation profiling and targeted gene panel sequencing with blinded neuropathological reference diagnostics for a population-based cohort of more than 1,200 newly diagnosed pediatric patients with CNS tumors, to assess their utility in routine neuropathology. We show that the multi-omic integration increased diagnostic accuracy in a substantial proportion of patients through annotation to a refining DNA methylation class (50%), detection of diagnostic or therapeutically relevant genetic alterations (47%) or identification of cancer predisposition syndromes (10%). Discrepant results by neuropathological WHO-based and DNA methylation-based classification (30%) were enriched in histological high-grade gliomas, implicating relevance for current clinical patient management in 5% of all patients. Follow-up (median 2.5 years) suggests improved survival for patients with histological high-grade gliomas displaying lower-grade molecular profiles. These results provide preliminary evidence of the utility of integrating multi-omics in neuropathology for pediatric neuro-oncology.


Conflict of interest statement

D.C., M.S., D. Schrimpf, A.v.D., F.S., S.M.P. and D.T.W.J. are shareholders in and co-founders of Heidelberg Epignostix GmbH. All other authors declare no competing interests.

Figures

Fig. 1
Fig. 1. Study design, patient recruitment and CNS tumor classification.
a, CONSORT flow diagram for 1,367 patients registered between April 2015 and March 2019. b, Schematic geographical overview of 1,204 enrolled patients by center of recruitment. Circle size is proportional to the number of patients. Country size is not to scale. c, Tumor classification into WHO-based CNS tumor types (upper panel) and DNA methylation classes (lower panel). Numbers in brackets indicate tumors per tumor type or class. Corresponding and overlapping tumor types and classes are indicated by connecting gray bars. y-axis scale is square root transformed for improved visibility of tumor types and classes occurring at low frequency. See Extended Data Fig. 1 for a full list of individual abbreviations. See Supplementary Table 1 for underlying data. GPS, gene panel sequencing.
Fig. 2
Fig. 2. DNA methylation classes in WHO-based pediatric HGGs.
Comparison of assigned DNA methylation classes (left semicircle) and WHO-based tumor types (right semicircle) across HGGs. Colors correspond to tumor types and classes as indicated in Fig. 1 and Extended Data Fig. 1. This category of HGGs is composed of WHO-based tumor type. See Supplementary Fig. 6 for composition by DNA methylation class. See Supplementary Table 1 for underlying data.
Fig. 3
Fig. 3. Landscape of DNA methylation classes and levels of concordance with WHO-based diagnosis.
a, t-SNE analysis of DNA methylation data from the study cohort alongside 89 published DNA methylation classes. Each tumor from the study cohort is represented by a circle indicating assigned DNA methylation class (fill) and WHO-based tumor type (outline). b, Comparison of WHO-based tumor types and DNA methylation classes assigned by RF-based class prediction and t-SNE analysis. Colors in a and b correspond to tumor types and classes as indicated in Fig. 1 and Extended Data Fig. 1. c, Comparison of certainty levels of WHO-based diagnoses and concordance with DNA methylation classes assigned by RF-based class prediction and t-SNE analysis. See Supplementary Tables 1 and 4 for underlying data.
Fig. 4
Fig. 4. Landscape and relevance of somatic and constitutional alterations.
a, Frequency of alterations detected in tumors (indicated by circle size) and fraction of alterations detected in corresponding constitutional DNA (color scale) across DNA methylation classes. Gene alterations (x-axis) are ranked by the number of affected samples. Numbers in brackets indicate tumors with available sequencing data. Only DNA methylation classes with available sequencing data for ≥3 cases and only alterations detected in ≥2 tumors are displayed. b, Fraction and clinical relevance of alterations detected by NGS. Colors indicate DNA methylation class. See Supplementary Table 6 for underlying data.
Fig. 5
Fig. 5. Molecular risk stratification of pediatric patients with HGG.
Kaplan–Meier estimates of OS in patients with WHO-defined HGGs according to DNA methylation class (a), molecular risk group (b), WHO-based tumor type (c) and WHO grade (d). Colors in a and c correspond to tumor types and classes as indicated in Fig. 1 and Extended Data Fig. 1. Shaded areas indicate the 95% confidence interval for each Kaplan–Meier estimate (solid lines). See Supplementary Table 1 for underlying and further data.
Extended Data Fig. 1
Extended Data Fig. 1. Tumor class and type color legend and abbreviations.
a, DNA methylation classes, abbreviations and colors used for representation in this article. b, WHO-based diagnoses, abbreviations and colors used for representation in this article. Corresponding DNA methylation classes and WHO-based diagnoses share the same color hue; overlapping DNA methylation classes and WHO-based diagnoses share shades of the same color hue. DNA methylation classes and WHO-based diagnoses from the same tumor category share a similar color hue spectrum.
Extended Data Fig. 2
Extended Data Fig. 2. Clinical patient characteristics.
Patient age (combined scattered and boxplots, upper panel) and sex (stacked bar charts, lower panel) across WHO-based diagnoses (a) and DNA methylation classes (b). Each tumor is represented by a circle indicating assigned WHO-based tumor type (outline) and DNA methylation class (fill), and colors correspond to tumor types and classes as indicated in Fig. 1 and Extended Data Fig. 1. Numbers in brackets indicate tumors per tumor class or type with available data. Center line, median; box limits, upper and lower quartiles; whiskers, 1.5 x interquartile range. F, female; M, male. See Supplementary Table 1 for underlying data.
Extended Data Fig. 3
Extended Data Fig. 3. Tumor location by DNA methylation class.
Heatmap representation of tumor location by DNA methylation class for classes with ≥ five samples. Numbers in brackets indicate tumors with available data. Color scales indicate the fraction of tumors affecting an anatomical region, and colors correspond to tumor types and classes as indicated in Fig. 1 and Extended Data Fig. 1. See Supplementary Table 1 for underlying data.
Extended Data Fig. 4
Extended Data Fig. 4. Significant regions of DNA copy number alterations by DNA methylation class.
Plots show the q-values (x-axes, indicating the false discovery rate) determined by GISTIC2.0 with respect to significant lost (blue) and gained (red) genomic regions among the human chromosomes 1 to 22 (hg19) in DNA methylation classes ‘infantile hemispheric glioma’ (a), ‘pleomorphic xanthoastrocytoma’ (b), ‘embryonal tumor with multilayered rosettes’ (ETMR, c), ‘low-grade glioma, MYB/MYBL1-altered’ (d), ‘high-grade glioma, MYCN’ (e), and ‘high-grade glioma, pediatric RTK’ (f). Numbers in brackets indicate sample size for each class. Green lines indicate the significance threshold of q-value < 0.25. The cytobands of significantly altered regions are denoted on the y-axes. See Supplementary Table 2 for a detailed overview of significantly amplified/deleted regions across all DNA methylation classes.
Extended Data Fig. 5
Extended Data Fig. 5. Comparison of WHO-based and DNA methylation-based tumor classification.
Comparison of assigned DNA methylation classes (left semicircle) and WHO-based tumor types (right semicircle) across low-grade gliomas (LGG, a), medulloblastomas (MB, b), ependymal tumors (EPN, c), embryonal/pineal tumors (EMB/PIN, d), other types (e), and samples with a descriptive diagnosis or non-neoplastic tissue (f). Colors correspond to tumor types and classes as indicated in Fig. 1 and Extended Data Fig. 1. Categories in a–f are composed by WHO-based tumor type; see Supplementary Fig. 6 for composition by DNA methylation class. See Supplementary Table 1 for underlying data.
Extended Data Fig. 6
Extended Data Fig. 6. Correlation between DNA methylation-based and WHO-based CNS tumor classification.
Correlation between DNA methylation-based and WHO-based CNS tumor classification. Phi correlation coefficient between DNA methylation-based classes and WHO-based tumor types is represented by a color scale as indicated. Numbers in brackets indicate the number of tumors per tumor type/class. Only correlations with a P-value < 0.01 are displayed; see Supplementary Fig. 7 for all possible correlations between DNA methylation classes and WHO-based tumor types. See Supplementary Table 1 and Supplementary Table 3 for underlying data.
Extended Data Fig. 7
Extended Data Fig. 7. Overview of somatic alterations.
a, Number of detected somatic alterations per gene colored by alteration type as indicated. b, Number of altered tumors per gene colored by DNA methylation class. c, Tumor mutational burden (combined scattered and boxplots) per individual tumor grouped by DNA methylation class. Each tumor is represented by a circle indicating assigned WHO-based tumor type (outline) and DNA methylation class (fill). Numbers in brackets indicate tumors with available sequencing data. Colors in (b) and (c) correspond to tumor classes as indicated in Fig. 1 and Extended Data Fig. 1. Center line, median; box limits, upper and lower quartiles; whiskers, 1.5 x interquartile range. See Supplementary Table 6 for underlying data.
Extended Data Fig. 8
Extended Data Fig. 8. Overview of constitutional alterations.
a, Number of detected pathogenic constitutional alterations per gene colored by alteration type as indicated. b, Relative fraction of patients with pathogenic constitutional variants per DNA methylation class. Numbers in brackets indicate tumors with available sequencing data. Only DNA methylation classes with available sequencing data for ≥ 3 cases are displayed. The dashed line indicates the fraction of patients with constitutional pathogenic variants across the entire cohort (at 0.98). c and d, Number of pathogenic constitutional variants per gene colored by random forest (RF)-based DNA methylation class prediction (c) and t-SNE-based DNA methylation class assignment (d). Colors in (b–d) correspond to tumor classes as indicated in Fig. 1 and Extended Data Fig. 1. See Supplementary Table 6 for underlying data.
Extended Data Fig. 9
Extended Data Fig. 9. Tumor board discussions of cases with discrepant classification.
Details of tumor board discussions of tumors with discrepant classification by random forest (RF)-based and t-SNE-based DNA methylation class assignment (as in Fig. 3c and Supplementary Fig. 8; upper two rows) and WHO-based tumor type (third row). Colors in rows 1–3 correspond to tumor types and classes as indicated in Fig. 1 and Extended Data Fig. 1. Tumor board participants and availability of additional information (gene panel sequencing, reference radiology) is indicated by black boxes as well as compatibility with DNA methylation- and WHO-based tumor classification. Levels of discrepancy (corresponding to Fig. 3c and Supplementary Fig. 8) and tumor board consensus are categorized in bottom rows. See Supplementary Table 1 for underlying data.
Extended Data Fig. 10
Extended Data Fig. 10. Advancement of automated DNA methylation class prediction.
Calibrated class prediction scores of random forest-based DNA methylation class prediction in version 11b4 and prediction scores for DNA methylation levels: subclasses, classes, class families, and superfamilies in version 12.5 (upper panel). Every line represents one tumor; light blue: classifiable by both versions; dark blue: classifiable by version 12.5 only; red: classifiable by version 11b4 only; grey: non-classifiable by both versions. Black violin plots represent density estimates for each version and level. Pie charts (lower panel) indicate the fractions of classifiable tumors (calibrated scores ≥ 0.9, blue) and unclassifiable tumors (calibrated scores < 0.9, grey) by each version and level. See Supplementary Table 1 for underlying data.

Comment in

References

    1. Louis, D.N., Ohgaki, H., Wiestler, O.D. & Cavenee, W.K. WHO Classification of Tumours of the Central Nervous System. Revised 4th ed (WHO Press, 2016).
    1. WHO Classification of Tumours Editorial Board. Central Nervous System Tumours. WHO Classification of Tumours, 5th ed, vol 6. https://publications.iarc.fr/601 (International Agency for Research on Cancer, 2021).
    1. Sahm F, et al. Next-generation sequencing in routine brain tumor diagnostics enables an integrated diagnosis and identifies actionable targets. Acta Neuropathol. 2016;131:903–910. doi: 10.1007/s00401-015-1519-8. - DOI - PubMed
    1. Capper D, et al. DNA methylation-based classification of central nervous system tumours. Nature. 2018;555:469–474. doi: 10.1038/nature26000. - DOI - PMC - PubMed
    1. Pickles JC, et al. DNA methylation-based profiling for paediatric CNS tumour diagnosis and treatment: a population-based study. Lancet Child Adolesc. Health. 2020;4:121–130. doi: 10.1016/S2352-4642(19)30342-6. - DOI - PubMed

Publication types