. 2023 Apr;29(4):859-868.
doi: 10.1038/s41591-023-02226-6. Epub 2023 Mar 16.

A longitudinal circulating tumor DNA-based model associated with survival in metastatic non-small-cell lung cancer

Affiliations

A longitudinal circulating tumor DNA-based model associated with survival in metastatic non-small-cell lung cancer

Zoe June F Assaf et al. Nat Med. 2023 Apr.

Abstract

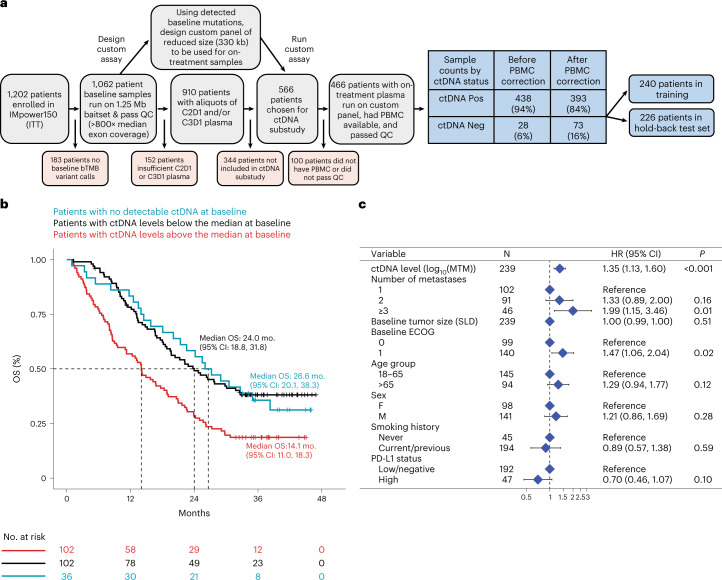
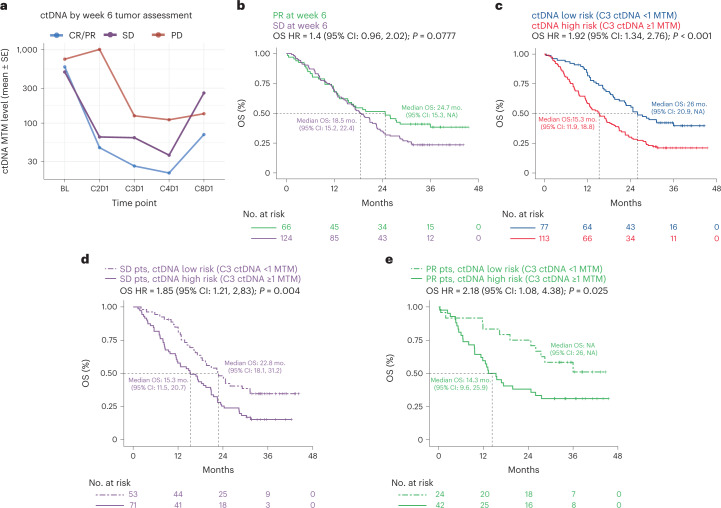
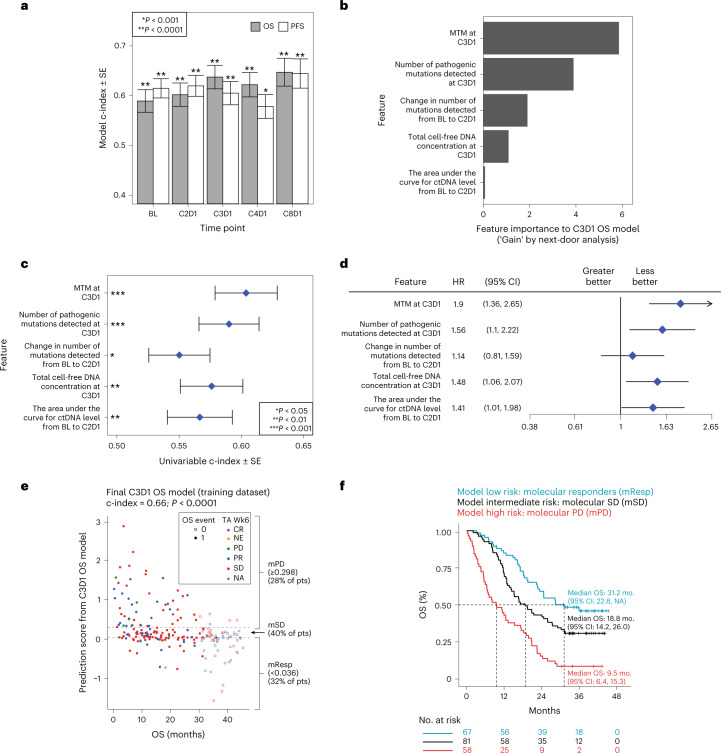
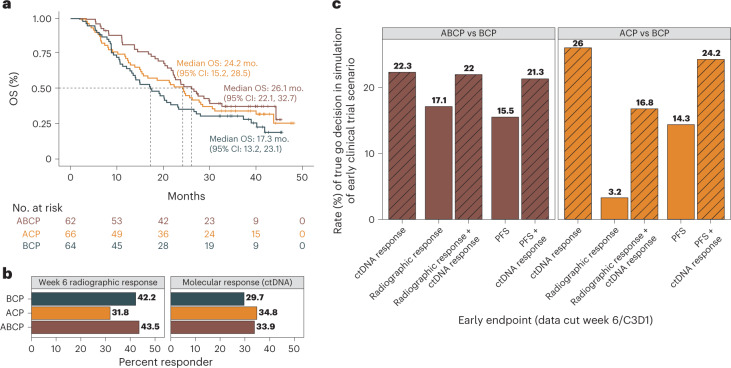
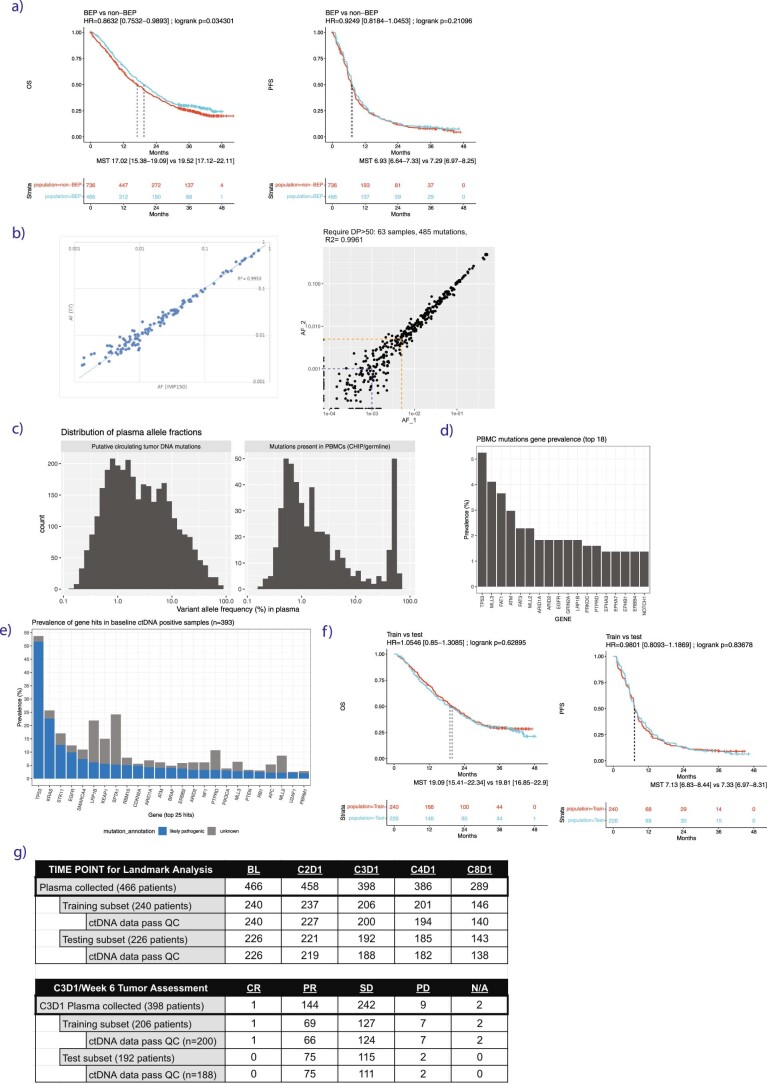
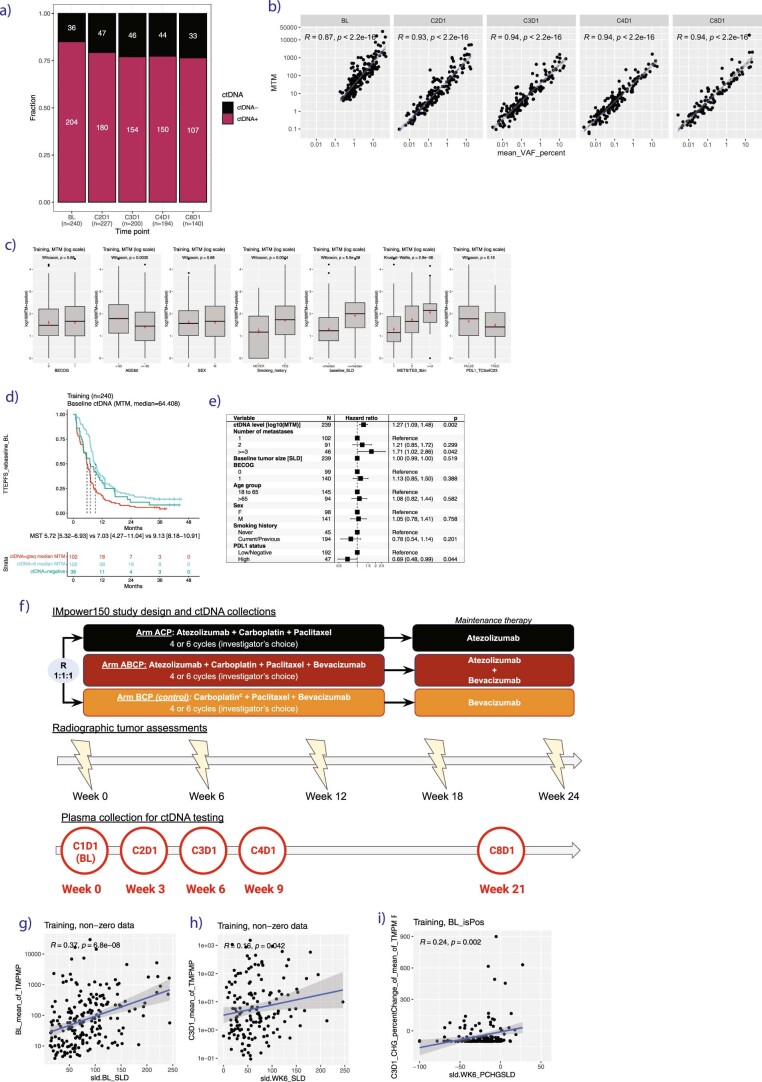
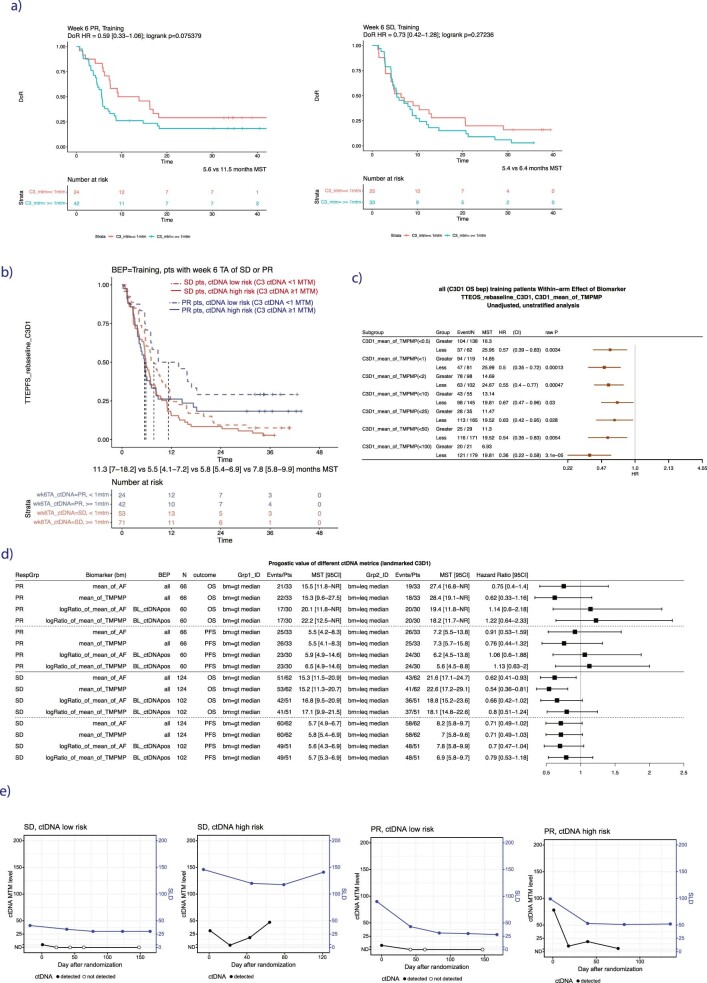
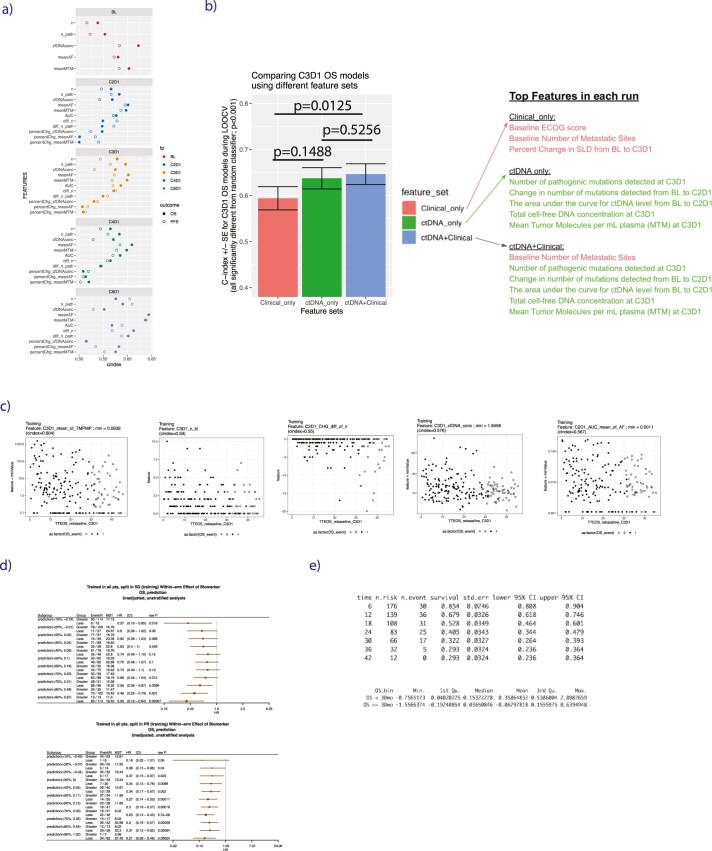
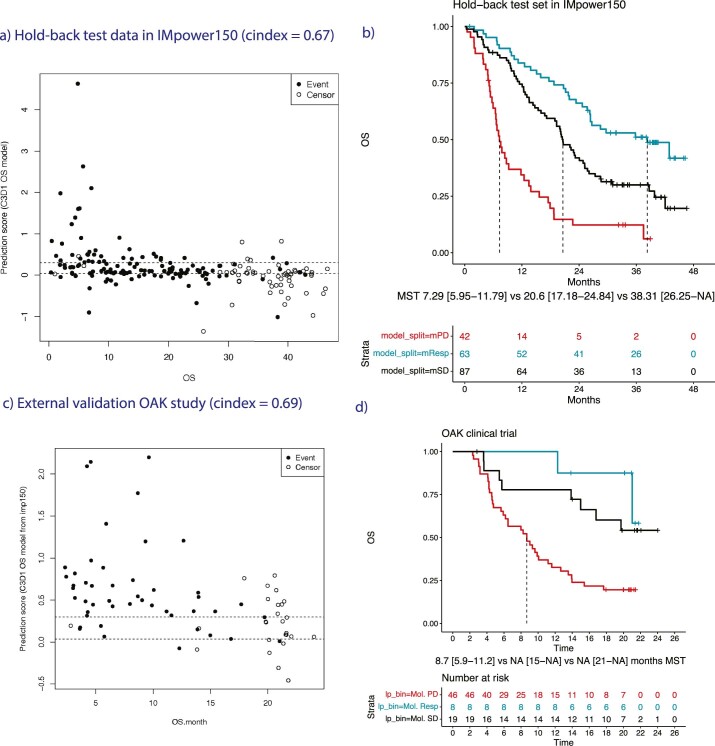
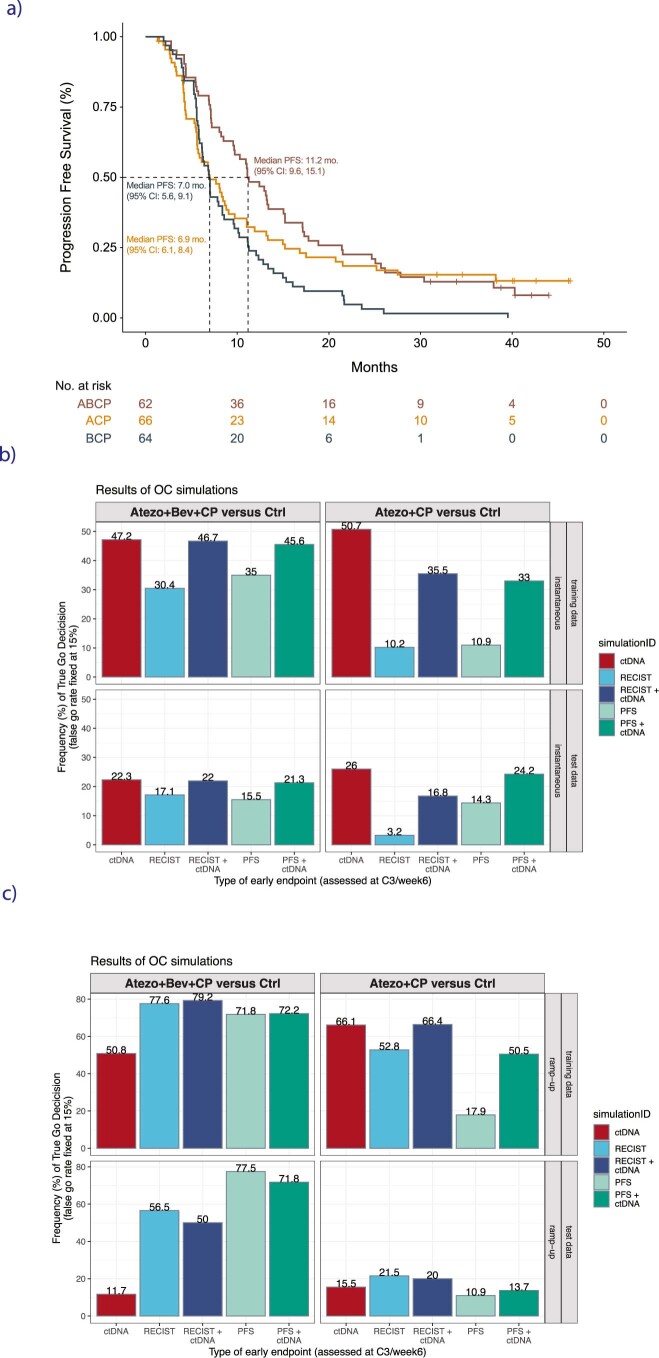
One of the great challenges in therapeutic oncology is determining who might achieve survival benefits from a particular therapy. Studies on longitudinal circulating tumor DNA (ctDNA) dynamics for the prediction of survival have generally been small or nonrandomized. We assessed ctDNA across 5 time points in 466 non-small-cell lung cancer (NSCLC) patients from the randomized phase 3 IMpower150 study comparing chemotherapy-immune checkpoint inhibitor (chemo-ICI) combinations and used machine learning to jointly model multiple ctDNA metrics to predict overall survival (OS). ctDNA assessments through cycle 3 day 1 of treatment enabled risk stratification of patients with stable disease (hazard ratio (HR) = 3.2 (2.0-5.3), P < 0.001; median 7.1 versus 22.3 months for high- versus low-intermediate risk) and with partial response (HR = 3.3 (1.7-6.4), P < 0.001; median 8.8 versus 28.6 months). The model also identified high-risk patients in an external validation cohort from the randomized phase 3 OAK study of ICI versus chemo in NSCLC (OS HR = 3.73 (1.83-7.60), P = 0.00012). Simulations of clinical trial scenarios employing our ctDNA model suggested that early ctDNA testing outperforms early radiographic imaging for predicting trial outcomes. Overall, measuring ctDNA dynamics during treatment can improve patient risk stratification and may allow early differentiation between competing therapies during clinical trials.


Conflict of interest statement

Z.J.A., D.S., K.S., C.C., Z.J.A., A.R., M.L., N.P., and W.Z. disclose current or recent employment with Roche. Z.J.A., D.S., K.S., G.O., C.C., M.L., D.F., N.P., W.Z., A.F., D.L., A.R., A.Y., and J.F. disclose stock or other ownership interests with Roche. G.O., A.Y., A.F., D.F., D.L., M.K., E.P., and J.F. disclose current or recent employment with FMI. M.R. discloses funding from Genentech, Pfizer, Spectrum, Takeda, Daiichi Sankyo, AstraZeneca, and Speaker Bureau for Genentech, AstraZeneca, Guardant, Jazz, Janssen and GI Therapeutics. M.S. discloses funding from Genentech, Pfizer, Spectrum, Takeda, Novartis, Beigene, AstraZeneca, and Daiichi Sankyo and discloses speaking fees from Genentech, Lilly, Blueprint, Guardant, BMS, Jazz, GI Therapeutics, Janssen and Amgen. M.L. discloses board member and shareholder in Foresight Diagnostics, scientific advisory board member and shareholder in Delfi Diagnostics and Prognomiq, Inc. The other authors declare no competing interests.

Figures

Fig. 1
Fig. 1. Design of ctDNA substudy and prognostic value of baseline ctDNA in training set.
a, Consort diagram showing how the final 466 patients in the ctDNA evaluable population were identified and showing the prevalence of ctDNA positivity at the baseline time point before and after PBMC correction. b, Kaplan–Meier analysis showing the prognostic value of baseline ctDNA for OS in the training set of patients (n = 240), where blue curve indicates ctDNA negative patients (zero mutations detected), red curve indicates patients with ctDNA levels greater than or equal to the median (≥64 MTM) and black curve indicates patients with ctDNA levels less than the median. c, Multivariable Cox regression including baseline clinical features confirms that the ctDNA level is an independently poor prognostic factor for OS (n = 239 patients with nonmissing data available for all baseline clinical features). Two-sided Wald test P values are reported, and points and error bars indicate HR and 95% confidence interval, respectively. The exact P value for the first row ‘P < 0.001’ is 0.000672. MTM, mean tumor molecules.
Fig. 2
Fig. 2. On treatment ctDNA dynamics associate with clinical outcomes in the training dataset.
a, On-treatment ctDNA levels as measured by MTM (per milliliter plasma) across longitudinal time points for patients with week 6 radiographic assessments of treatment response of PD (red), SD (purple) and CR/PR (blue). b, KM curves showing OS for patients with SD (purple) versus PR (green) as determined at the week 6 radiographic assessment of treatment response. A univariable Cox proportional-hazards model was used to estimate HR and log-rank test to report P value. c, KM curves showing OS for patients with C3D1 ctDNA levels below the LOD of the assay (<1 MTM, ctDNA low risk, blue) versus near or above the LOD (≥1 MTM, ctDNA high risk, red). A univariable Cox proportional-hazards model was used to estimate HR and log-rank test to report P value. The exact P value for ‘P < 0.001’ is 0.00029871. d,e, KM curves showing OS for patients with SD (d) and PR (e) at week 6 who are further risk stratified by ctDNA levels at C3D1. A univariable Cox proportional-hazards model was used to estimate HR and log-rank test to report P value. MTM, mean tumor molecules.
Fig. 3
Fig. 3. Building a machine learning model in the training dataset.
a, Model performance for each survival outcome (PFS, OS) and plasma collection (BL thru C8D1) estimated by rank concordance (c-index) calculated from leave-one-out-cross-validation (LOOCV) to fit an elastic net model with ctDNA features. Bar height indicates c-index estimate, error bars indicate ± the standard error of the c-index, and two-sided P values are shown comparing each model’s c-index to random classifier. Each model is built using patients in the training subset at-risk for the relevant landmarked survival endpoint, where the numbers from left to right are: 240, 240, 237, 237, 206, 202, 201, 196, 146 and 136. The exact P values from left to right are 6.69 × 10−5, 9.50 × 10−10, 1.06 × 10−5, 7.97 × 10−9, 2.87 × 10−9, 4.16 × 10−6, 3.35 × 10−7, 0.000797098, 6.54 × 10−8, 3.18 × 10−7. b, Gain metric by next-door analysis for the five top features identified during LOOCV for the C3D1 OS ctDNA model. c, Univariable c-index showing the strength of association between OS from C3D1 (n = 206 patients) and each of the five top features for the C3D1 OS ctDNA model. Error bars indicate ± standard error of the c-index. Exact values from top to bottom for the two-sided P values comparing c-index to a random classifier are 2.23 × 10−5, 1.35 × 10−4, 0.0366, 0.0021 and 0.0093. d, Forest plot showing the HR for OS from C3D1 (n = 206 patients) estimated by univariable Cox proportional-hazards model, using the median value for the feature split, for the five top features for C3D1 OS ctDNA model. Higher feature values (above median) were generally associated with worse OS (HR above 1). Points and error bars indicate HR and 95% CI, respectively. e, Scatterplot showing final C3D1 OS ctDNA model predictions (y axis) versus OS time (x axis) in the training data, with dotted lines indicating the thresholds chosen in training set for mPD (≥0.298 prediction score), molecular response (mResp < 0.036) and molecular stable disease (mSD for (0.036, 0.298)). The exact value for the two-sided P value comparing the final C3D1 OS model’s c-index to a random classifier P value indicated by ‘P < 0.0001’ is 1.318316 × 10−12. f, KM curve showing that the final C3D1 OS ctDNA model can risk stratify patients in the training data.
Fig. 4
Fig. 4. Machine learning model performs well for risk stratification in the hold-back test dataset and in the OAK external validation cohort.
a, KM curve showing that the final C3D1 OS ctDNA model can be used for risk stratification in the hold-back test data, where patients with mPD (red) have worse OS compared to patients with a molecular response or molecular stable disease (mResp + mSD, blue). A univariable Cox proportional-hazards model was used to estimate HR and log-rank test to report P value. The exact P value indicated by ‘P < 0.001’ is 3.7228 × 10−10. b, KM curve showing that patients with radiographic treatment response of SD at the week 6 tumor assessment can be risk stratified using the final C3D1 OS ctDNA model in the hold-back test data, identifying SD/ctDNA high-risk patients (mPD, solid curve) and SD/ctDNA low-intermediate risk patients (mSD + mResp, dashed curve). A univariable Cox proportional-hazards model was used to estimate HR and log-rank test to report P value. The exact P value indicated by ‘P < 0.001’ is 8.8076 × 10−7. c, KM curve showing that patients with radiographic treatment response of PR at the week 6 tumor assessment can be risk stratified using the final C3D1 OS ctDNA model in the hold-back test data, identifying PR/ctDNA high-risk patients (mPD, solid curve) and PR/ctDNA low-intermediate risk patients (mSD + mResp, dashed curve). A univariable Cox proportional-hazards model was used to estimate HR and log-rank test to report P value. The exact P value indicated by ‘P < 0.001’ is 0.0003018. d, KM curve showing that the C3D1 OS model applied to the external validation cohort of 73 patients from the OAK clinical trial can provide predictions that identify high-risk patients in this 2nd line mNSCLC setting that used a distinct ctDNA assay technology. A univariable Cox proportional-hazards model was used to estimate HR and log-rank test to report P value. The exact P value indicated by ‘P < 0.001’ is 0.000119.
Fig. 5
Fig. 5. Machine learning model may be useful for detecting differences between treatment arms in early phase 2 clinical trial scenarios.
a, KM curve showing OS in the test dataset for the three arms in the IMpower150 trial including ABCP (brown) versus ACP (orange) versus the control arm of BCP (black, control arm). b, Bar plot showing the rate of radiographic response at the week 6 tumor assessment for each treatment arm (left panel, CR/PR by RECIST criteria), and the rate of ctDNA molecular response for each treatment arm (right panel, mResp by C3D1 OS ctDNA model). c, Bar plot showing results from simulations of early phase 2 clinical trial scenario utilizing test data, where an early endpoint based on ctDNA (mResp by C3D1 OS model) is compared to early radiographic endpoints (week 6 RECIST response, week 6 PFS). Bar height corresponds to the proportion of simulations in which the active arm had higher rates of treatment response compared to control arm (‘true go rate’) for each early endpoint (x axis), where the left panel shows simulations comparing active ABCP arm to control BCP arm (left panel, brown colors), and right panel shows simulations comparing active ACP arm to control BCP arm (right panel, orange colors). X axis corresponds to which early endpoint is used in the simulation, comparing ctDNA criteria alone (mResp by C3D1 OS model), radiographic response alone (CR/PR by RECIST), PFS alone, or ctDNA added to radiographic response or PFS response.
Extended Data Fig. 1
(a) KM curves showing OS (left) and PFS (right) for IMpower150 patients in the ctDNA biomarker evaluable population (BEP, blue) versus the ctDNA non-biomarker-evaluable-population (non-BEP, red). (b) Quality control experiments to show (left panel) high concordance of 330kb custom assay (‘IMP150’) compared to larger 1.25Mb assay (‘T7’), and to show (right panel) high reproducibility and sensitivity of 63 samples run in replicate on the 330kb custom assay where the LOD of the assay is found to be near 0.1% (where 85% of mutations near this frequency are detected reproducibly, blue dashed line) and the LOQ of the assay is near 0.5% (where the % CV of mutations near this frequency is 18%, orange dashed line). (c) Histogram of variant allele frequencies (%) for mutations identified using the custom 330kb panel, showing mutations present in plasma cell-free DNA and absent from PBMCs (left), and for mutations identified in plasma cell-free DNA and present in PBMCs (right). (d) Bar plot showing the genes in which PBMC-derived mutations (CHIP/germline) were most prevalent (y axis, percent of patients). PBMC-derived mutations are defined as those which were identified in both cell-free DNA and PBMCs for genes included in the custom 330kb panel. (e) Bar plot showing the genes in which tumor-derived mutations were most prevalent (y axis, percent of patients). Mutations that are known or likely pathogenic alterations (blue) are delineated from those which are variants of unknown significance (gray). Tumor-derived mutations are defined as those detected in cell-free DNA and absent from PBMCs for genes included in the custom 330kb panel. (f) KM curves showing OS (left) and PFS (right) for patients in the ctDNA biomarker evaluable population in the training split (blue) versus the test split of data (red). (g) Table showing the number of plasma samples collected at each time point, including a breakdown of the number in the training and test subsets which passed ctDNA assay QC, which were used for model training and testing. The bottom table shows number of patients who had C3D1 plasma samples which passed ctDNA assay QC and also treatment response assessments available for week 6 tumor assessment.
Extended Data Fig. 2
(a) Bar plot of number of ctDNA positive and negative samples at each time point in training. (b) Scatterplots showing correlation between mean variant allele frequencies versus mean tumor molecules per ml plasma in training. The baseline timepoint, in addition to having higher patient ctDNA tumor fractions due to occurring prior to treatment initiation, was sequenced with a 1.25Mb assay with reportable VAF range down to ~0.5%. On-treatment time points were sequenced with a 330kb assay with a reportable range down to ~0.01%, and restricted to only mutations detected at baseline. Pearson’s correlation coefficient is reported and its P value based on Pearson’s product moment correlation. (c) Boxplots showing association between baseline clinical features (6 panels, one for each feature) and ctDNA levels as measured by MTM (y axis) in training, where P values reported using a two-sided Wilcoxon rank sum test. The box plots depict the median at the middle line, with the lower and upper hinges at the first and third quartiles, respectively, the whiskers showing the minima to maxima no greater than 1.5× the interquartile range, and the remaining outlying data points plotted individually. Additionally, the mean and standard error are overlayed as red points. Sample sizes for the box plots from left to right are n = 99, 140; 133, 107; 98, 142; 45, 195; 120, 120; 102, 92, 46; 177, 63. (d) KM curve showing the prognostic value of baseline ctDNA MTM levels for PFS in training data. (e) Multivariable cox regression for PFS in training data. Two-sided Wald test P values are reported, and points and error bars indicate HR and 95% confidence interval, respectively. (f) Study schema showing when radiographic and plasma collections were performed in the treatment course. (g-h) Scatterplots showing association between radiographic assessment of tumor size by SLD measurement (x axis) versus ctDNA levels measure by MTM (y axis) for (g) baseline time point, (h) C3D1 time point, (i) change from BL to C3D1. Plots restrict to patients with ctDNA detected at baseline. Error band indicates 95% confidence interval. Pearson’s correlation coefficient is reported and its P value based on Pearson’s product moment correlation.
Extended Data Fig. 3
(a) KM analysis for duration of treatment response (DoR) in patients with PR (left) or SD (right) at week 6 tumor assessment who are risk stratified using ctDNA levels above or below 1 MTM, in training. (b) KM analysis for PFS in patients with SD or PR at week 6 tumor assessment who are risk stratified using ctDNA levels above or below 1 MTM, in training. (c) Forest plot showing prognostic value of other thresholds of MTM splits at C3D1 timepoint for risk stratification for OS in entire training dataset. Note that here MTM is labeled mean_of_TMPMP (for mean tumor molecules per ml plasma). HRs are comparing patients with MTM level below (‘Less’) versus above (‘Greater’) each threshold for splitting C3D1 MTM, where the number of patients can be found in the third column (‘N’). MST indicates median survival time. Points and error bars indicate HR and 95% confidence interval, respectively. Univariable Cox proportional-hazards model was used to estimate HR and logrank test to report P values. (d) Forest plot showing prognostic value of other ctDNA metrics for OS and PFS in PR and SD patients in training. Note that here MTM is labeled mean_of_TMPMP (for mean tumor molecules per ml plasma). HRs are comparing patients with feature values ≤ versus > than the median value for that feature. RespGrp column indicates whether the subset for the risk stratification analysis is the PR or SD patients. BEP column indicates ‘biomarker evaluable population’, meaning the subset of patients included in the analysis, which is either ‘all’ patients (for features summarizing ctDNA levels), or for patients who are ctDNA positive at the baseline time point (‘BL_ctDNApos’, for features summarizing ctDNA change). Outcome column indicates if the HR is for OS or PFS. MST indicates median survival time. Points and error bars indicate HR and 95% confidence interval, respectively. (e) Four example patient time courses showing longitudinal ctDNA MTM level and tumor size by SLD for 4 example patients.
Extended Data Fig. 4
(a) Scatterplots showing the univariable rank concordance (c-index, x axis) for each individual ctDNA feature for landmarked OS and PFS estimated at each time point (panels), in training. ‘n’ indicates number of detected variants’, ‘n_path’ indicates number of detected known/likely pathogenic variants, ‘percChg’ and ‘diff’ indicate percent change and difference in ctDNA level from baseline. (b) Comparison of models trained using either clinical features alone (red), ctDNA features alone (green), or ctDNA+Clinical features (blue), with annotation as to which metrics were top features in each run. The bar height is rank concordance (c-index) calculated from leave-one-out-cross-validation (LOOCV) to fit an elastic net model, error bars are standard error of the c-index, P values are two-sided and based on a U-statistic to compare two predictors. Models were built using n = 206 patients in the training subset at-risk for an OS event at C3D1. (c) Scatterplots for the 5 top features from C3D1 OS model, showing the association between each feature value with landmark OS. (d) Forest plots showing prognostic value of C3D1 OS ctDNA model predictions in training data for patients with SD (top forest plot) and Partial Response (bottom forest plot), where the number of patients can be found in the third column (‘N’), ‘MST’ indicates median survival time. Points and error bars indicate HR and 95% confidence interval, respectively. Univariable Cox proportional-hazards model was used to estimate HR and logrank test to report P values. Note that the threshold chosen for categorizing a patient as having molecular progressive disease (mPD) was done by taking the mean of the optimal split in SD patients (75th percentile, top forest plot) and the optimal split in PR patients (70th percentile, bottom forest plot). (e) Choosing a threshold in training data of C3D1 OS ctDNA model predictions for categorizing a patient as having mResp was done by identifying the patients in training data who achieved durable OS of ≥ 30 months (which was 32.2% of the population, see top table), and then taking the median prediction score of this population (which was 0.036, see bottom table) in training data.
Extended Data Fig. 5
(a) Scatterplot showing the final C3D1 OS ctDNA model predictions (y axis) versus OS time (x axis) in the hold-back test data for IMpower150 (c-index, 0.67). Dotted lines show thresholds for mPD (≥ 0.298 prediction score), mResp (< 0.036 prediction score), and mSD (for [0.036, 0.298) prediction scores), which were thresholds chosen in the training set of data. (b) KM curves for OS in hold-back test set showing the final subgroups identified using the C3D1 OS model prediction thresholds chosen in training data. Subgroups include mPD (red line), mResp (blue line), and mSD (black line), all confirmed to have prognostic value in this test data. (c) Scatterplot showing the final C3D1 OS ctDNA model predictions (y axis) versus OS time (x axis) in the external validation OAK cohort of 73 patients (c-index, 0.69). Dotted lines show thresholds for mPD (≥ 0.298 prediction score), mResp (< 0.036 prediction score), and mSD (for [0.036, 0.298) prediction scores), which were thresholds chosen in the training set of data. (d) KM curves for OS in external validation OAK cohort of 73 patients showing the final subgroups identified using the C3D1 OS model prediction thresholds chosen in training data. Subgroups include mPD (red line), mResp (blue line), and mSD (black line), all confirmed to have prognostic value in this external validation data.
Extended Data Fig. 6
(a) KM curve showing PFS in the test dataset for the three arms in the IMpower150 trial including ABCP (brown), ACP (orange), and control arm BCP (black, control arm). (bc) Complete results of operation characteristics simulations showing the rate of true ‘Go’ decisions in (b) instantaneous enrollment scenario (every patient has their clinical data cut at their respective C3D1 time point), versus (c) ramp-up enrollment scenario (use all clinical data available for patient after last patient enrolls, so some patients could have additional radiographic data available after the week 6 time point). Training data shown in top rows, test data shown in bottom rows. The early endpoint is either ctDNA criteria alone (red bar), RECIST criteria alone (light blue) or RECIST criteria combined with ctDNA (dark blue), PFS alone (light green bar) or PFS combined with ctDNA criteria (dark green bar).

Comment in

References

    1. Eisenhauer EA, et al. New response evaluation criteria in solid tumours: revised RECIST guideline (version 1.1) Eur. J. Cancer. 2009;45:228–247. doi: 10.1016/j.ejca.2008.10.026. - DOI - PubMed
    1. Fojo AT, Noonan A. Why RECIST works and why it should stay—counterpoint. Cancer Res. 2012;72:5151–5157. doi: 10.1158/0008-5472.CAN-12-0733. - DOI - PubMed
    1. Chiou VL, Burotto M. Pseudoprogression and immune-related response in solid tumors. J. Clin. Oncol. 2015;33:3541–3543. doi: 10.1200/JCO.2015.61.6870. - DOI - PMC - PubMed
    1. Tazdait M, et al. Patterns of responses in metastatic NSCLC during PD-1 or PDL-1 inhibitor therapy: comparison of RECIST 1.1, irRECIST and iRECIST criteria. Eur. J. Cancer. 2018;88:38–47. doi: 10.1016/j.ejca.2017.10.017. - DOI - PubMed
    1. Petrelli F, et al. Surrogate endpoints in immunotherapy trials for solid tumors. Ann. Transl. Med. 2019;7:154–154. doi: 10.21037/atm.2019.03.20. - DOI - PMC - PubMed

Publication types

MeSH terms