. 2023 Mar;29(3):632-645.
doi: 10.1038/s41591-022-02178-3. Epub 2023 Mar 16.

Preclinical models for prediction of immunotherapy outcomes and immune evasion mechanisms in genetically heterogeneous multiple myeloma

Affiliations

Preclinical models for prediction of immunotherapy outcomes and immune evasion mechanisms in genetically heterogeneous multiple myeloma

Marta Larrayoz et al. Nat Med. 2023 Mar.

Abstract

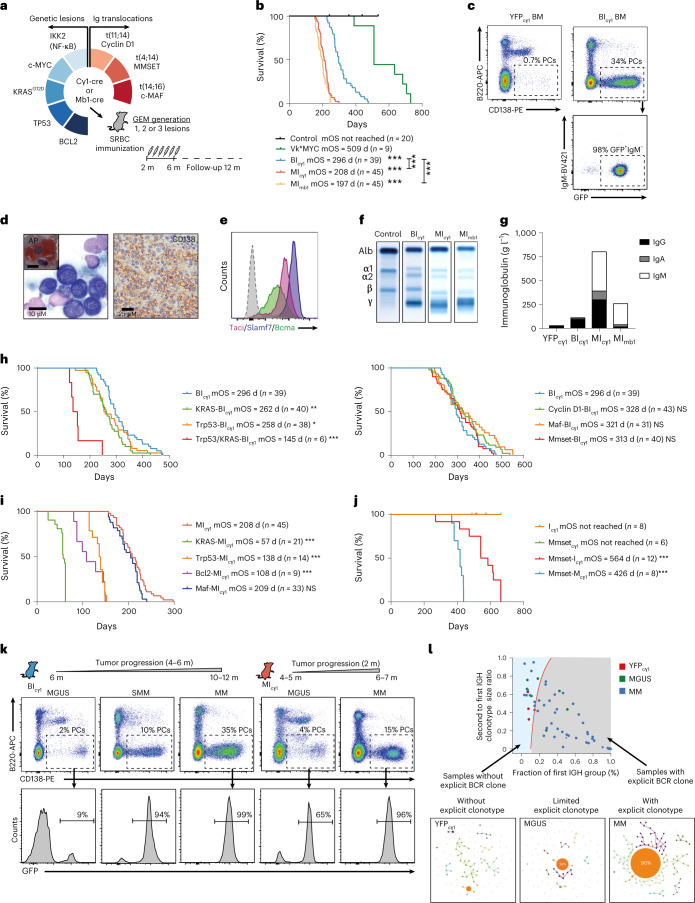
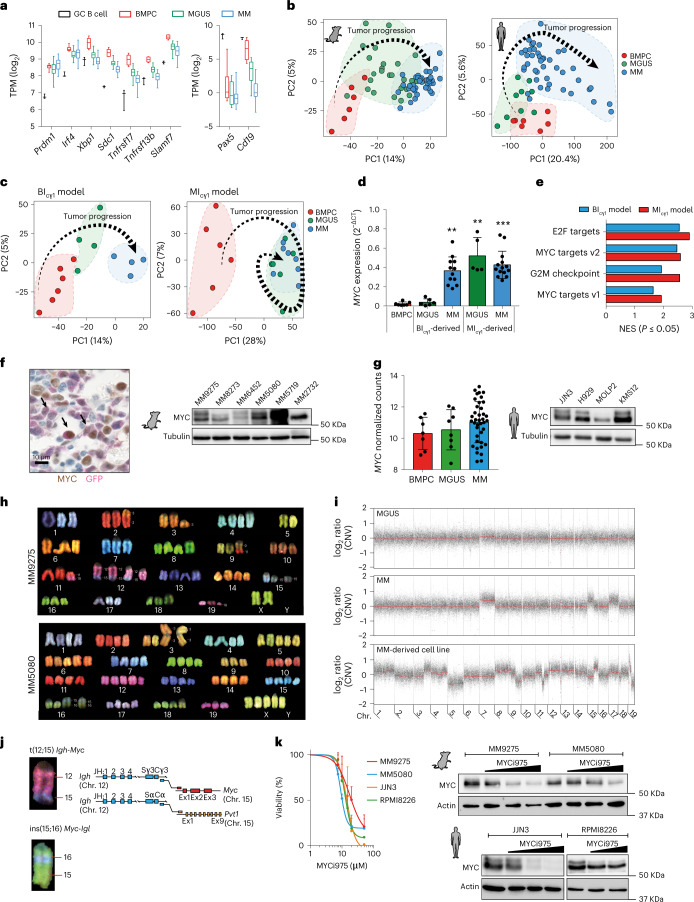
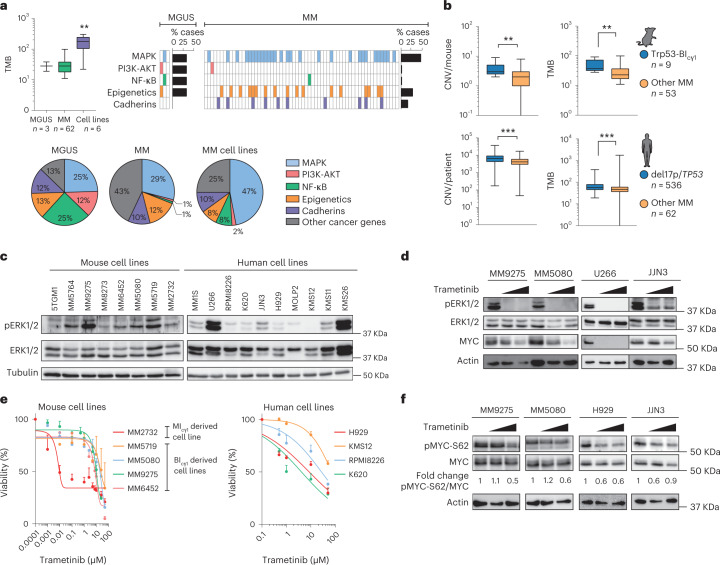
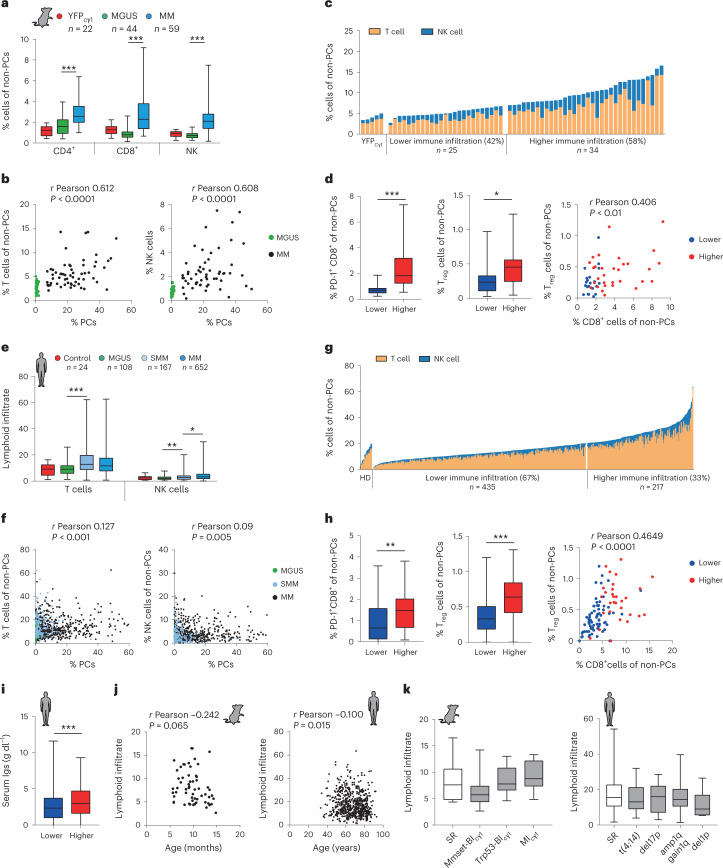
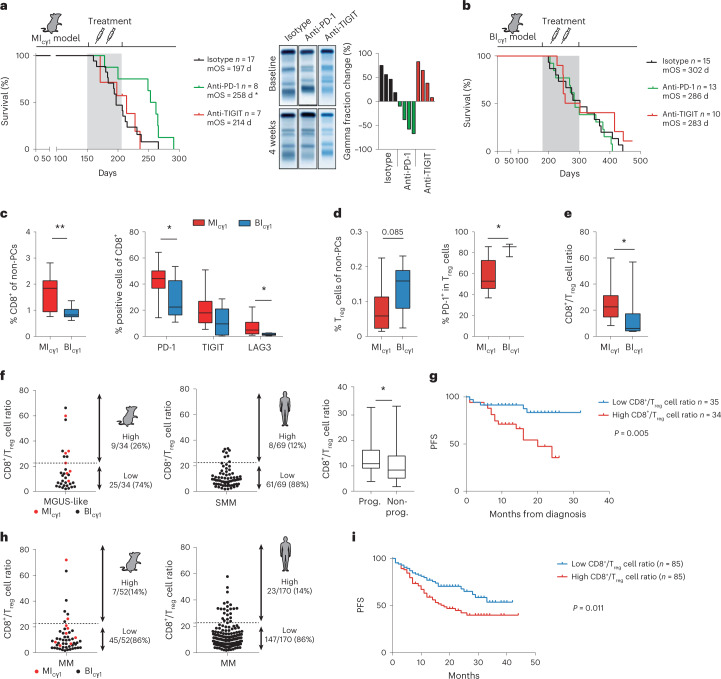
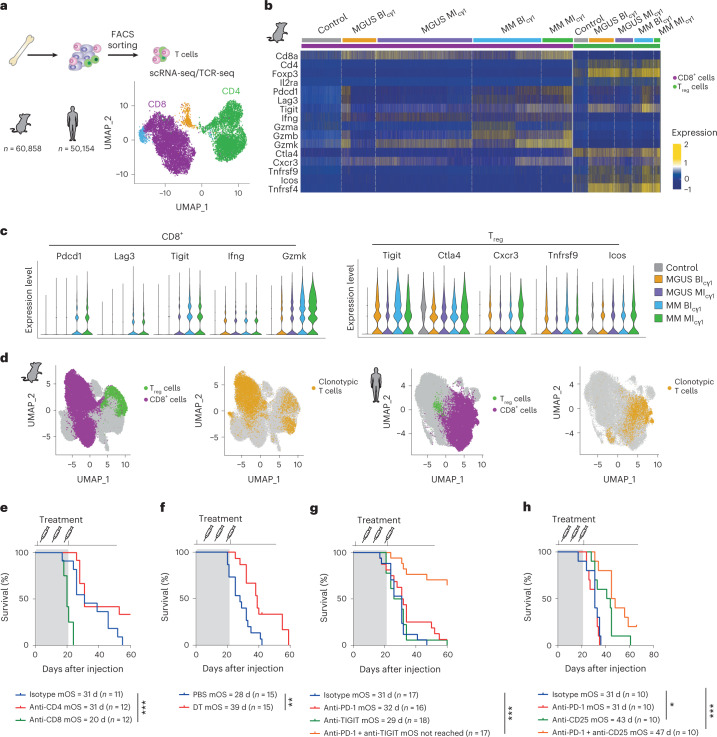
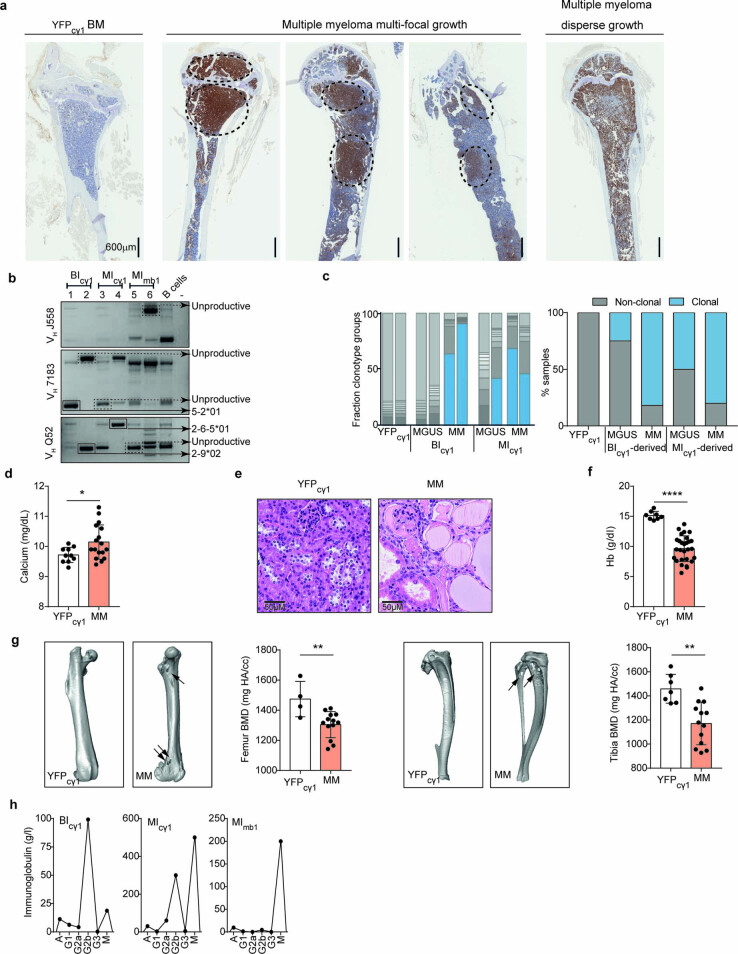
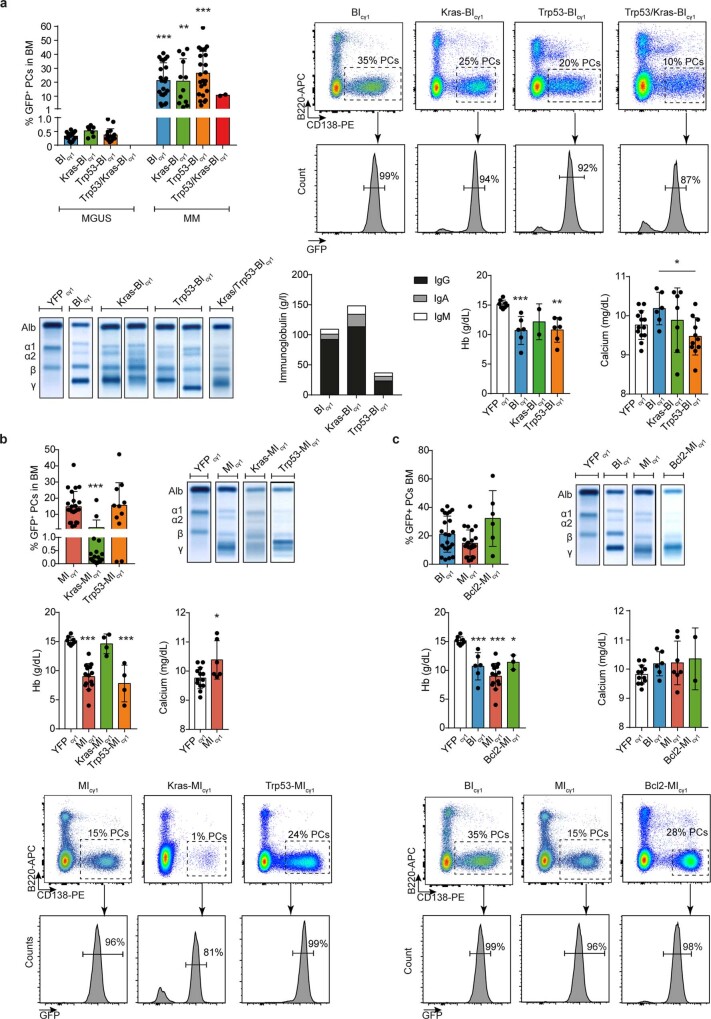
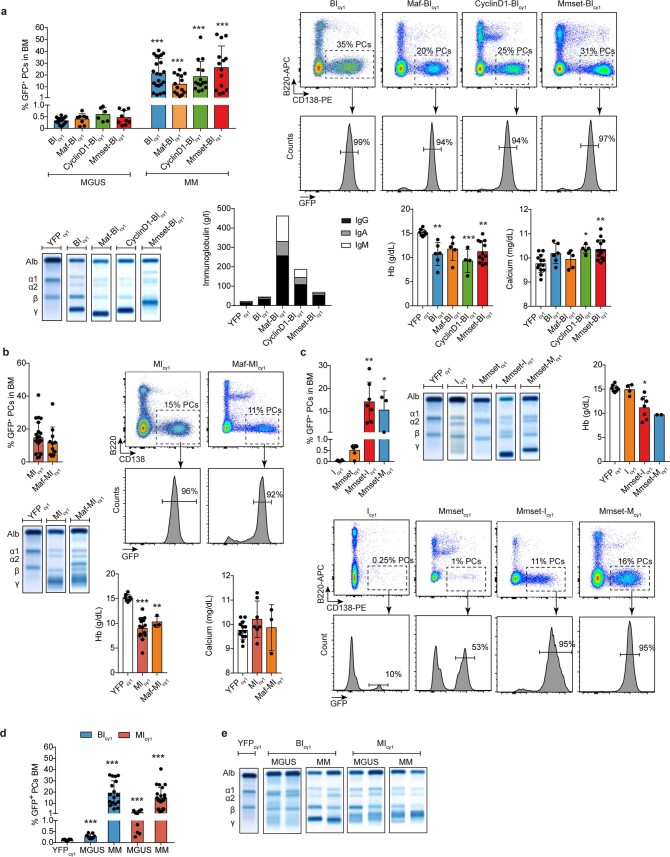
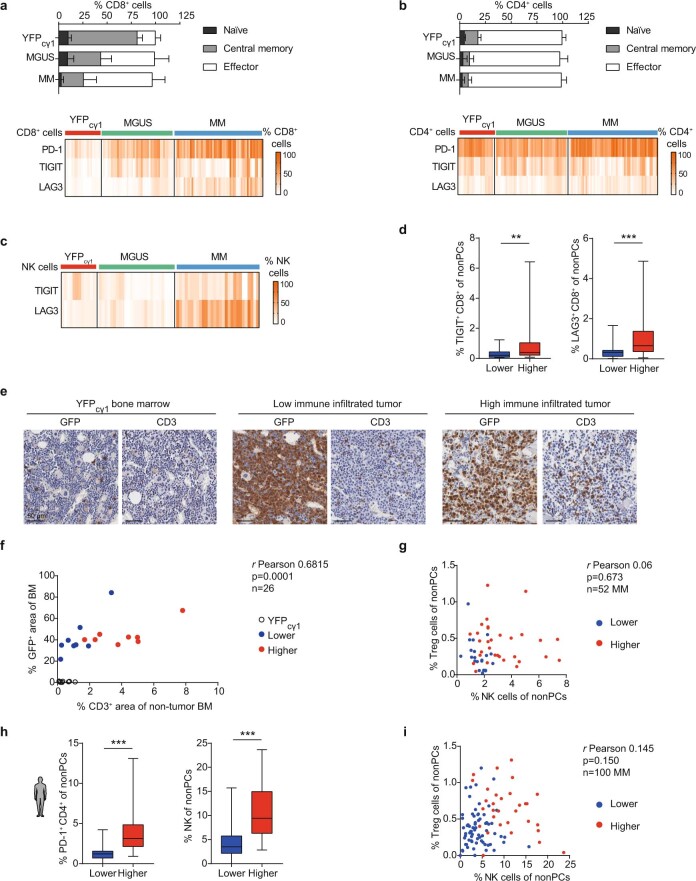
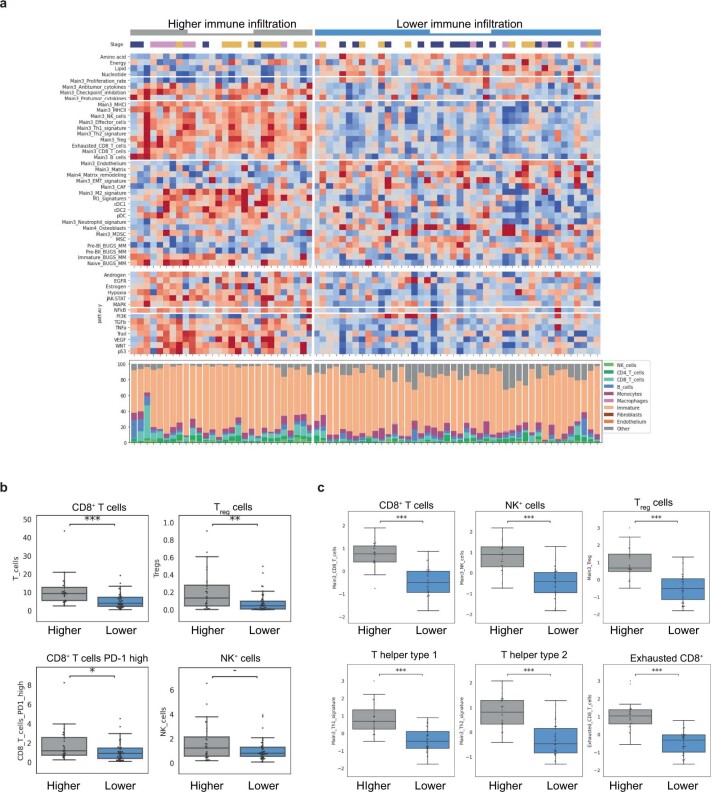
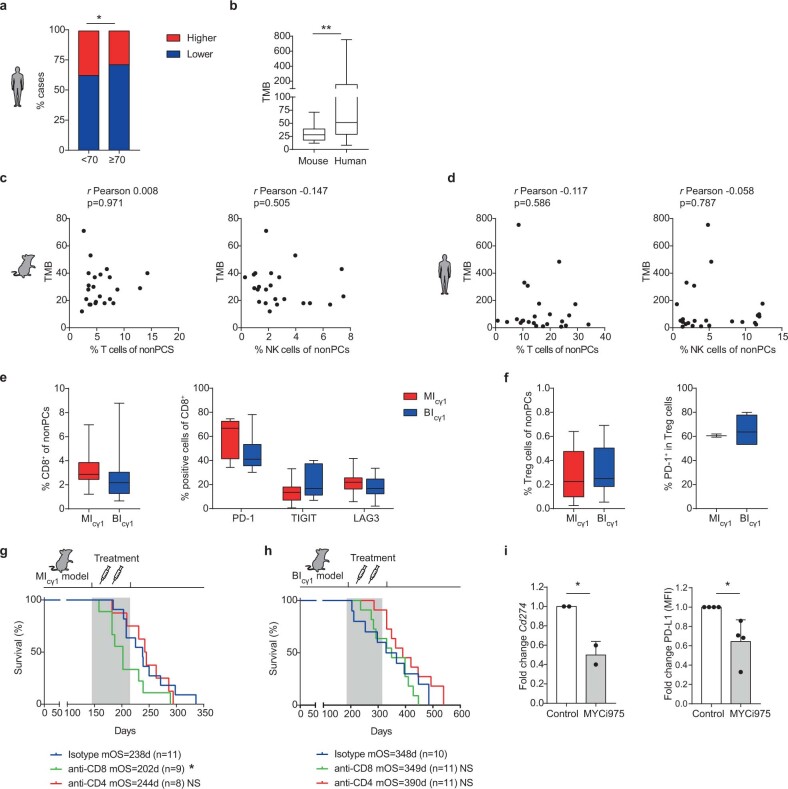
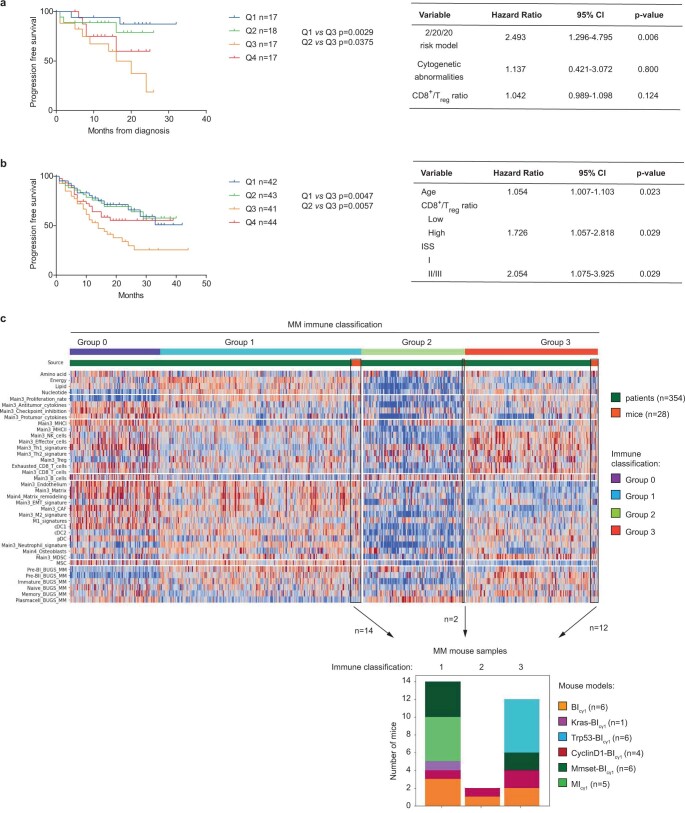
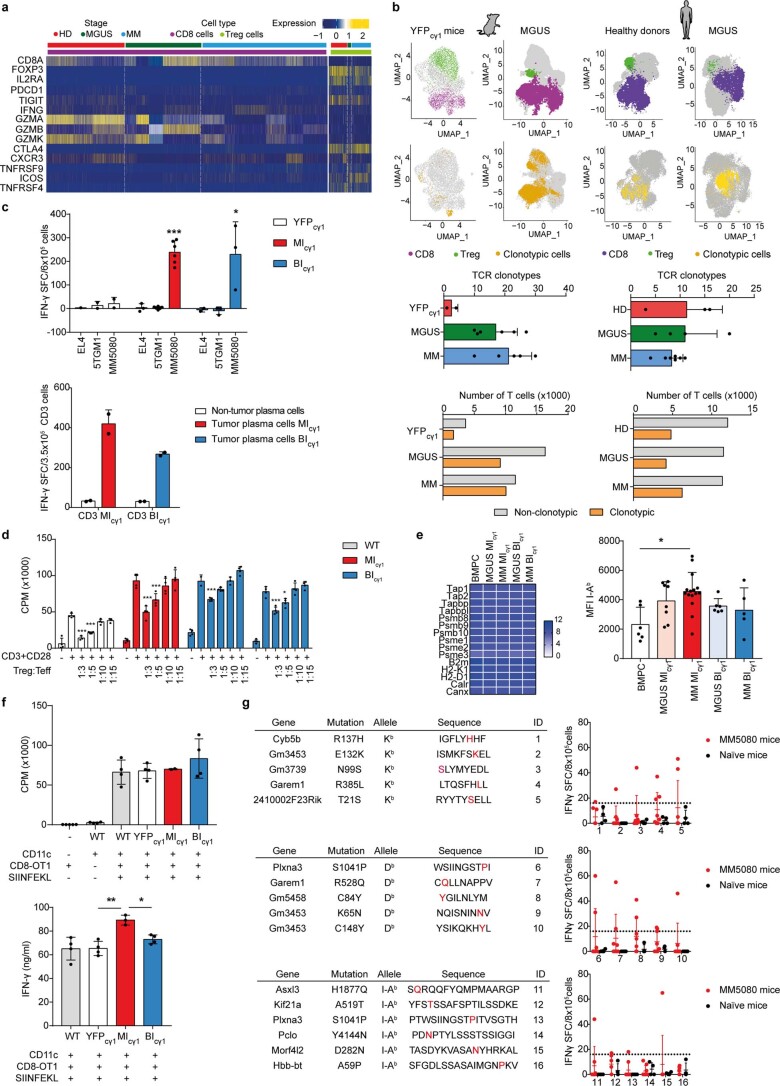
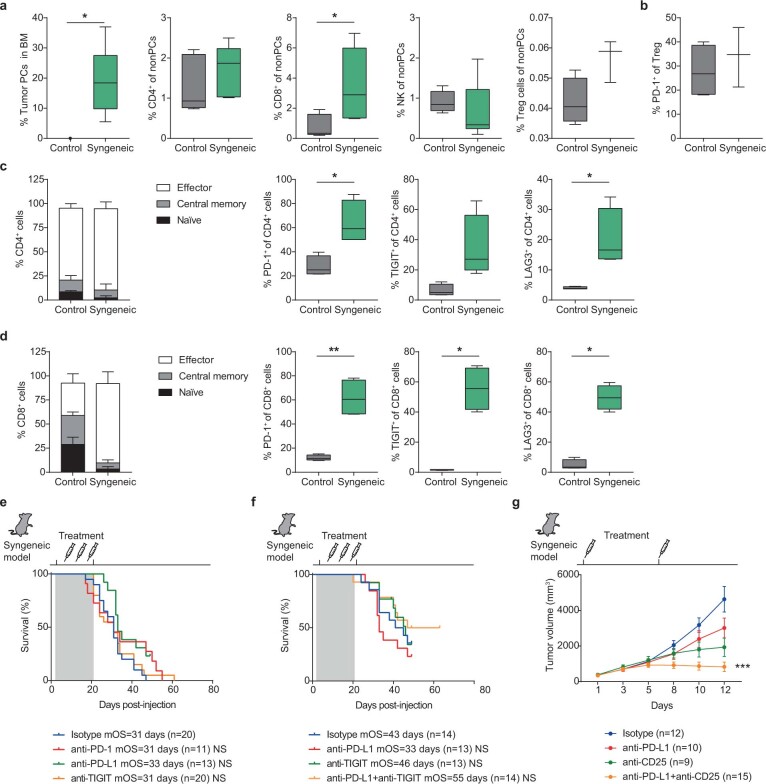
The historical lack of preclinical models reflecting the genetic heterogeneity of multiple myeloma (MM) hampers the advance of therapeutic discoveries. To circumvent this limitation, we screened mice engineered to carry eight MM lesions (NF-κB, KRAS, MYC, TP53, BCL2, cyclin D1, MMSET/NSD2 and c-MAF) combinatorially activated in B lymphocytes following T cell-driven immunization. Fifteen genetically diverse models developed bone marrow (BM) tumors fulfilling MM pathogenesis. Integrative analyses of ∼500 mice and ∼1,000 patients revealed a common MAPK-MYC genetic pathway that accelerated time to progression from precursor states across genetically heterogeneous MM. MYC-dependent time to progression conditioned immune evasion mechanisms that remodeled the BM microenvironment differently. Rapid MYC-driven progressors exhibited a high number of activated/exhausted CD8+ T cells with reduced immunosuppressive regulatory T (Treg) cells, while late MYC acquisition in slow progressors was associated with lower CD8+ T cell infiltration and more abundant Treg cells. Single-cell transcriptomics and functional assays defined a high ratio of CD8+ T cells versus Treg cells as a predictor of response to immune checkpoint blockade (ICB). In clinical series, high CD8+ T/Treg cell ratios underlie early progression in untreated smoldering MM, and correlated with early relapse in newly diagnosed patients with MM under Len/Dex therapy. In ICB-refractory MM models, increasing CD8+ T cell cytotoxicity or depleting Treg cells reversed immunotherapy resistance and yielded prolonged MM control. Our experimental models enable the correlation of MM genetic and immunological traits with preclinical therapy responses, which may inform the next-generation immunotherapy trials.


Conflict of interest statement

M.C. has received honoraria from participation in advisory boards from Oncopeptides, Novartis, Janssen and Pfizer; and has licensed intellectual property through Mayo Clinical Ventures 2013-058 ‘Genetically engineered mouse model of MM without LoxP sites (Vk*MycCwoLoxP) and transplantable cell lines’. L.B. has received honoraria from participation in advisory boards from Oncopeptides, Novartis, Janssen and Pfizer; and has licensed intellectual property through Mayo Clinical Ventures 2013-058 ‘Genetically engineered mouse model of MM without LoxP sites (Vk*MycCwoLoxP) and transplantable cell lines’. P.R.-O. has received honoraria from advisory boards from Pfizer, BMS, Janssen, GSK, Kite, Sanofi and Oncopeptides; and honoraria from lectures from GSK, Janssen, BMS, Regeneron, Amgen and Oncopeptides. S.M.R. is an employee of Roche/Genentech. E.A.L. is an employee of Roche/Genentech. M.A. is an employee of Roche, and has patent applications on CD25 monoclonal antibody with relevance to this work: WO/2018/167104 and US20190284287 (filed by Cancer Research Technology Limited and Tusk Therapeutics). M.A. has shares in the companies to which the patent belongs. O.K. is an employee of BostonGene. J.S.M. is a consultant and an advisory board member for (on behalf of his Institution) Amgen, BMS, Celgene, Haemalogix, Janssen, MSD, Novartis, Takeda, Sanofi, Roche, Abbvie, GlaxoSmithKline, Regeneron, SecuraBio and Karyopharm. B.P. reports honoraria for lectures from and membership on advisory boards with Adaptive, Amgen, Becton Dickinson, Bristol Myers Squibb-Celgene, Janssen, Merck, Novartis, Roche, Sanofi and Takeda; unrestricted grants from Bristol Myers Squibb-Celgene, EngMab, Roche, Sanofi and Takeda; and consultancy for Bristol Myers Squibb-Celgene, Janssen, Sanofi and Takeda. J.A.M.-C. reports funding for research from Roche/Genentech, Bristol Myers Squibb-Celgene, Janssen, Priothera and Palleon. A patent on the generation and use of the mouse MM models as immunotherapy platforms, entitled ‘Genetically engineered animal models for multiple myeloma’ (application no. EP22382736.1) was filed on 27 July 2022. The remaining authors declare no competing interests.

Figures

Fig. 1
Fig. 1. Genetically heterogeneous mouse models of human-like multiple myeloma.
a, Schematic of the genetic screen strategy, whereby transgenic mice were crossed with cγ1-cre or mb1-cre mice. Among 31 genetically heterogeneous mouse lines generated, MImb1, MIcγ1 and BIcγ1 strains developed MM. GEM, genetically engineered mice; m, months. b, Kaplan–Meier OS curves of MImb1, MIcγ1, BIcγ1, control (YFPcγ1 and YFPmb1) and Vk*MYC mice. c, Representative flow cytometry analysis in the BM of BIcγ1 mice at the time of death, which shows an increased number of GFP+CD138+B220sIgM MM cells. d, Giemsa staining of a representative BM sample in BIcγ1 mice revealed human-like PCs with expression of acid phosphatase (AP; left). On the right, immunohistochemical examination in BIcγ1 mice revealed CD138 surface expression by MM cells. e, MM cells show increased surface expression of Bcma, Slamf7 and Taci according to flow cytometry analyses. f, Representative electrophoresis of immunoglobulin secretion in serum samples from MImb1, MIcγ1 and BIcγ1 mice shows M spikes corresponding to the gamma fraction. g, Quantification of immunoglobulin isotypes in serum samples by ELISA in MImb1 (n = 3), MIcγ1 (n = 2), BIcγ1 (n = 4) and YFPcγ1 control (n = 9) mice. h, Kaplan–Meier survival curves of mouse lines that develop MM derived from the BIcγ1 strain with additional KRASG12D mutation, heterozygous Trp53 deletion, or expression of cyclin D1, c-MAF or MMSET. i, Kaplan–Meier survival curves of mouse lines that develop MM derived from MIcγ1 mice with additional KRASG12D mutation, heterozygous Trp53 deletion, c-MAF expression or BCL2 expression. j, Kaplan–Meier survival curves in mice with MMSET/NSD2 expression crossed with lines carrying either IKK2NF-κB activation or c-MYC expression, which developed MM at old ages. k, Flow cytometry analyses in BIcγ1 and MIcγ1 mice revealed that precursor states precede clinically evident MM in genetically heterogeneous mice. l, Analysis of Igh clonality according to RNA-seq of immunoglobulin gene loci and classification by the presence of explicit clonotypes for each sample. B cell receptor (BCR) repertoires and the most expanded clone groups in control, MGUS and MM samples. Log-rank (Mantel–Cox) test was used. *P < 0.05; **P < 0.01; ***P < 0.001; NS, not significant. Source data
Fig. 2
Fig. 2. Transcriptional and genomic profiling of multiple myeloma in mice.
a, RNA-seq analyses of typical PC and B cell genes in PCs from mice at MGUS (n = 25) and MM (n = 40) stages versus control BM PCs (n = 6) and GC B cells (n = 3). TPM, transcripts per million. Boxes represent the median, upper and lower quartiles and whiskers represent minimum to maximum range. b, PCA of RNA-seq data from mouse and human MGUS and MM cells compared with control BM PCs. Human PCs were obtained from patients with newly diagnosed MGUS (n = 9) and MM (n = 41), and from BM aspirates from healthy donors (n = 7). c, PCA of RNA-seq data from BIcγ1 and MIcγ1 mice revealed two transcriptional modes of evolution during MM development. d, Quantitative PCR with reverse transcription (RT–qPCR) of mouse and human MYC gene expression in isolated BM PCs (n = 7), MGUS (n = 6) and MM (n = 12) cells from BIcγ1-derived and MGUS (n = 5) and MM (n = 14) cells from MIcγ1-derived mice. The mean and s.d. are represented. Kruskal–Wallis test P values adjusted for multiple comparisons by Dunn’s test are indicated. e, GSEA of RNA-seq data shows ‘MYC target genes’ at the top of the MM hallmarks in BIcγ1-related and MIcγ1 mice. NES, normalized enrichment score. f, Immunohistochemical image of BM sections revealed nuclear MYC protein expression in GFP+ MM cells from BIcγ1 mice (left). Western blot analysis revealed MYC expression in mouse MM-derived cell lines (right). g, MYC expression from RNA-seq data in samples from patients with MGUS (n = 8) or MM (n = 39) and in BM PCs (n = 7) from healthy donors. The mean ± s.d. is represented. Western blot analysis of MYC protein expression in human MM cell lines (right). h, Representative examples of spectral karyotyping analysis in metaphase cells from two MM-derived cell lines. i, Copy number variation and WES analyses of primary cells from mice with MGUS and MM and in an MM-derived cell line. j, WGS mapped the breakpoints in two chromosomal translocations between the Igh or Igl and MYC genes in MM9275 and MM5080 cell lines, respectively. k, MYC targeting with the MYC inhibitor MYCi975 reduced MYC expression (right) and decreased MM cell viability (left) in mouse and human MM cells. Data corresponding to the mean ± s.e.m. from two or three independent experiments are represented for each cell line. *P < 0.05; **P < 0.01; ***P < 0.001. Source data
Fig. 3
Fig. 3. A common MAPK–MYC axis dictates multiple myeloma progression.
a, Quantification of the TMB, which corresponds to the total number of somatic mutations per tumor, according to WES analysis (left). Distribution of mutations in genes within signaling and cancer-related pathways in MM (n = 62) and MGUS (n = 3) primary samples, and in MM-derived cell lines (n = 6). Kruskal–Wallis test P values adjusted for multiple comparisons by Dunn’s test are indicated. b, Quantification of copy number variation and TMB according to WES data from MM cells from Trp53-BIcγ1 mice compared with the remaining strains, and in MM patients from the CoMMpass study with and without 17p/TP53 deletion and/or TP53 somatic mutations. Mann–Whitney test two-tailed P values are indicated. c, Western blot analyses revealed ERK phosphorylation in mouse and human MM cell lines. The mouse cell line 5TGM1 was included as a positive control. d, The MEK inhibitor trametinib induced a dose-dependent reduction in ERK phosphorylation in mouse and human MM-derived cell lines. e, Dose-dependent decrease in viability of mouse and human MM cell lines following trametinib treatment. Data corresponding to the mean ± s.e.m. from two to ten independent experiments are represented for each cell line. f, Reduced phosphorylation of MYC at S62 (pMYC-S62) following treatment with trametinib in mouse and human MM cell lines. Quantification of the fold change in expression levels of pMYC-S62 with respect to total MYC protein is shown. Boxes represent the median, upper and lower quartiles and whiskers represent minimum to maximum range (a and b). **P < 0.01; ***P < 0.001. Source data
Fig. 4
Fig. 4. Immune features of multiple myeloma progression.
a, Distribution of lymphoid cell subpopulations in the BM of mice with MGUS and MM, and in control mice. b, Two-tailed Pearson correlation analyses between the number of BM PCs in mice at MGUS and MM states with T cells or NK cells in the BM. c, Classification of MM samples into categories according to the abundance of T and NK lymphoid cells in the BM with respect to that in healthy mice. d, MM cases with higher number of infiltrating immune cells contained more tumor-reactive PD-1+CD8+ T cells and Treg cells. Two-tailed Pearson correlation analysis between CD8+ T cells and Treg cells in the BM (right). e, Characterization of the BM lymphoid cell composition by flow cytometry in BM samples from patients with MGUS, SMM and MM. f, Two-tailed Pearson correlation analyses between the percentage of PCs in the BM from MM patients and the percentage of T or NK cells in the BM. g, Classification of MM patients (n = 652) into those with lower and higher number of immune cells in the BM microenvironment with respect to healthy donors (HDs; n = 24). h, Tumors with high immune infiltrates contained more tumor-reactive PD-1+ CD8+ T cells and Treg cells in the BM compared with MM cases with a lower number of immune cells. Two-tailed Pearson correlation analysis between the percentages of CD8+ T cells in BM and the percentage of Treg cells (right). i, MM cases with more abundant immune cells had increased immunoglobulin secretion with respect to the remaining cases. j, Two-tailed Pearson correlation analyses between the T and NK lymphoid cell infiltrate in BM from mice (n = 59) and humans with MM (n = 638) and the age. k, Quantification of the BM lymphoid infiltrates including CD4+, CD8+ and NK cells across genetic subgroups of mouse and human MM. Boxes represent the median, upper and lower quartiles and whiskers represent minimum to maximum range (a, d, e, h, i and k). Kruskal–Wallis test P values adjusted for multiple comparisons by Dunn’s test (a, b and k) and Mann–Whitney test P values (d, h and i) are indicated. *P < 0.05; **P < 0.01; ***P < 0.001. Source data
Fig. 5
Fig. 5. Immunotherapy responses in multiple myeloma.
a, Preclinical immunotherapy trial in MIcγ1 mice testing anti-PD-1 or anti-TIGIT monoclonal antibodies with respect to isotype-treated mice. Kaplan–Meier OS curves and mOS values are shown. b, Preclinical immunotherapy trial in BIcγ1 mice testing anti-PD-1 or anti-TIGIT monoclonal antibodies with respect to isotype-treated mice. Kaplan–Meier OS curves and mOS values are shown. c, MIcγ1 mice (n = 10) exhibited higher numbers of activated PD-1+, TIGIT+ and LAG3+ CD8+ T lymphocytes in the BM compared with BIcγ1 mice (n = 9). d, The number of PD-1+ Treg cells in the BM of MIcγ1 mice (n = 9) was lower than in BIcγ1 mice (n = 9) at MGUS stages. e, The ratio of CD8+ T cells to Treg cells in the BM microenvironment was higher in MIcγ1 mice (n = 8) than in BIcγ1 mice (n = 9; median value, 22.5 versus 6.1; P = 0.019). f, Representation of the CD8+ T/Treg cell ratio in BM samples from mouse MM and from patients with SMM. Median value of CD8+ T/Treg cell ratios in SMM patients with progression versus those without progression at 2 years from diagnosis (P < 0.05; right). g, Kaplan–Meier PFS curve for patients with untreated SMM (n = 69). A high CD8+ T/Treg cell ratio was associated with shorter time to progression with respect to the remaining cases (median PFS at 2 years, 38% versus 88%; P = 0.005). h, In 170 newly diagnosed individuals with clinically active MM, 23 (14%) exhibited a high CD8+ T/Treg cell ratio, while the remaining patients (86%) showed lower CD8+ T/Treg cell ratios. i, Kaplan–Meier PFS curve for 170 MM patients aged >70 years treated with lenalidomide and dexamethasone in the GEM-CLARIDEX clinical trial (NCT02575144). The presence of a high BM CD8+ T/Treg cell ratio was associated with a higher rate of progression in comparison with those cases with low values (PFS, 18 months versus not reached; P = 0.011). Boxes represent the median, upper and lower quartiles and whiskers represent minimum to maximum range (cf). Unpaired two-tailed Student’s t-test or Mann–Whitney test P values (cf) are indicated. Log-rank (Mantel–Cox) test was used in a, b, g and i. *P < 0.05; **P < 0.01; ***P < 0.001.
Fig. 6
Fig. 6. Modulating CD8+ T/Treg cell ratio enhances immunotherapy outcomes.
a, scRNA-seq/TCR-seq analyses of 60,858 CD3+ T cells isolated from the BM of MIcγ1 and BIcγ1 mice, and from YFPcγ1 controls. Three mice from each subgroup at MGUS and MM states were included. In patients, scRNA-seq/TCR-seq analyses of 50,154 CD3+ T cells isolated from the BM of newly diagnosed MM (n = 7) and MGUS (n = 4), and from the BM of healthy adults (n = 6), were performed. b, Differential expression of genes in CD8+ T cells and CD4+CD25+Foxp3+ Treg cells are shown across MM progression. c, Quantification of the expression of selected markers in CD8+ T cells in MIcγ1 and BIcγ1 mice at different disease states (left). Quantification of the expression of markers in CD4+CD25+Foxp3+ T cells in MIcγ1 and BIcγ1 mice and in MM patients at MGUS and MM stages (right). d, Uniform manifold approximation and projection (UMAP) plots of single-cell transcriptomic and TCR genomic profiles from CD8+ T cells and Treg cells in mice and patients at MM states are shown. In mice and humans, cells with a clonotypic TCR were identified preferentially among the CD8+ T cell subset. e, In vivo depletion of CD4+ or CD8+ T cells in the MM5080 syngeneic transplantation model is shown. The Kaplan–Meier OS curve included two experiments. The mOS and the number of mice in each treatment cohort are shown. f, In vivo genetic depletion of Treg cells in Foxp3-GFP-DTR mice with transplanted MM5080 cells. The mOS and the number of mice in each treatment cohort are shown. g, Enhancing CD8+ T cell cytotoxicity by TIGIT co-inhibition dictates anti-PD-1 responses. The mOS and the number of mice in each treatment cohort are shown. h, Depletion of Treg cells with a mouse anti-CD25 monoclonal antibody delayed MM onset and increased anti-PD-1 responses. The mOS and the number of mice in each treatment cohort are shown. Log-rank (Mantel–Cox) test was used. *P < 0.05; **P < 0.01; ***P < 0.001.
Extended Data Fig. 1
Extended Data Fig. 1. Characterization of multiple myeloma in genetically engineered mice.
a) Immunohistochemical analysis of bone sections using GFP staining to visualize the GFP+ MM cells within the BM (excluding by-stander GFP-negative PCs). Two MIcγ1 mice, two BIcγ1 mice and one YFPcγ1 control mice were characterized. A multifocal growth of MM is observed in three of the four examined mice, including focal lesions in the BM. b) Examination of tumor clonality by genomic PCR and sequencing revealed clonal IghV gene rearrangements in DNA isolated from BM PCs from two MImb1, two MIcγ1 and two BIcγ1 mice. As negative control, splenic B220+ B cells from a YFPcγ1 mouse were included. c) Representation of the fraction clonotype groups according to the tumor IghV gene clonality in two samples from BIcγ1 and MIcγ1 mice at MGUS and MM states, shown on the left. The percentage of samples with clonal and non-clonal IghV genes in BIcγ1-derived and MIcγ1-derived strains at MGUS and MM states is shown on the right. Representation of CRAB features in MImb1, MIcγ1, and BIcγ1 mice (n = 17-28), including hypercalcemia (d), renal disease due to Ig light-chain deposits in tubules (e), anemia (f), and bone disease (g). In g), presentative images of micro-computed tomography (micro-CT) performed in the bones of mice with MM are shown, which detected osteolytic lesions (marked with arrows) in femur (left) and tibia and fibula (right) in BIcγ1 and MIcγ1 mice, respectively. As controls, YFPcγ1 mice were characterized, which did not show bone lesions. In addition, quantification of bone density from micro-CT images was performed in 13 mice from different genotypes at the MM stage, which showed global decrease of bone mineral density (BMD) in femur (left) and tibia (right) with respect to controls(n = 4-7). Bars represent mean ± s.d. Unpaired two-tailed t Student test or Mann-Whitney test P values (d, f and g) are indicated. h) Representative examples of individual mice showing the quantification of Ig isotypes in serum samples by ELISA. *p < 0.05; **p < 0.01; ***p < 0.001; NS, non-significant.
Extended Data Fig. 2
Extended Data Fig. 2. Characterization of BIcγ1 and MIcγ1 models with additional genetic lessions.
MM development in BIcγ1 (a) and MIcγ1 (b) strains carrying an additional KRASG12D mutation or heterogeneous deletion of Trp53 (complementary to Fig. 1h–i). In c), characterization of MM development in MIcγ1 mice with additional expression of BCL2 (Bcl2-MIcγ1 mice) (complementary to Fig. 1i). Data is depicted as mean ± s.d. P values are obtained using one-way ANOVA test followed by Tukey’s multiple comparison test (a, b and c), Kruskal-Wallis adjusted for multiple comparisons by Dunn’s test (b and c), unpaired t test (a and b) and Mann-Whitney test (a). Source data
Extended Data Fig. 3
Extended Data Fig. 3. Characterization of BIcγ1 and MIcγ1 mice with additional immunoglobulin chromosomal translocations.
MM development in BIcγ1 (a) and MIcγ1 (b) mice carrying immunoglobulin chromosomal translocations (complementary to Fig. 1h-i). c) Characterization of MM development in mice with t(4;14) crossed with lines carrying IKK2NF-κB activation or MYC expression (complementary to Fig. 1j). d) Quantification of GFP+CD138+B220sIgM PCs by flow cytometry in the BM of BIcγ1 and MIcγ1 mice at MGUS and MM states, and in YFPcγ1 control mice at 6 months of age, are shown (complementary to Fig. 1k). e) Representative electrophoresis analyses of immunoglobulin secretion in serum samples from BIcγ1 and MIcγ1 mice at MGUS and MM states, and in YFPcγ1 control mice, are shown. Data is depicted as mean ± s.d.. P values are obtained using one-way ANOVA test followed by Tukey’s multiple comparison test (a and b), Kruskal-Wallis adjusted for multiple comparisons by Dunn’s test (c and d), unpaired t test (a) and Mann-Whitney test (a and b). Source data
Extended Data Fig. 4
Extended Data Fig. 4. Immunological characteristics of genetically engineered mice with multiple myeloma.
a) Stage of CD8+ T cells (a) and CD4+ T cells (b) during MGUS (n = 8) and MM (n = 27) progression in mice. Controls corresponded to YFPcγ1 mice (n = 3). Phenotype of exhaustion markers in CD8+ T cells (a) and in CD4+ T cells (b) during MGUS (n = 24) and MM (n = 43) compared with control age-matched mice (n = 17) (complementary to Fig. 4a). Mean ±s.d. are represented. c) Percentage of NK cells with TIGIT and LAG3 expression in BM in YFPcγ1 control mice (n = 4) and in mice with MGUS (n = 6) and MM (n = 26) (complementary to Fig. 4a). d) Tumors with higher number of immune cells (n = 27-34) in the BM contained an increased number of tumor-reactive CD8+ T cells that expressed TIGIT, and LAG3, in contrast to those cases with lower immune infiltrates (n = 22-25) (complementary to Fig. 4d). e) Immunohistochemical studies using antibodies to detect GFP+ transgenic MM cells or CD3+ T lymphocytes in BM sections from YFPcγ1 control mice, BIcγ1 mice and MIcγ1 mice. f) Representation of the percentage (%) of the area in a region of interest in the BM that is occupied by CD3+ T cells with respect to non-GFP+ MM cells. Samples from YFPcγ1 control mice (n = 2), BIcγ1 mice (n = 2) and MIcγ1 mice (n = 2) were included. g) Pearson correlation analyses between the percentages of NK cells in the mouse BM and those of Treg cells in the BM (complementary to Fig. 4d). h) In MM patients, tumors with more abundant infiltrating immune cells (n = 31) contained an increased number of tumor-reactive PD-1+ CD4+ T cells and NK cells in the BM compared with MM cases with lower number of immune cells (n = 69) (complementary to Fig. 4g). i) Pearson correlation analyses between the percentages of NK cells in the BM of MM patients and those of Treg cells in the BM (complementary to Fig. 4h). Boxes represent median, upper and lower quartiles and whiskers represent minimum to maximum range (d and h). Two-tailed Mann-Whitney test P values (d and h) are indicated. **p < 0.01; ***p < 0.001.
Extended Data Fig. 5
Extended Data Fig. 5. Bio-informatic deconvolution of RNAseq data.
Bio-informatic deconvolution of RNA-seq data was applied to a previously reported clinical series of 72 newly diagnosed MM patients (GSE104171), which allowed the definition of the cellular composition of the BM microenvironment,. a) These studies confirmed the presence of the MM immunological subgroups, which divided the patients into two immune categories according to the abundance of immune cells in the BM. b) In this clinical series, patients with abundant immune cells MM (28 cases, 39%) presented higher number of PD-1+CD8+ T cells and Treg cells with respect to those patients with low-infiltrating MM cases (44 cases, 61%). c) In addition, the transcriptomic signatures corresponding to CD8+ T cells, Treg cells, NK cells and Thelper type 1 and type 2 cells were increased in the cases with higher number of immune cells with respect to those with less abundant T and NK cells.
Extended Data Fig. 6
Extended Data Fig. 6. Immunological characterization of genetically heterogeneous mouse and human multiple myeloma.
a) MM with lower frequency of immune cells was more common in patients older than 70 years. Fisher’s exact test. b) Measurement of the tumor mutation burden in MM samples from mice (n = 23) and patients (n = 24) according to whole-exome sequencing (WES) studies of somatic mutations. Pearson correlation studies of the TMB quantified and the T and NK cells infiltrating the BM in mouse MM (c) and human MM (d); MGUS and SMM cases were not included in these correlations. e) Comparison of the BM immune phenotypes including the number of activated PD-1+, TIGIT+, and LAG3+ CD8+ T lymphocytes at MM stages in MIcγ1 (n = 13) vs. BIcγ1 (n = 13) mice (complementary to Fig. 5c). f) Comparison of the number of PD-1+ Treg cells in the BM of MIcγ1 (n = 3) mice and in BIcγ1 (n = 5) mice (complementary to Fig. 5c). g-h) Kaplan-Meier survival curves in MIcγ1 mice and BIcγ1 mice undergoing depletion of CD4+ and CD8+ T cells. Monoclonal antibodies were administered by i.p. injection when MIcγ1 and BIcγ1 mice were 4.5 and 6 months of age, respectively. Mice received 100 µg of anti-CD4, anti-CD8, or rat IgG control antibodies, administered on days +1, +4, and +8 and then weekly for 8 weeks. Median overall survival, mOS. The number of mice included on each cohort is represented. i) Pharmacological inhibition of MYC repressed Cd274/PD-L1 expression at transcriptional and protein levels in the MM2732 cell line established from the Trp53-MIcγ1 model. Mean and s.d. of 2-4 independent experiments are shown. Boxes represent median, upper and lower quartiles and whiskers represent minimum to maximum range (b, e and f). Two-tailed t test or Mann-Whitney test P values (b, e, f and i) are indicated. Log-rank (Mantel-Cox) test was used in g and h. *p < 0.05; **p < 0.01; NS, non-significant.
Extended Data Fig. 7
Extended Data Fig. 7. Immunological characteristics of mouse and human multiple myeloma.
a) Kaplan-Meier progression-free survival (PFS) curves in the four quartiles, and Cox regression analysis of SMM patients (n = 69). b) Kaplan-Meier PFS curves in the four quartiles, and Cox regression analysis of newly diagnosed MM patients (n = 170). c) Bulk RNA-seq and microarray data analyses in mouse and human MM. The composition of the BM microenvironment was investigated in MM mouse samples with different genotypes (n = 28) and in data from the study of MM patient samples (n = 354) by applying bio-informatic reconstruction of the tissue microenvironment (TME) according to RNA-microarray and RNA-seq data from BM samples,,. According to the composition of the BM immune microenvironment, patient samples were divided into four immune categories (group 0, group 1, group 2 and group 3). Integrative studies of the TME in mouse and human MM revealed that the MM in mice was classified into groups 1, 2 and 3, but not into group 0. Thus, the TME of in the mouse models of MM represents the TME of 307 of 354 human MM samples (87%). Log-rank (Mantel-Cox) test was used in a and b.
Extended Data Fig. 8
Extended Data Fig. 8. Functional evaluation of immunological features in mouse models of multiple myeloma.
a) Differential expression of genes in BM CD8+ T cells and CD4+CD25+Foxp3+ Treg cells in MGUS and MM patients and healthy donor BM samples. b) UMAP plots of scRNA/TCR-seq data showing the cells with a clonotypic TCR among CD8+ T cells and CD4+CD25+Foxp3+ Treg cells in mice (n = 6) and patients (n = 4) at MGUS states, and in the BM of YFPcγ1 mice (n = 2) and healthy donors (n = 6) (complementary to Fig. 6d). At the bottom, the number of TCR clonotypes and the distribution of non-clonotypic and clonotypic T cells according to the TCR examination in mouse and human samples are shown. c) Specific recognition of MM cells by BM T lymphocytes. T cells from MIcγ1 (n = 6), BIcγ1 (n = 3) and YFPcγ1 (n = 2) mice were co-cultured with EL4, 5TGM1 and MM5080 cell lines (top). Additionally, GFP + B220CD138+ primary MM cells obtained from the BM of MIcγ1 (n = 1) and BIcγ1 (n = 1) mice were co-cultured with the corresponding T cells. d) Co-culture assays with CD8+ T cells and CD4+CD25+ Treg cells from MIcγ1 (n = 1) and BIcγ1 (n = 2) mice. CD8+ T cell proliferation was measured with increasing concentrations of Treg cells. CPM, counts per minute per well. e) RNAseq analysis of the expression of MHC-I-related genes (left) and measurement of MHC-I/I-Ab surface expression by flow cytometry (right) in MGUS or MM cells from MIcγ1 and BIcγ1 mice with respect to BMPCs from YFPcγ1 mice (left). f) CD11c+ dendritic cells (DC) isolated from the spleen of MIcγ1 (n = 1), BIcγ1 (n = 1), and YFPcγ1 (n = 1) control mice showed similar MHC-I antigen presenting ability. CPM, counts per minute per well. g) List of 16 peptides containing potential neoantigens (neoAgs) in MM5080 cells, predicted to be highly immunogenic based on the affinity to bind to MHC-I and/or MHC-II molecules (left). On the right, functional validation assays of the peptides by co-culturing 8×10⁵ splenocytes from MM5080 transplanted mice (n = 8) vs. non-transplanted animals (n = 4) with the corresponding neoAg peptide, presented by MHC class I Kb and Db molecules or by MHC class II I-Ab molecules, during 24 h. Data is represented as mean ± s.d. P values are obtained using one-way ANOVA test followed by Tukey’s multiple comparison test (c, d and f), Kruskal-Wallis adjusted for multiple comparisons by Dunn’s test (c and e) and Mann-Whitney test (c). *p < 0.05; **p < 0.01; ***p < 0.001.
Extended Data Fig. 9
Extended Data Fig. 9. Syngeneic mouse models of multiple myeloma.
a) Quantification of MM cells, CD4+ and CD8+ T lymphocytes, NK cells and Treg cells in syngeneic MM5080 (n = 3-7) and control C57BL/6 (n = 3-6) mice is shown. b) Syngeneic transplants showed higher number of immunosuppressive PD-1+ Treg cells with respect to control C57BL/6 mice. c) Characterization of CD4+ T lymphocytes in syngeneic transplants (n = 4) vs. control C57BL/6 (n = 4) mice. d) Characterization of CD8+ T lymphocytes in syngeneic transplants (n = 4) vs. control C57BL/6 (n = 4) mice. e) Syngeneic transplants from the MM5080 cell line were refractory to therapies with moAbs that inhibit PD-1, PD-L1 and TIGIT. Therapy responses were determined by comparing median overall (mOS) in Kaplan-Meier survival curves. The number of mice included on each cohort is indicated. f) Simultaneous inhibition of PD-L1 and TIGIT moderately increased survival in a fraction of treated mice. Therapy responses were estimated by Kaplan-Meier survival curves. The number of mice included on each cohort is indicated. g) Depletion of Treg cells with the anti-CD25 moAb combined with inhibition of PD-L1 efficacy decreased MM growth in the subcutaneous MM8273 syngeneic model. Boxes represent median, upper and lower quartiles and whiskers represent minimum to maximum range (a, b, c and d). P values obtained from two-tailed t tests (a, b, c and d), Mann-Whitney tests (a, b, c and d) and Kruskal-Wallis adjusted for multiple comparisons by Dunn’s test (g) are indicated. Log-rank (Mantel-Cox) test was used in e and f. *p < 0.05; **p < 0.01; ***p < 0.001; NS, not significant.

References

    1. Kumar SK, et al. Multiple myeloma. Nat. Rev. Dis. Prim. 2017;3:17046. doi: 10.1038/nrdp.2017.46. - DOI - PubMed
    1. Mouhieddine TH, Weeks LD, Ghobrial IM. Monoclonal gammopathy of undetermined significance. Blood. 2019;133:2484–2494. doi: 10.1182/blood.2019846782. - DOI - PubMed
    1. Dhodapkar MV. MGUS to myeloma: a mysterious gammopathy of underexplored significance. Blood. 2016;128:2599–2606. doi: 10.1182/blood-2016-09-692954. - DOI - PMC - PubMed
    1. Manier S, et al. Genomic complexity of multiple myeloma and its clinical implications. Nat. Rev. Clin. Oncol. 2017;14:100–113. doi: 10.1038/nrclinonc.2016.122. - DOI - PubMed
    1. Kumar SK, Rajkumar SV. The multiple myelomas—current concepts in cytogenetic classification and therapy. Nat. Rev.Clin. Oncol. 2018;15:409–421. doi: 10.1038/s41571-018-0018-y. - DOI - PubMed

Publication types