Clinical Trial
. 2023 Mar;29(3):593-604.
doi: 10.1038/s41591-022-02189-0. Epub 2023 Mar 16.

Neoadjuvant chemotherapy plus nivolumab with or without ipilimumab in operable non-small cell lung cancer: the phase 2 platform NEOSTAR trial

Affiliations
Clinical Trial

Neoadjuvant chemotherapy plus nivolumab with or without ipilimumab in operable non-small cell lung cancer: the phase 2 platform NEOSTAR trial

Tina Cascone et al. Nat Med. 2023 Mar.

Abstract

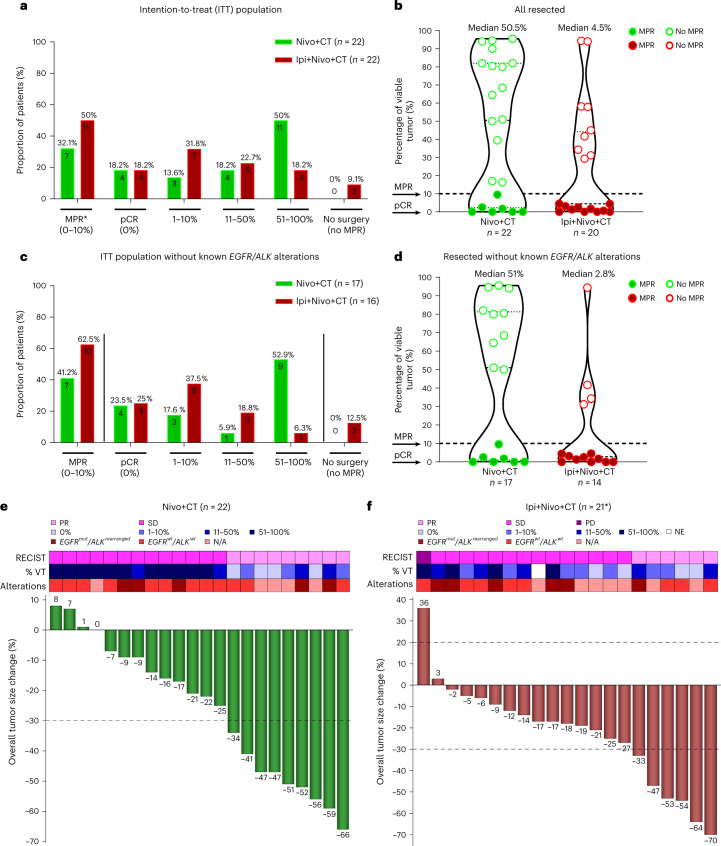
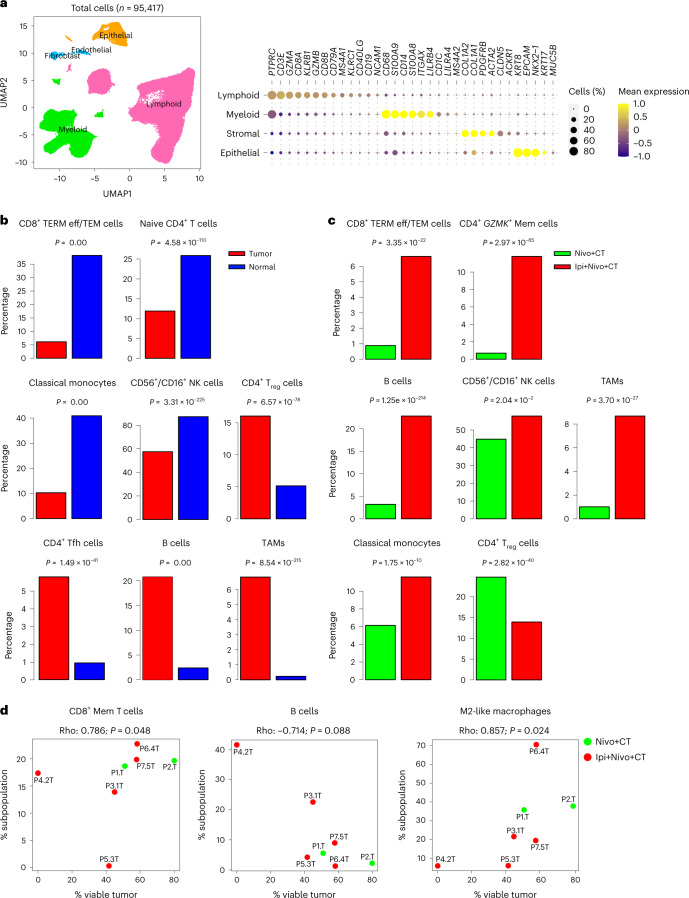
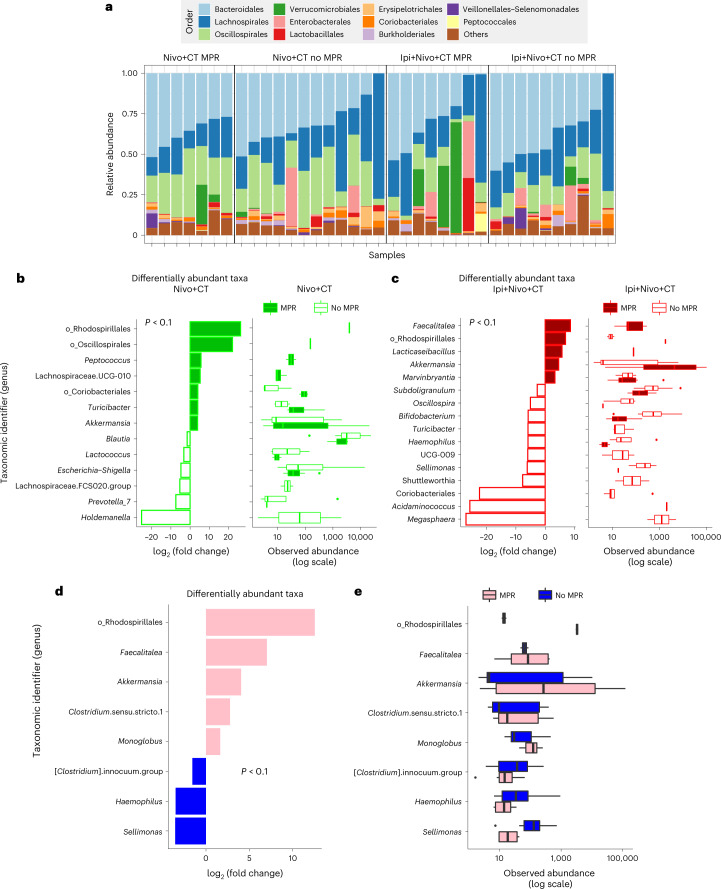
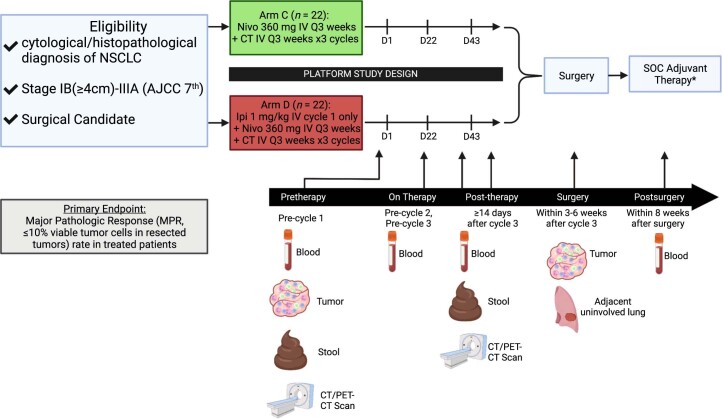
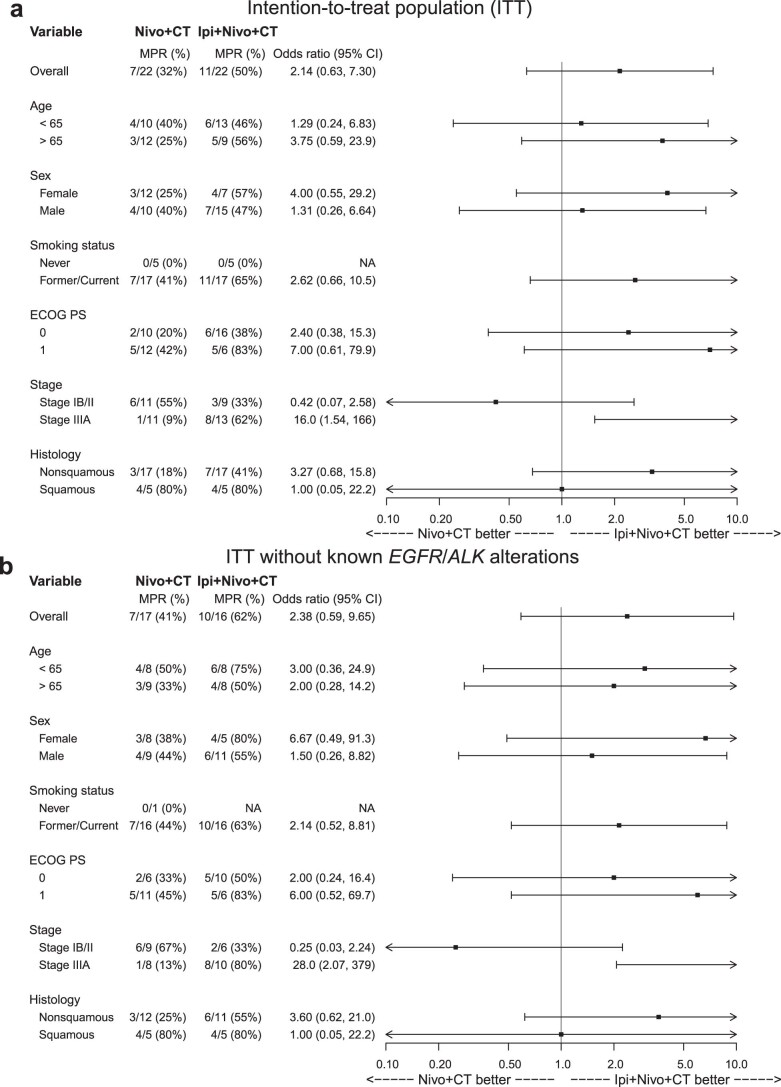
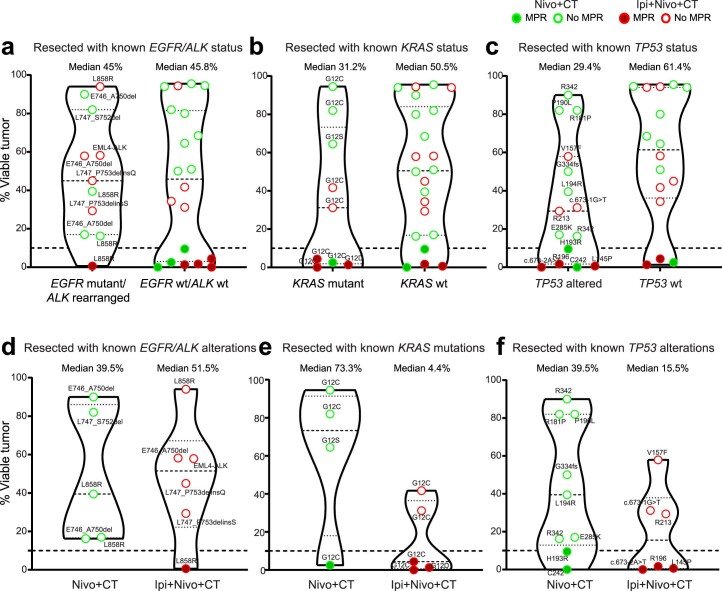
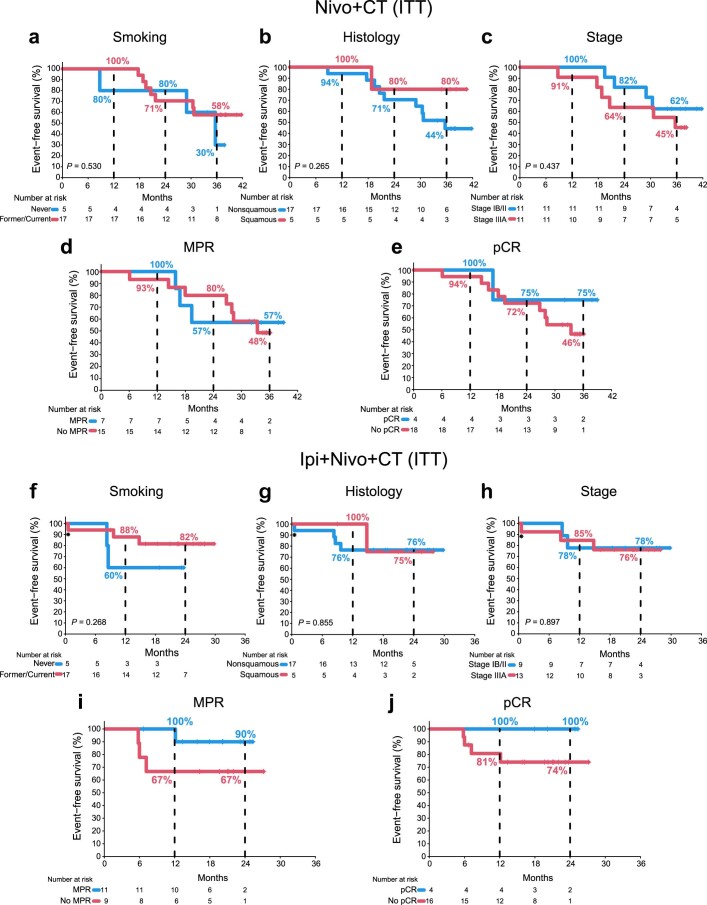
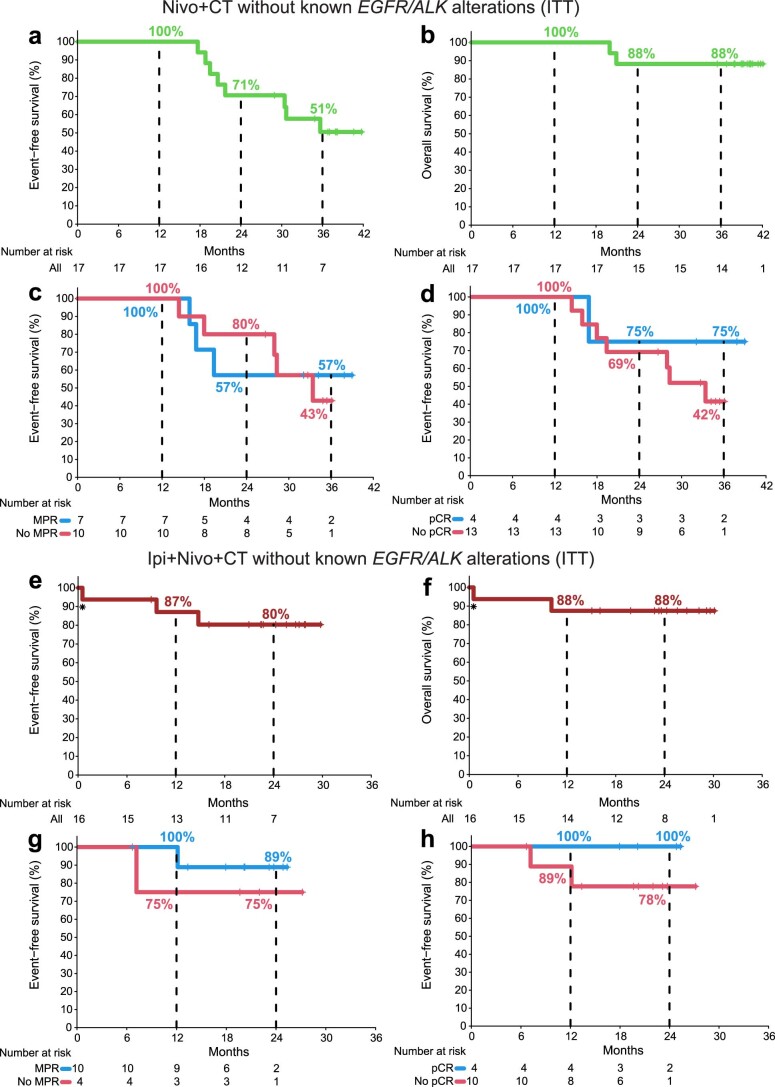
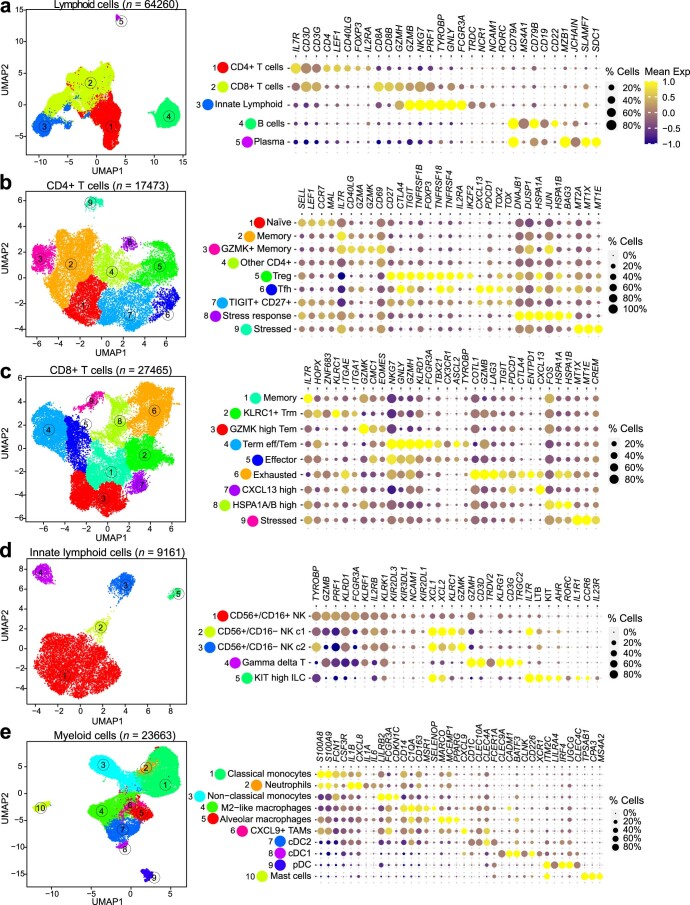
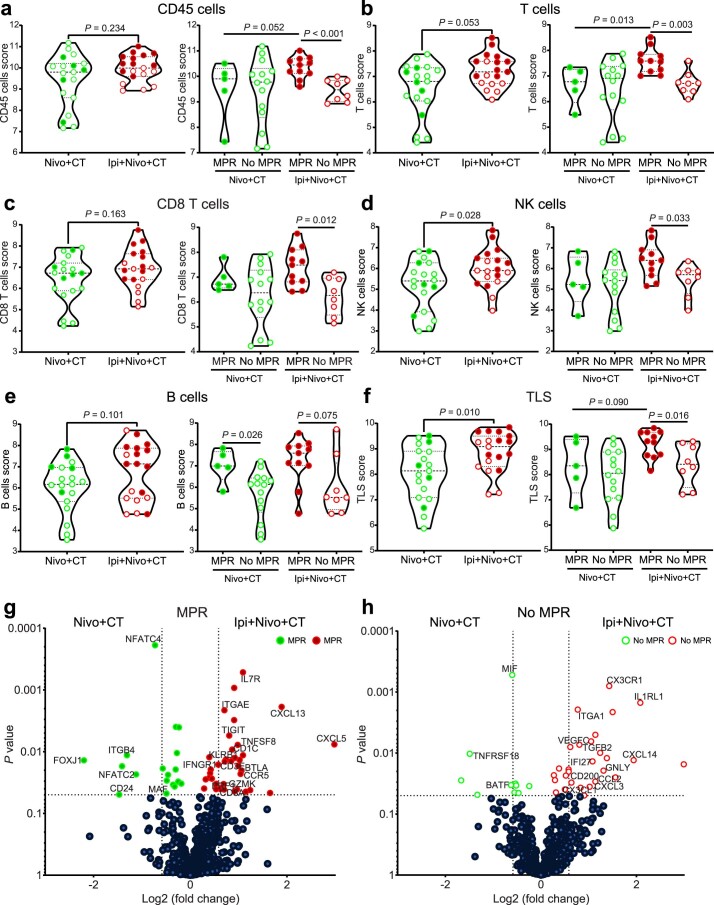
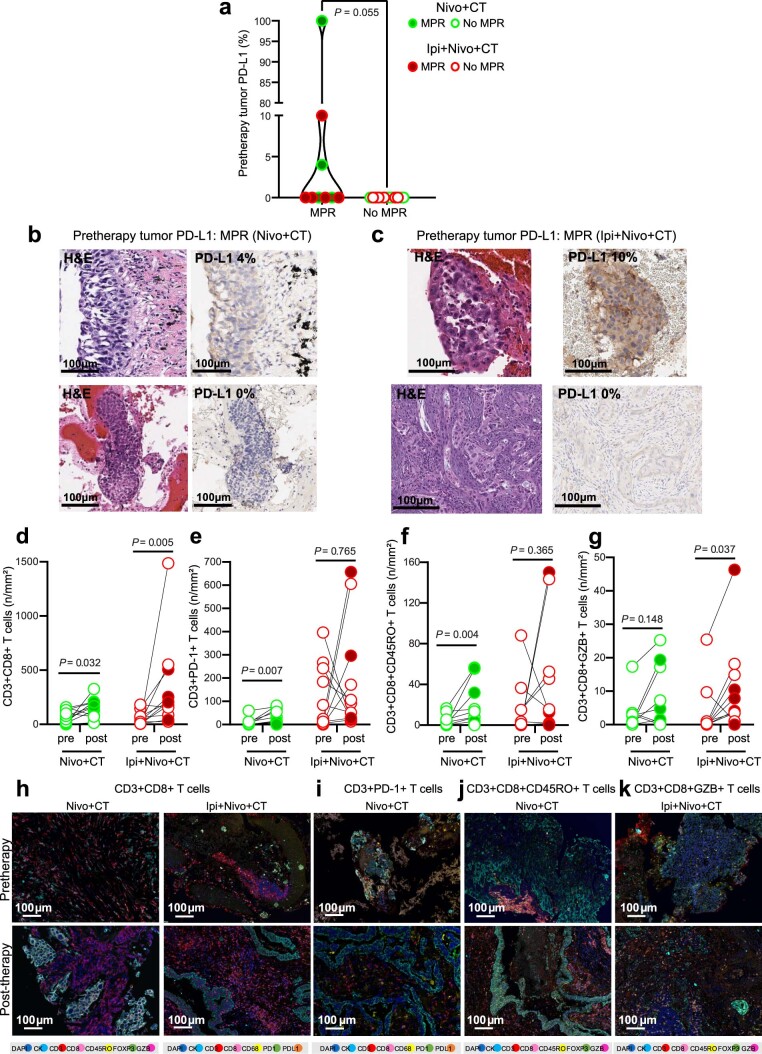
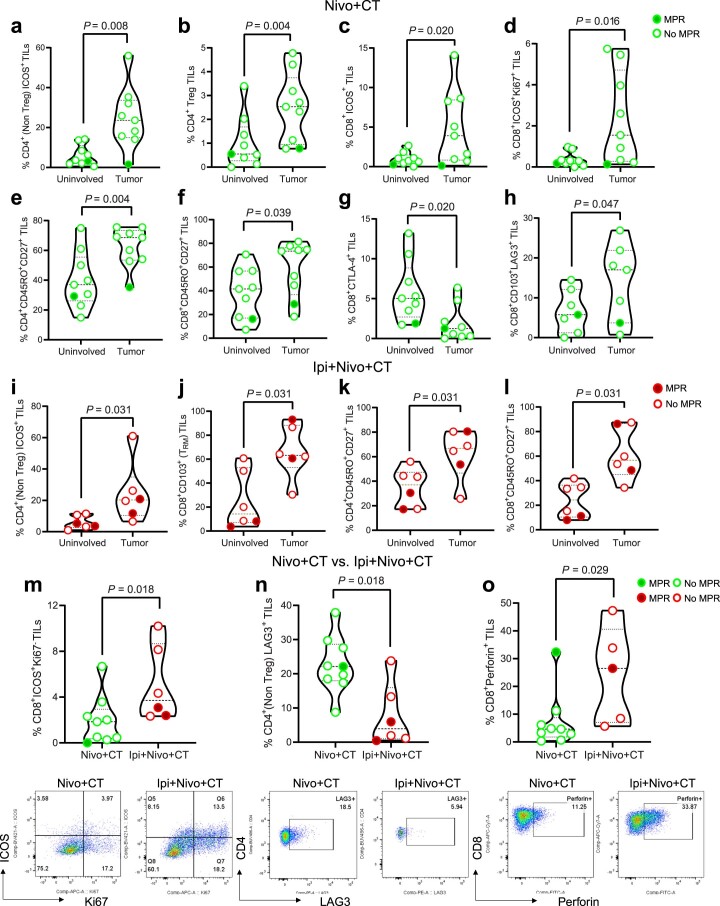
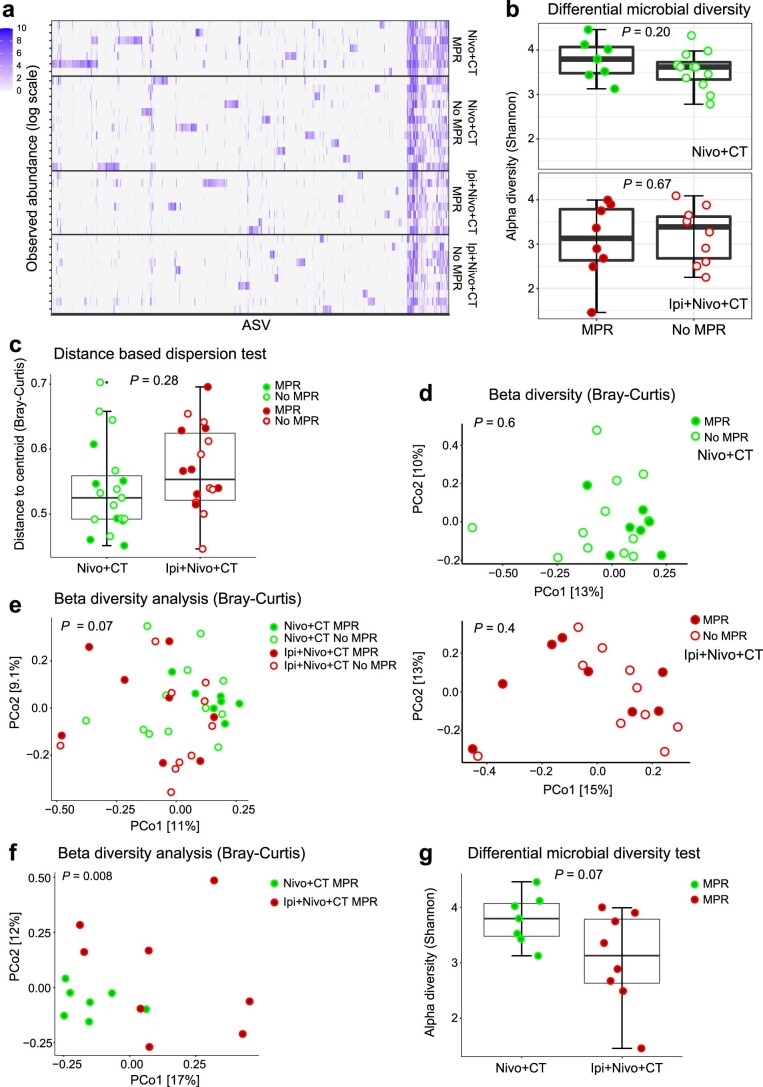
Neoadjuvant ipilimumab + nivolumab (Ipi+Nivo) and nivolumab + chemotherapy (Nivo+CT) induce greater pathologic response rates than CT alone in patients with operable non-small cell lung cancer (NSCLC). The impact of adding ipilimumab to neoadjuvant Nivo+CT is unknown. Here we report the results and correlates of two arms of the phase 2 platform NEOSTAR trial testing neoadjuvant Nivo+CT and Ipi+Nivo+CT with major pathologic response (MPR) as the primary endpoint. MPR rates were 32.1% (7/22, 80% confidence interval (CI) 18.7-43.1%) in the Nivo+CT arm and 50% (11/22, 80% CI 34.6-61.1%) in the Ipi+Nivo+CT arm; the primary endpoint was met in both arms. In patients without known tumor EGFR/ALK alterations, MPR rates were 41.2% (7/17) and 62.5% (10/16) in the Nivo+CT and Ipi+Nivo+CT groups, respectively. No new safety signals were observed in either arm. Single-cell sequencing and multi-platform immune profiling (exploratory endpoints) underscored immune cell populations and phenotypes, including effector memory CD8+ T, B and myeloid cells and markers of tertiary lymphoid structures, that were preferentially increased in the Ipi+Nivo+CT cohort. Baseline fecal microbiota in patients with MPR were enriched with beneficial taxa, such as Akkermansia, and displayed reduced abundance of pro-inflammatory and pathogenic microbes. Neoadjuvant Ipi+Nivo+CT enhances pathologic responses and warrants further study in operable NSCLC. (ClinicalTrials.gov registration: NCT03158129 .).


Conflict of interest statement

T.C. reports speaker fees/honoraria from the Society for Immunotherapy of Cancer, Bristol Myers Squibb, Roche, Medscape, IDEOlogy Health, OncLive, Physicians' Education Resource and PeerView; travel, food and beverage expenses from the Physicians’ Education Resource, Dava Oncology, IDEOlogy Health and Bristol Myers Squibb; advisory role/consulting fees from MedImmune/AstraZeneca, Bristol Myers Squibb, EMD Serono, Merck, Genentech, Arrowhead Pharmaceuticals and Regeneron; and institutional research funding from MedImmune/AstraZeneca, Bristol Myers Squibb, Boehringer Ingelheim and EMD Serono. M.C.B.G. has received research funding from Siemens Healthcare. W.N.W. reports consulting or advisory role fees from Clovis Oncology and AstraZeneca; speaker’s fees from Boehringer Ingelheim; honoraria from Roche/Genentech, AstraZeneca, Boehringer Ingelheim, Bristol Myers Squibb, Merck, Bayer, Pfizer and Eli Lilly; and research funding from OSI Pharmaceuticals, Boehringer Ingelheim, Bristol Myers Squibb, Eli Lilly and Merck. M.V.N. reports institutional research funding from Mirati, Novartis, Checkmate, Alaunos/Ziopharm, AstraZeneca, Pfizer and Genentech and consultant/advisory board participation from Mirati, Merck/Merck Sharp & Dohme, Novartis and Genentech. X.L. receives consultant and advisory fees from Eli Lilly, AstraZeneca and EMD Serono and research funding from Eli Lilly, Boehringer Ingelheim and Spectrum Pharmaceuticals. C.M.G. reports fees for advisory committees from AstraZeneca, Bristol Myers Squibb, Jazz Pharmaceuticals and Monte Rosa Therapeutics; research support from AstraZeneca; and speaker’s fees from AstraZeneca and BeiGene. A.S.T. reports personal fees from Bristol Myers Squibb, Eli Lilly, Roche, Novartis, Ariad, EMD Serono, Merck, Seattle Genetics, AstraZeneca, Boehringer Ingelheim, Sellas Life Science and Takeda and grants from Millennium, Polaris, Epizyme and EMD Serono, all outside the submitted work. L.A.B. receives consulting or advisory board fees from Merck Sharp & Dohme, Arrowhead Pharmaceuticals, Chugai Pharmaceutical Company, AstraZeneca, Genentech, BeiGene, AbbVie and Jazz Pharmaceuticals and research funding support from AstraZeneca. M.A. reports research funding to MD Anderson Cancer Center from Genentech, Nektar Therapeutics, Merck, GlaxoSmithKline, Novartis, Jounce Therapeutics, Bristol Myers Squibb, Eli Lilly and Adaptimmune and receives advisory fees from GlaxoSmithKline and Shattuck Labs. B.S.G. reports research funding to MD Anderson Cancer Center from Pfizer, ISA Pharmaceuticals, MedImmune/AstraZeneca and Cue Bio. G.B. receives personal fees and research funding from Amgen, Bayer, Bristol Myers Squibb, Celgene, CytomX Therapeutics, Daiichi Sankyo, Genentech, MedImmune, Merck, Roche and Xcovery; research funding from Adaptimmune, AstraZeneca, Exelixis, GlaxoSmithKline, Immatics, Immunocore, Incyte, Kite Pharma, Macrogenics, Torque, Duality Biologics, Tmunity, Regeneron, Sanofi, BeiGene, Novartis, Verastem and Repertoire Immune Medicines; and personal fees from AbbVie, Adicet, Amgen, Aiad, Clovis Oncology, AstraZeneca, BeiGene, Bristol Myers Squibb, Celgene, Genentech, Genzyme, Gilead, Instil Bio, Intervenn Biosciences, Eli Lilly, Merck, Novartis, Roche, Onconova Therapeutics, Regeneron, Sanofi, Tyme Oncology, Xcovery, Virogin Biotech, Johnson & Johnson/Janssen and Maverick Therapeutics. J.Z. receives research funding from Merck, Johnson & Johnson and Novartis and consulting fees/speaker fees/honoraria from Bristol Myers Squibb, AstraZeneca, Roche, GenePlus, Innovent and Hengrui, all outside the submitted work. W.L.H. receives research funding from Johnson & Johnson. M.A. reports consulting fees from AstraZeneca. C.H. reports speaker’s fees from the Society for Immunotherapy of Cancer; research funding to the institution from Iovance, Sanofi, BTG and Dragonfly; stock options for Briacell; advisory board membership for Briacell and the Mesothelioma Applied Research Foundation; and personal fees from Nanobiotix. I.I.W. reports honoraria from Genentech/Roche, Bayer, Bristol Myers Squibb, AstraZeneca/Medimmune, Pfizer, HTG Molecular, Asuragen, Merck, GlaxoSmithKline, Guardant Health, Platform Health, Daiichi, Merck, Flame, Oncocyte and Merck Sharp & Dohme and research support from Genentech, Oncoplex, HTG Molecular, DepArray, Merck, Bristol Myers Squibb, Medimmune, Adaptive, Adaptimmune, EMD Serono, Pfizer, Takeda, Amgen, Karus, Johnson & Johnson, Bayer, Iovance, 4D Pharma, Novartis and Akoya. S.G.S. reports speaker, travel and lodging expenses from the Egyptian Society of Surgical Oncology/Best of SSO Cairo and the West Hawaii Cancer Symposium; review panel participation and travel and lodging expenses from the Peter MacCallum Cancer Centre; and unpaid advisory board participation for Ethicon. D.L.G. reports honoraria for scientific advisory boards from AstraZeneca, Sanofi, Alethia Biotherapeutics, Menarini, Eli Lilly, 4D Pharma and Onconova and research support from Janssen, Takeda, Astellas, Ribon Therapeutics, NGM Biopharmaceuticals, Boehringer Ingelheim, Mirati Therapeutics and AstraZeneca. J.A.W. is an inventor on a US patent application (PCT/US17/53.717) submitted by The University of Texas MD Anderson Cancer Center that covers methods to enhance immune checkpoint blockade responses by modulating the microbiome. J.A.W. also reports compensation for speaker’s bureau and honoraria from Imedex, Dava Oncology, Omniprex, Illumina, Gilead, PeerView, Physician Education Resource, MedImmune, Exelixis and Bristol Myers Squibb; serves as a consultant/advisory board member for Roche/Genentech, Novartis, AstraZeneca, GlaxoSmithKline, Bristol Myers Squibb, Merck, Biothera Pharmaceuticals and Microbiome DX; and receives research support from GlaxoSmithKline, Roche/Genentech, Bristol Myers Squibb and Novartis. J.P.A. reports consulting, stock ownership or advisory board membership from Achelois, Adaptive Biotechnologies, Apricity, BioAtla, BioNTech, Candel Therapeutics, Codiak Biosciences, Dragonfly Therapeutics, Earli, Enable Medicine, Hummingbird, ImaginAb, Lava Therapeutics, Lytix Biopharma, Marker Therapeutics, PBM Capital, Phenomic AI, Polaris Pharma, Time Bioventures, Trained Therapeutix Discovery, Two Bear Capital and InterVenn Biosciences. P.S. reports consulting, stock ownership or advisory board membership from Achelois, Adaptive Biotechnologies, Affini-T, Apricity, Asher Bio, BioAtla, BioNTech, Candel Therapeutics, Carisma, Catalio, Codiak Biosciences, C-Reveal Therapeutics, Dragonfly Therapeutics, Earli, Enable Medicine, Glympse, Henlius/Hengenix, Hummingbird, ImaginAb, Infinity Pharma, InterVenn Biosciences, JSL Health, Lava Therapeutics, Lytix Biopharma, Marker Therapeutics, Oncolytics, PBM Capital, Phenomic AI, Polaris Pharma, Sporos, Time Bioventures, Trained Therapeutix Discovery, Two Bear Capital and Xilis. H.K. receives funding to MD Anderson Cancer Center from Johnson & Johnson. J.V.H. reports fees for advisory committees/consulting from AstraZeneca, EMD Serono, Boehringer Ingelheim, Catalyst, Genentech, GlaxoSmithKline, Hengrui Therapeutics, Eli Lilly, Spectrum, Sanofi, Takeda, Mirati Therapeutics, Bristol Myers Squibb, BrightPath Biotherapeutics, Janssen Global Services, Nexus Health Systems, Pneuma Respiratory, Kairos Venture Investments, Roche, Leads Biolabs, RefleXion and Chugai Pharmaceutical Company; research support from AstraZeneca, Bristol Myers Squibb, Spectrum and Takeda; and royalties and licensing fees from Spectrum. B.S. reports consulting and speaker fees from PeerView, AstraZeneca and Medscape and institutional research funding from Bristol Myers Squibb. The other authors report no competing interests.

Figures

Fig. 1
Fig. 1. CONSORT flow diagram.
Flow diagram depicts the disposition of patients throughout the phases of the study, including screening, neoadjuvant treatment and surgical resection. Reasons for screen failures, failure to complete planned neoadjuvant regimen and surgery not performed are shown. aEight patients required CT dose reduction. bSeven patients required CT dose reduction, and four patients required platinum agent change.
Fig. 2
Fig. 2. Pathologic and radiographic responses in patients treated with neoadjuvant Nivo+CT and Ipi+Nivo+CT.
a, Proportion of patients with pathologic responses and percentage of viable tumor in the ITT population (Nivo+CT, n = 22; Ipi+Nivo+CT, n = 22). Primary endpoint: MPR (≤10% viable tumor cells) consists of pCR (0% viable tumor) and 1–10% viable tumor. *MPR rate was obtained from a UMVUE. b, Percentage of viable tumor in resected tumor specimens (Nivo+CT, n = 22; Ipi+Nivo+CT, n = 20). Median percentage of viable tumor: Nivo+CT 50.5% (range 0–95.5%) and Ipi+Nivo+CT 4.5% (range 0–94.4%). c, Proportion of patients with pathologic responses and percentage of viable tumor in ITT population without known tumor EGFR/ALK alterations (Nivo+CT, n = 17; Ipi+Nivo+CT, n = 16). d, Percentage of tumor in resected tumor specimens without known tumor EGFR/ALK alterations (Nivo+CT, n = 17; Ipi+Nivo+CT, n = 14). Median percentage of viable tumor: Nivo+CT 51% (range 0–95.5%) and Ipi+Nivo+CT 2.8% (range 0–94.4%). Data in b and d are presented as the median with minima, lower and upper quartiles and maxima using violin plots. The dashed line indicates the median; the dotted lines indicate the lower quartile and upper quartile values; and the top and bottom indicate the maxima and minima. The two arrows show percentage of viable tumor at MPR and pCR. The green filled and empty circles depict data from MPR and no MPR, respectively, in Nivo+CT patients, and the red filled and empty circles depict data from MPR and no MPR, respectively, in Ipi+Nivo+CT patients. e,f, The top panel shows the radiographic response by RECIST, percentage of viable tumor and select tumor molecular alterations, and the bottom panel shows the radiographic percentage change in overall tumor size from baseline in Nivo+CT (e) and Ipi+Nivo+CT (f). The dashed line at the 20% point depicts cutoff for PD. The dashed line at the −30% point depicts cutoff for PR. *One patient was not radiographically and pathologically evaluable due to death from SARS-CoV-2 infection-related complications (non-treatment related). VT, viable tumor; mut, mutant; wt, wild type; NE, not evaluable, N/A, not available.
Fig. 3
Fig. 3. Survival outcomes in patients treated with neoadjuvant Nivo+CT and Ipi+Nivo+CT.
a, Kaplan–Meier curve of EFS for the patients treated with neoadjuvant Nivo+CT (n = 22). Median EFS was not reached. Ten patients experienced recurrences 8.7 (died at 31.6 months), 17.7 (died at 20.0 months), 18.8 (died at 20.9 months), 19.5, 20.6, 21.7, 29.0, 30.4, 30.7 and 35.7 months after treatment initiation. b, Kaplan–Meier curve of OS for the patients treated with neoadjuvant Nivo+CT (n = 22). Median OS was not reached. Three patients died from complications related to recurrent lung cancer 20.0 months, 20.9 months and 31.6 months after treatment initiation. c, Kaplan–Meier curve of EFS for patients treated with neoadjuvant Ipi+Nivo+CT (n = 22). Median EFS was not reached. Four patients experienced recurrences 8.3, 8.6 (died at 26.7 months), 9.6 (died at 10.1 months) and 14.8 months after treatment initiation. *One patient died of SARS-CoV-2 infection-related complications (non-treatment related). d, Kaplan–Meier curve of OS for the patients treated with neoadjuvant Ipi+Nivo+CT (n = 22). Median OS was not reached. Two patients died from acute limb ischemia complications and lung cancer complications 10.1 months and 26.7 months after treatment initiation. *One patient died from SARS-CoV-2 infection-related complications (non-treatment related).
Fig. 4
Fig. 4. Single-cell expression analysis of resected tumors and uninvolved normal lung tissues from patients treated with neoadjuvant Nivo+CT and Ipi+Nivo+CT.
scRNA-seq analysis was performed on matched NSCLCs and uninvolved normal lung tissues from patients treated with Nivo+CT (n = 2) and Ipi+Nivo+CT (n = 5). scRNA-seq was also performed on an LN sample from a patient treated with Nivo+CT. a, Left: UMAP visualization of 95,417 high-quality and non-cycling cells after clustering. Clusters are color-coded by major cell lineage: lymphoid, myeloid, epithelial and stromal (fibroblasts and endothelial cells). Right: bubble plot showing mean expression and abundance of marker genes that are differentially expressed among the four major lineage groups. b, Fractions of the indicated cell subsets from their respective lineages were computed in tumors (red bars) and normal tissues (blue bars) as such: CD8+ TERM eff/TEM from CD8+ T cells; naive CD4+ T cells, Treg cells and Tfh cells from all CD4+ T cells; B cells from lymphoid cells; classical monocytes and TAMs from myeloid cells; and NCAM1+/FCGR3A+CD56+/CD16+ NK cells from all innate lymphoid cells. Fractions of the indicated cell subsets were then statistically compared between matched tumor and normal tissues from all seven patients. P values are from two-sided proportion test. c, Fractions of the indicated cell subsets from their respective lineages were computed in tumors from Nivo+CT (green bars) and tumors from Ipi+Nivo+CT (red bars), as in b, and were then statistically compared between tumors from both treatment groups. P values are from two-sided proportion test. d, Correlation plots between fractions of the indicated cell subpopulations and the percentage of remaining viable tumor at the time of surgical resection. Fractions were computed in the manner described above: CD8+ memory T cells (CD8+ Mem) from all CD8+ T cells, B cells from all lymphoid cells and M2-like macrophages from all myeloid cells. Correlation coefficients were computed using Spearman’s correlation. P values were computed by two-sided Spearman’s correlation test. Source data for d are provided in Supplementary Table 8.
Fig. 5
Fig. 5. Association of fecal microbiome diversity and composition with responses to neoadjuvant Nivo+CT or Ipi+Nivo+CT.
Fecal samples collected before Nivo+CT (n = 19) or Ipi+Nivo+CT (n = 18) treatments were characterized via 16S V4 RNA gene profiling. a, Fecal microbiome profiles of patient samples from the two treatment groups and MPR status are represented by compositional plots showing the relative abundance at the order level. b, Differentially abundant taxa (cutoff of P < 0.1, two-sided DESeq2 likelihood ratio test) aggregated at the genus level between MPR (n = 7) and no MPR (n = 12) in the Nivo+CT arm (left panel) and box-and-whisker plot (right panel) of DESeq2 normalized abundances. c, Differentially abundant taxa (cutoff of P < 0.1, two-sided DESeq2 likelihood ratio test) aggregated at the genus level between MPR (n = 8) and no MPR patients (n = 10) in the Ipi+Nivo+CT arm (left panel) and box-and-whisker plot (right panel) of DESeq2 normalized abundances. d, Differentially abundant taxa (cutoff of P < 0.1, two-sided DESeq2 likelihood ratio test) aggregated at the genus level (or last known taxon) associated with the Nivo+CT and Ipi+Nivo+CT treatment responses—that is, MPR (n = 15) and no MPR (n = 22). e, Box-and-whisker plot of DESeq2 normalized abundances evaluating differentially abundant taxa associated with MPR status for the same taxa as shown in d. For box-and-whisker plots (b,c,e), the box includes data within first (Q1) and third (Q3) quartiles. The horizontal line represents the median. Length of whiskers represents minima (Q1 − [1.5 × IQR], where IQR means interquartile range) and maxima (Q3 + [1.5 × IQR]). Data points outside of whiskers are considered outliers. For differential abundance analyses (b,c,d), P values for each feature are provided in a source data file. Source data for a–e are provided in a source data file. Source data
Extended Data Fig. 1
Extended Data Fig. 1. Trial schema.
Patients with resectable, cytologically/histopathologically confirmed, clinical stage IB (≥4 cm)-IIIA (N2 single station) NSCLC were treated with neoadjuvant Nivo+CT for up to three cycles (arm C; D1, D22 and D43) or Ipi+Nivo+CT for up to three cycles (arm D; D1, D22 and D43; Ipi given on cycle 1 [D1] only), followed by surgical resection (within 3 to 6 weeks after the last cycle of therapy). *Standard of care adjuvant systemic therapy and/or postoperative radiation therapy were allowed at the discretion of the treating physicians. The primary endpoint of the trial was MPR, defined as ≤10% viable tumor in resected tumor specimens, in treated patients. Tumor samples were collected, when possible, pretherapy and at surgery, adjacent uninvolved (normal) lung tissues were also collected, where possible, at surgery. Stool samples were collected, where possible, pretherapy and post-therapy (prior to surgery). Longitudinal blood samples were collected, where possible, pretherapy, prior to cycle 2 and 3, post-therapy (prior to surgery) and within 8 weeks after surgery (post-surgery). NSCLC, non–small cell lung cancer; Nivo, nivolumab; Ipi, ipilimumab; CT, chemotherapy; D, day of therapy; CT, computer tomography scan; PET-CT, positron emission tomography-computer tomography scan, SOC, standard of care. BioRender (https://biorender.com) was used to generate portions of this Figure.
Extended Data Fig. 2
Extended Data Fig. 2. Impact of clinicopathological characteristics on efficacy of neoadjuvant Nivo+CT and Ipi+Nivo+CT.
a, Forest plot of the odds ratio (95% confidence interval) to explore the association between treatment arm and MPR for each subgroup (Nivo+CT, n = 22; Ipi+Nivo+CT, n = 22). b, Forest plot of the odds ratio (95% confidence interval) to explore the association between treatment arm (Nivo+CT, n = 17; Ipi+Nivo+CT, n = 16) and MPR for each subgroup in patients without known tumor EGFR/ALK alterations. In both panels, the vertical reference lines at 1 indicate no difference between two treatment arms. The point estimates of odds ratios are represented by solid squares. The whiskers are the two lines that extend to the lower and upper bounds of the 95% confidence intervals. The lower and upper limits of the 95% confidence intervals are clipped at 0.1 and 10.0 to arrows. The odds ratios and 95% confidence interval are from univariate logistic regression. MPR, major pathologic response; Nivo, nivolumab; Ipi, ipilimumab; CT, chemotherapy; Never, never smoker; Former/Current, former/current smoker; ECOG, Eastern Cooperative Oncology Group; PS, performance status; Squamous, squamous cell carcinoma; Nonsquamous includes adenocarcinoma, carcinoma with neuroendocrine features, NOS NSCLC, sarcomatoid carcinoma, and large cell carcinoma; NA, not available.
Extended Data Fig. 3
Extended Data Fig. 3. Pathological regression in resected patients with known tumor EGFR/ALK, KRAS, and TP53 alterations.
a-c, Comparison of the percentage of viable tumor in resected tumor specimens with: known EGFR mutant/ALK rearranged (n = 11) and EGFR wt/ALK wt (n = 20), median percentage of viable tumor: EGFR mutant/ALK rearranged 45% (range 0.6 – 94%), EGFR wt/ALK wt 45.8 (range 0 – 95.5%) (a); known KRAS mutant (n = 9) and KRAS wt (n = 22), median percentage of viable tumor: KRAS mutant 31.2% (range 0 – 94.5%), KRAS wt 50.5% (range 0 – 95.5%) (b); known TP53 altered (n = 15) and TP53 wt (n = 16), median percentage of viable tumor: TP53 altered 29.4% (range 0 – 90%), TP53 wt 61.4% (range 1.3 – 95.5%) (c). d-f, Percentage of viable tumor in resected tumor specimens with: known EGFR mutant/ALK rearranged tumors (Nivo+CT, n = 5; Ipi+Nivo+CT, n = 6), median percentage of viable tumor in Nivo+CT 39.5% (range 16.3 – 90%), in Ipi+Nivo+CT 51.5% (range 0.6 – 94%) (d); known KRAS mutant (Nivo+CT, n = 4; Ipi+Nivo+CT, n = 5), median percentage of viable tumor in Nivo+CT 73.3% (range 2.5 – 94.5%), in Ipi+Nivo+CT 4.4% (range 0 – 41.7%) (e); known TP53 altered (Nivo+CT, n = 9; Ipi+Nivo+CT, n = 6), median percentage of viable tumor in Nivo+CT 39.5% (range 0 – 90%), in Ipi+Nivo+CT 15.5% (range 0 – 57.9%) (f). Tumor alterations are shown as amino acid change; the splice site variants c.673-1 G>T and c.673-2A>T are shown as codon change. One patient (who had tumor TP53 alteration) was not included due to death from SARS-CoV-2 infection-related complications (non-treatment related) during neoadjuvant treatment. Dashed line at 10% point depicts cutoff for MPR. The green filled and empty circles depict data from MPR and no MPR, respectively, in Nivo+CT patients; the red filled and empty circles depict data from MPR and no MPR, respectively, in Ipi+Nivo+CT patients. Data are presented as median with minima, lower and upper quartiles, and maxima using violin plots. The dashed line indicates the median; the dotted lines indicate the lower quartile and upper quartile values; top and bottom indicate the maxima and minima. MPR, major pathologic response; Nivo, nivolumab; Ipi, ipilimumab; CT, chemotherapy; wt, wild type.
Extended Data Fig. 4
Extended Data Fig. 4. Impact of smoking status, histology, stage, MPR and pCR on EFS.
a-c, Kaplan-Meier curves of EFS by smoking status (n = 22) (a), histology (n = 22) (b), and stage (n = 22) (c) in Nivo+CT arm. d-e, Kaplan-Meier curves of EFS by MPR (n = 22) (d) and pCR (n = 22) (e) using landmark analysis from the surgery date in Nivo+CT arm. f-h, Kaplan-Meier curves of EFS by smoking status (n = 22) (f), histology (n = 22) (g), and stage (n = 22) (h) in Ipi+Nivo+CT arm. *One patient died from SARS-CoV-2 infection-related complications (non-treatment related). i-j, Kaplan-Meier curves of EFS by MPR (n = 20) (i) and pCR (n = 20) (j) using landmark analysis from the surgery date in Ipi+Nivo+CT arm. Two-sided P values are from logrank test. ITT, intention-to-treat population; Nivo, nivolumab; Ipi, ipilimumab; CT, chemotherapy; EFS, event-free survival; Squamous, squamous cell carcinoma; Nonsquamous includes adenocarcinoma, carcinoma with neuroendocrine features, NOS NSCLC, sarcomatoid carcinoma, and large cell carcinoma; Never, never smoker; Former, former smoker; Former/Current, former/current smoker; MPR, major pathologic response; pCR, pathologic complete response.
Extended Data Fig. 5
Extended Data Fig. 5. Survival outcomes in patients without known tumor EGFR/ALK alterations treated with neoadjuvant Nivo+CT and Ipi+Nivo+CT.
a, Kaplan-Meier curve of EFS for the patients without known tumor EGFR/ALK alterations treated with Nivo+CT (n = 17). b, Kaplan-Meier curve of OS for the patients without known tumor EGFR/ALK alterations treated with Nivo+CT (n = 17). c, Kaplan-Meier curves of EFS by MPR status (n = 17) using landmark analysis from the surgery date in patients without known tumor EGFR/ALK alterations treated with Nivo+CT. d, Kaplan-Meier curve of EFS by pCR status (n = 17) using landmark analysis from the surgery date in patients without known tumor EGFR/ALK alterations treated with Nivo+CT. e, Kaplan-Meier curve of EFS for the patients without known tumor EGFR/ALK alterations treated with Ipi+Nivo+CT (n = 16). f, Kaplan-Meier curve of OS for the patients without known tumor EGFR/ALK alterations treated with Ipi+Nivo+CT (n = 16). In e-f, * indicates one patient who died from SARS-CoV-2 infection-related complications (non-treatment related). g, Kaplan-Meier curve of EFS by MPR status (n = 16) using landmark analysis from the surgery date in patients without known tumor EGFR/ALK alterations treated with Ipi+Nivo+CT. h, Kaplan-Meier curve of EFS by pCR status (n = 16) using landmark analysis from the surgery date in patients without known tumor EGFR/ALK alterations treated with Ipi+Nivo+CT. ITT, intention-to-treat population; Nivo, nivolumab; Ipi, ipilimumab; CT, chemotherapy; OS, overall survival; EFS, event-free survival; MPR, major pathologic response; pCR, pathologic complete response.
Extended Data Fig. 6
Extended Data Fig. 6. Single-cell analysis of lymphoid and myeloid cell populations in tissues from patients treated with neoadjuvant Nivo+CT and Ipi+Nivo+CT.
a, Visualization of 64,260 lymphoid cells following clustering and color-coded by lymphoid lineages (CD4+T, CD8+ T, innate lymphoid, B, and plasma). Visualization of CD4+ T (b; n = 17,473), CD8+ T (c, n = 27,465), and innate lymphoid cells (d, n = 9,161) following clustering and color-coded by sublineages. e, Visualization of 23,663 myeloid cells following clustering and color-coded by lineages. All right panels: Bubble plots showing mean expression and abundance of marker genes that are differentially expressed among lymphoid cells (a), lymphoid subsets (b-d), and myeloid (e) cells based on lineage or sublineage.
Extended Data Fig. 7
Extended Data Fig. 7. Composition of immune infiltrates by NanoString analysis in tumors resected after neoadjuvant Nivo+CT and Ipi+Nivo+CT.
NanoString gene expression analysis was performed on post-treatment tumor tissues from patients treated with Nivo+CT (n = 19) and Ipi+Nivo+CT (n = 19). a–f, Violin plots showing the distribution of CD45+ (a), T cells (b), CD8+ T cells (c), NK cells (d), B cells (e), and TLS (f) scores (log2 normalized counts) in resected tumors by treatment arm (left panels) and by treatment arm and MPR (right panels). The TLS signature score is derived from the median expression of CCL19, CCL21, CXCL13, CCR7, SELL, LAMP3, CXCR4, CD86, and BCL6 genes. The green filled and empty circles depict data from MPR and no MPR, respectively, in Nivo+CT patients, and the red filled and empty circles depict data from MPR and no MPR, respectively, in Ipi+Nivo+CT patients. Data are presented as the median with minima, lower and upper quartiles, and maxima using violin plots. The dashed line indicates the median; the dotted lines indicate the lower quartile and upper quartile values; the top and bottom indicate the maxima and minima. g, Differential expression of genes between Nivo+CT and Ipi+Nivo+CT in MPR samples are illustrated as a volcano plot. The green filled circles depict significantly upregulated genes in Nivo+CT compared to Ipi+Nivo+CT. The red filled circles depict significantly upregulated genes in Ipi+Nivo+CT compared to Nivo+CT. h, Differential expression of genes between Nivo+CT and Ipi+Nivo+CT in no MPR samples are illustrated as a volcano plot. The green empty circles depict significantly upregulated genes in Nivo+CT compared to Ipi+Nivo+CT. The red empty circles depict significantly upregulated genes in Ipi+Nivo+CT compared to Nivo+CT. Two-sided P values are from Wilcoxon rank-sum test in the left panels in a and b and the right panels in a-f and two-sided P values are from unpaired t-test in in the left panels in c-f. The exact two-sided P value in the right panel in a is 0.000793840. Two-sided P values are from Welch’s t-test in g-h. Nivo, nivolumab; Ipi, ipilimumab; CT, chemotherapy; MPR, major pathologic response. Source data is provided as Source Data file. Source data
Extended Data Fig. 8
Extended Data Fig. 8. Tumor PD-L1 expression and immune population changes in tissues treated with neoadjuvant Nivo+CT and Ipi+Nivo+CT.
a, Pretherapy tumor PD-L1 IHC membranous expression (%) in malignant cells from responders and nonresponders treated with Nivo+CT and Ipi+Nivo+CT by MPR status (MPR vs. no MPR, n = 9 vs. n = 13). Data is presented as the median with minima, lower and upper quartiles, and maxima using violin plots. Individual data points are shown; the dashed line shows the median value, and dotted lines show lower quartile and upper quartile values; the top and bottom of the violin plots indicate the maxima and minima. Two-sided P value is from Wilcoxon’s rank-sum test. b, c, Examples of hematoxylin and eosin (H&E) micrographs (left panels) of pretherapy tumors from patients with MPR in Nivo+CT (b) and in Ipi+Nivo+CT (c) arms with pretherapy PD-L1 expression (right and top panel) or without PD-L1 expression (right and bottom panel) in malignant cells. Experiments and scorings related to the presented micrographs were conducted once. d-g, Quantification of CD3+CD8+ T cells (panel 1) (d), CD3+PD-1+ T cells (panel 1) (e), CD3+CD8+CD45RO+ T cells (panel 2) (f), and CD3+CD8+GZB+ T cells (panel 2) (g) densities (no. per mm2) by mIF staining in paired pretherapy and post-therapy tumor samples in Nivo+CT (n = 11) and Ipi+Nivo+CT (n = 11) groups. Two-sided P value is from Wilcoxon’s signed-rank test. h-k, Examples of micrographs of mIF staining of pretherapy and post-therapy CD3+CD8+ T cells (panel 2 and 1) (h), CD3+PD-1+ T cells (panel 1) (i), CD3+CD8+CD45RO+ T cells (panel 2) (j), and CD3+CD8+GZB+ T cells (panel 2) (k) in tumor samples in Nivo+CT and Ipi+Nivo+CT arms. Experiments and scoring related the presented micrographs were conducted once. The green filled and empty circles depict data from MPR and no MPR, respectively, in Nivo+CT patients, and the red filled and empty circles depict data from MPR and no MPR, respectively, in Ipi+Nivo+CT patients. Nivo, nivolumab; Ipi, ipilimumab; CT, chemotherapy; MPR, major pathologic response. Source data for panels a, d-g is provided as Source Data file. Source data
Extended Data Fig. 9
Extended Data Fig. 9. Immune infiltrates by flow cytometry analysis in resected uninvolved lungs and tumors treated with neoadjuvant Nivo+CT and Ipi+Nivo+CT.
a-h, Flow cytometry in paired resected uninvolved lung (n = 9) and tumor tissues (n = 9) in Nivo+CT. Percentage of CD4+ (Non Treg) ICOS+ TILs (a), CD4+ Treg TILs (b), CD8+ ICOS+ TILs (c), CD8+ ICOS+ Ki67+ TILs (d), CD4+ CD45RO+ CD27+ TILs (e), CD8+ CD45RO+ CD27+ TILs (f), CD8+ CTLA-4+ TILs (g), CD8+ CD103+ LAG3+ TILs (h). i-l, Flow cytometry in paired resected uninvolved lung (n = 6) and tumor tissues (n = 6) in Ipi+Nivo+CT. Percentage of CD4+ (Non Treg) ICOS+ TILs (i), CD8+ CD103+ (tissue-resident memory T cells, TRM) TILs (j), CD4+ CD45RO+ CD27+ TILs (k), CD8+ CD45RO+ CD27+ TILs (l). m-o, Flow cytometry in resected tumor tissues after Nivo+CT (n = 9) and Ipi+Nivo+CT (n = 6 in m and n, n = 5 in o) treatments. Percentages (top panels) and representative gates (bottom panels) of CD8+ ICOS+ Ki67- TILs (m), CD4+ (Non Treg) LAG3+ TILs (n), CD8+ Perforin+ TILs (o). The green filled and empty circles depict data from MPR and no MPR, respectively, in Nivo+CT patients, and the red filled and empty circles depict data from MPR and no MPR, respectively, in Ipi+Nivo+CT patients. Data are presented as the median with minima, lower and upper quartiles, and maxima using violin plots. The dashed line shows the median value, and dotted lines show the lower quartile and upper quartile values of the range; the top and bottom of the violin plots indicate the maxima and minima. Two-sided P value is from Wilcoxon signed-rank test (a-l) and Wilcoxon rank-sum test (m-o). Experiments and gating related to presented results were conducted once. Subgating was performed only when more than 100 events were present in the parental gate. Nivo, nivolumab; Ipi, ipilimumab; CT, chemotherapy; TILs, tumor-infiltrating lymphocytes; MPR, major pathologic response. Source data is provided as Source Data file. Source data
Extended Data Fig. 10
Extended Data Fig. 10. Association of MPR with fecal microbiome diversity and composition following neoadjuvant Nivo+CT or Ipi+Nivo+CT.
Fecal samples collected before treatment were characterized via 16Sv4 RNA gene profiling in Nivo+CT (n = 19) or Ipi+Nivo+CT (n = 18) arms. a, Abundance (log-scale) of amplicon sequence variants (ASV) (in log-scale) observed in patients from both treatment groups with MPR and no MPR. b, Comparison of Shannon Index scores between patients with MPR and no MPR in each treatment arm (top, Nivo+CT; bottom: Ipi+Nivo+CT). c, Comparison of between-sample variance in between treatment arms using beta-dispersion test with Bray-Curtis dissimilarity. d, Principal coordinate analysis (PCoA) plots of Bray-Curtis distances comparing MPR versus no MPR (top, Nivo+CT; bottom: Ipi+Nivo+CT). e, Principal coordinate analysis (PCoA) plots of Bray-Curtis distances comparing samples from patients with MPR and no MPR from all treatment arms. f, Principal coordinate analysis (PCoA) plots of Bray-Curtis distances comparing MPR from both treatment arms (Nivo+CT n = 7, Ipi+Nivo+CT n = 8). g, Comparison of Shannon Index scores between MPR from both treatment groups (Nivo+CT n = 7, Ipi+Nivo+CT n = 8). For alpha diversity analyses (b, g) two-sided P value derived from ANOVA. For beta diversity analyses (c–f) two-sided P value derived from PERMANOVA with 999 permutations. For box and whisker plots (b, c, g), the box includes data within first (Q1) and third (Q3) quartiles. Horizontal line represents the median. Length of whiskers represent minima (Q1-[1.5xIQR]) and maxima (Q3+ 1.5xIQR]). Data points outside of whiskers are considered outliers. Nivo, nivolumab; Ipi, ipilimumab; CT, chemotherapy; MPR, major pathologic response. Source data is provided as Source Data file. Source data

References

    1. Chaft JE, et al. Evolution of systemic therapy for stages I–III non-metastatic non-small-cell lung cancer. Nat. Rev. Clin. Oncol. 2021;18:547–557. doi: 10.1038/s41571-021-00501-4. - DOI - PMC - PubMed
    1. Felip E, et al. Adjuvant atezolizumab after adjuvant chemotherapy in resected stage IB–IIIA non-small-cell lung cancer (IMpower010): a randomised, multicentre, open-label, phase 3 trial. Lancet. 2021;398:1344–1357. doi: 10.1016/S0140-6736(21)02098-5. - DOI - PubMed
    1. Forde PM, et al. Neoadjuvant nivolumab plus chemotherapy in resectable lung cancer. N. Engl. J. Med. 2022;386:1973–1985. doi: 10.1056/NEJMoa2202170. - DOI - PMC - PubMed
    1. Forde PM, et al. Neoadjuvant PD-1 blockade in resectable lung cancer. N. Engl. J. Med. 2018;378:1976–1986. doi: 10.1056/NEJMoa1716078. - DOI - PMC - PubMed
    1. Gao S, et al. Neoadjuvant PD-1 inhibitor (sintilimab) in NSCLC. J. Thorac. Oncol. 2020;15:816–826. doi: 10.1016/j.jtho.2020.01.017. - DOI - PubMed

Publication types

MeSH terms

Associated data