. 2023 Mar;29(3):679-688.
doi: 10.1038/s41591-023-02211-z. Epub 2023 Mar 16.

Genetic association analysis of 77,539 genomes reveals rare disease etiologies

Affiliations

Genetic association analysis of 77,539 genomes reveals rare disease etiologies

Daniel Greene et al. Nat Med. 2023 Mar.

Abstract

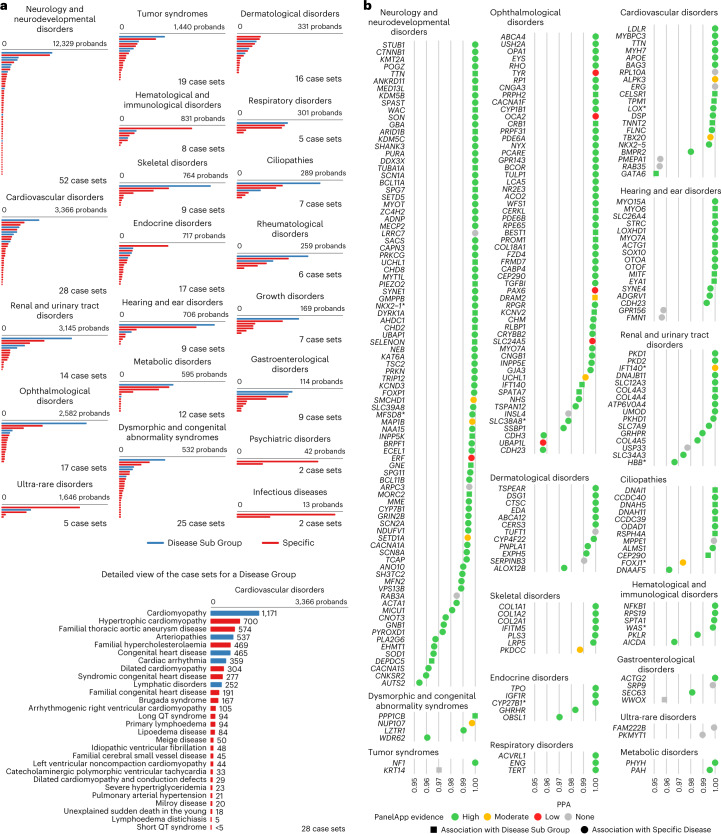
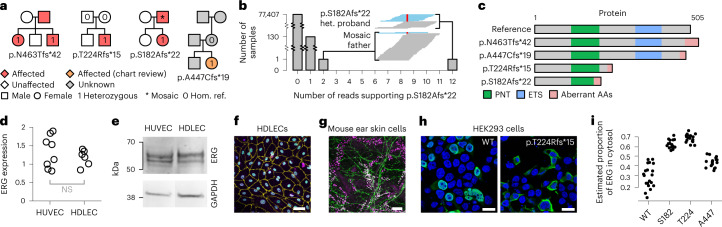
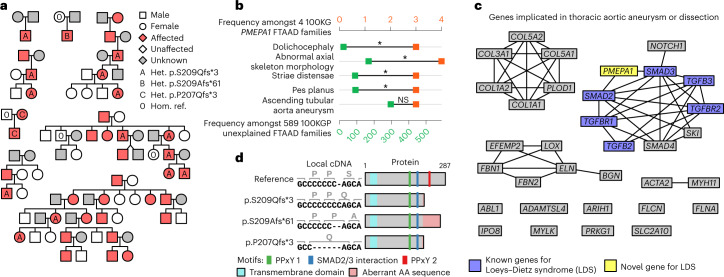
The genetic etiologies of more than half of rare diseases remain unknown. Standardized genome sequencing and phenotyping of large patient cohorts provide an opportunity for discovering the unknown etiologies, but this depends on efficient and powerful analytical methods. We built a compact database, the 'Rareservoir', containing the rare variant genotypes and phenotypes of 77,539 participants sequenced by the 100,000 Genomes Project. We then used the Bayesian genetic association method BeviMed to infer associations between genes and each of 269 rare disease classes assigned by clinicians to the participants. We identified 241 known and 19 previously unidentified associations. We validated associations with ERG, PMEPA1 and GPR156 by searching for pedigrees in other cohorts and using bioinformatic and experimental approaches. We provide evidence that (1) loss-of-function variants in the Erythroblast Transformation Specific (ETS)-family transcription factor encoding gene ERG lead to primary lymphoedema, (2) truncating variants in the last exon of transforming growth factor-β regulator PMEPA1 result in Loeys-Dietz syndrome and (3) loss-of-function variants in GPR156 give rise to recessive congenital hearing impairment. The Rareservoir provides a lightweight, flexible and portable system for synthesizing the genetic and phenotypic data required to study rare disease cohorts with tens of thousands of participants.


Conflict of interest statement

The authors declare no competing interests.

Figures

Fig. 1
Fig. 1. BeviMed analysis of the 100KGP.
a, Bars showing the size of each case set used for the genetic association analyses grouped by Disease Group and coloured by type (Disease Sub Group or Specific Disease). Case sets smaller than five are shown as having size 4 to comply with the 100KGP policy on limiting participant identifiability. The names and sizes of the case sets for an exemplar Disease Sub Group, ‘Cardiovascular disorders’, are shown. b, BeviMed PPAs > 0.95 arranged by Disease Group. Only the strongest association for each gene within a Disease Group is shown. Associations are colored by their PanelApp evidence level (green, amber or red). Associations that were mapped to PanelApp by manual review, rather than using our automatic matching algorithm, are marked with an asterisk (Source Data Fig. 1). Previously unidentified associations are shown in grey. The shape of the points shows whether the association was with a Disease Sub Group (squares) or Specific Disease (circles). Source data
Fig. 2
Fig. 2. Loss-of-function variants in ERG are responsible for primary lymphoedema.
a, Pedigrees for the four probands with loss-of-function variants in the canonical transcript of ERG, ENST00000288319.12. Hom. ref., homozygous reference. b, Truncated bar chart showing the distribution of the number of reads supporting the p.S182Afs*22 alternate allele in the 100KGP. The embedded windows show the read pileups at this position in the two affected members of the family with the variant encoding p.S182Afs*22 (het., heterozygous genotype call). The reads supporting the reference allele are in blue and those supporting the variant allele are in red. c, Schematic showing the effects of each variant at the cDNA and amino acid level and on the protein product with respect to the canonical transcript. PNT, pointed domain; ETS, Erythroblast Transformation Specific DNA binding domain; AA, amino acid. d, Reverse transcription PCR amplification of ERG mRNA in HDLECs relative to HUVECs. Data are normalized to GAPDH. Statistical significance was assessed using a two-sided Student’s t test. NS, not significant (P = 0.39). e, Immunoblot (representative of two replicates) of HUVEC and HDLEC protein lysates identified several bands corresponding to ERG isoforms expressed at similar intensities in both cell types. f, Immunofluorescence microscopy (representative of three replicates) of HDLECs shows ERG (green) nuclear colocalization with the lymphatic endothelial cell nuclear marker PROX1 (violet) and the nuclear marker DAPI (blue). HDLEC junctions are shown using an antibody to VE-cadherin (yellow). Scale bar, 50 µm. g, En face immunofluorescence confocal microscopy (representative of five replicates) of mouse ear skin. Vessels are stained with antibodies to the lymphatic marker PROX1 (violet) and ERG (green). Scale bar, 100 µm. h, Exemplar immunofluorescence microscopy image of HEK293 cells overexpressing wild-type ERG and the p.T224Rfs*15 variant ERG. Cells were stained for ERG (green) and nuclear marker DAPI (blue). Scale bars, 20 μm. The brightness is optimized for print. i, Dot plot of the estimated proportion of ERG not overlapping the nuclear marker DAPI in each of a set of immunofluorescence microscopy images of HEK293 cells overexpressing different ERG cDNAs (20 replicates for the wild type (WT), 17 replicates per tested mutant). The estimated proportions were significantly higher in each of the variants compared with WT: P = 1.52 × 10−11, 4.10 × 10−13 and 3.03 × 10−5 for each of p.S182Afs*22, p.T224Rfs*15 and p.A447Cfs*19, respectively (two-sided Student’s t tests). Source data
Fig. 3
Fig. 3. Truncating variants in PMEPA1 result in Loeys–Dietz syndrome.
a, Pedigrees for the three probands in the 100KGP (discovery cohort) heterozygous for the frameshift insertion predicting p.S209Qfs*3 and probands from replication cohorts, including one from the 100KGP Pilot Programme heterozygous for the frameshift deletion predicting p.S209Afs*61, three of Japanese ancestry heterozygous for p.S209Qfs*3 and one Belgian pedigree heterozygous for a frameshift deletion encoding p.P207Qfs*3. All variant consequences are shown with respect to the canonical transcript of PMEPA1, ENST00000341744.8. b, HPO terms present in at least three of the four PMEPA1 FTAAD families, excluding redundant terms within each level of frequency, alongside their frequency in four PMEPA1 FTAAD families and the other 589 unexplained FTAAD families. Terms are ordered by P values obtained by a Fisher exact test of association between the term’s presence in an FTAAD family and whether the family is one of the four PMEPA1 families. Terms were declared significant (indicated by an asterisk) or not significant (NS) by comparing their Fisher test P values and rank with a null distribution of equivalent pairs obtained by permutation (10,000 replicates). For each rank, the P value of the term on the fifth percentile was used as an upper bound for declaring an association significant, provided all terms at higher ranks were also significant. The P values for each term were as follows: ‘Dolichocephaly’, P = 2.9 × 10−4; ‘Abnormal axial skeleton morphology’, P = 6.7 × 10−3; ‘Striae distensae’, P = 0.013; ‘Pes planus’, P = 0.014; ‘Ascending tubular aorta aneurysm’, P = 0.62. c, Graph showing PMEPA1 and genes with high evidence (green) of association with FTAAD in PanelApp. Edges connect genes where the string-db v.11.5 confidence score for physical interactions between corresponding proteins was >0.6. Genes known to be associated with Loeys–Dietz syndrome are highlighted in blue. PMEPA1 is highlighted yellow. d, Schematic showing the effects of each variant at the cDNA and amino acid level and on the protein product.
Fig. 4
Fig. 4. Loss-of-function variants in GPR156 give rise to recessive congenital hearing loss.
a, Schematic of the three pedigrees with cases homozygous or compound heterozygous for loss-of-function variants in the canonical transcript of GPR156, ENST00000464295.6. Blank symbols indicate individuals with an unknown genotype. b, Histograms of expression log fold changes for different sets of genes in mouse hair cells compared with surrounding cells: all mouse genes (left) and mouse genes homologous to their human counterparts in the ‘Hearing loss’ PanelApp panel, stratified by whether they had a stereocilia-related Gene Ontology (GO) term (that is, a term whose name contained ‘stereocilia’ or ‘stereocilium’ or the descendant of such a term) (right). The log fold change for Gpr156 is shown as a horizontal line. c, Maximum intensity projections of confocal Z stacks in the organ of Corti and vestibular system of a P10 wild-type mouse immunostained with GPR156 antibody (green) and counterstained with phalloidin (red). Top row, overview of the organ of Corti and vestibular system. Middle and bottom rows, magnified images of outer hair cells and inner hair cells, respectively. No stereociliary bundle staining was observed. The punctate staining observed in the organ of Corti was absent or significantly decreased in the utricle of the vestibular system. Scale bars, 10 μm (each image is representative of three replicates). d, Schematic showing the effects of each variant at the cDNA and amino acid level and on the protein product. e, Exemplar western blot taken from three replicates of GPR156–GFP using anti-GPR156 antibody in untransfected Cos7 cells (Cos7); Cos7 cells transfected with the wild-type construct (WT); and Cos7 cells transfected with the constructs containing each of the mutant alleles p.S642Afs*162 (S642), p.P718Lfs*86 (P718) and p.S207Vfs*113 (S207). Source data
Extended Data Fig. 1
Extended Data Fig. 1. Reduction in the number of genotypes stored per sample.
For 100 randomly chosen 100KGP participants belonging to each ancestry group (taken from amongst those with an inferred probability >0.9 of belonging): a, boxplots showing the distribution of the number of non-homozygous reference PASSing genotypes for variants on chromosomes 1–22 and X which meet the default Rareservoir MAF filtering criteria (that is a PMAF score >0 using gnomAD v3.0 and internal MAF < 0.002); b, boxplots showing the distribution of the proportion of all PASSing non-homozygous reference genotypes that meet the default Rareservoir MAF filtering criteria. In both plots, the lower, centre and upper lines respectively indicate the lower quartile, median and upper quartile. Whiskers are drawn up to the most extreme points that are less than 1.5× the interquartile range away from the nearest quartile.
Extended Data Fig. 2
Extended Data Fig. 2. General schematic of the database build procedure and contents.
Variants are extracted from VCF files, filtered on internal cohort allele frequency, encoded as 64-bit RSVR IDs and loaded into a table containing the corresponding genotypes. The variants are annotated with scores reflecting their predicted deleteriousness (in this case, CADD scores) and probabilistic minor allele frequency scores (PMAF) from gnomAD. The consequences of each variant with respect to a reference set of transcripts are generated and loaded into a table. Sample information including pedigree membership and membership of a maximal set of unrelated participants is loaded into a table. The case groupings for case/control association analyses are stored in a table.
Extended Data Fig. 3
Extended Data Fig. 3. Detailed schematic of the database build procedure.
Variants may be imported to a Rareservoir from either single gVCF files or a merged VCF file, following the procedures indicated by red and blue arrows respectively.
Extended Data Fig. 4
Extended Data Fig. 4. Schematic showing the variant data in the 100KGP Main Programme Rareservoir.
The number of variant/transcript pairs, the distribution of CADD scores and a breakdown of gnomAD frequency classes is shown for each annotated SO term in the context of the structure of the ontology.
Extended Data Fig. 5
Extended Data Fig. 5. The 269 case sets, Disease Groups A–I.
The names and sizes of the case sets used for the genetic association analyses, grouped by Disease Group and coloured by type (Disease Sub Group or Specific Disease). Disease Sub Groups with only one Specific Disease were excluded to avoid repeating identical analyses. Case sets smaller than 5 are labelled ‘<5’ and shown as having size 4 to comply with 100KGP policy on limiting participant identifiability. For legibility, only Disease Groups starting with the letters A–I are shown here.
Extended Data Fig. 6
Extended Data Fig. 6. The 269 case sets, Disease Groups M–Z.
An extension of Extended Data Fig. 5 showing the case sets in Disease Groups starting with the letters M–Z.
Extended Data Fig. 7
Extended Data Fig. 7. Breakdown of cases attributable to associations with ‘Posterior segment abnormalities’ by Specific Disease.
For each gene associated with the Disease Sub Group ‘Posterior segment abnormalities’, a bar plot showing the number of cases having each of the different Specific Diseases who have an inferred pathogenic configuration of alleles in the gene. This example illustrates that sets of cases with the same etiological gene may be assigned different Specific Diseases. Consequently, pooling cases within Disease Sub Group can boost power.
Extended Data Fig. 8
Extended Data Fig. 8. Microscopy images of HEK293 cells overexpressing ERG.
Exemplar immunofluorescence microscopy images of HEK293 cells overexpressing wild type ERG (from 20 replicates) and each of the p.S182Afs*22, p.T224Rfs*15 and p.A447Cfs*19 variants of ERG (each from 17 replicates). Cells were stained for ERG (green) and nuclear marker DAPI (blue). Scale bar, 20μm.
Extended Data Fig. 9
Extended Data Fig. 9. Illustrative audiograms for GPR156 cases.
Air and bone conduction audiograms for the two affected daughters of the family with compound heterozygous GPR156 truncating alleles.

References

    1. Boycott KM, et al. International cooperation to enable the diagnosis of all rare genetic diseases. Am. J. Hum. Genet. 2017;100:695–705. doi: 10.1016/j.ajhg.2017.04.003. - DOI - PMC - PubMed
    1. Ferreira CR. The burden of rare diseases. Am. J. Med Genet A. 2019;179:885–892. doi: 10.1002/ajmg.a.61124. - DOI - PubMed
    1. Turro E, et al. Whole-genome sequencing of patients with rare diseases in a national health system. Nature. 2020;583:96–102. doi: 10.1038/s41586-020-2434-2. - DOI - PMC - PubMed
    1. Wang Q, et al. Rare variant contribution to human disease in 281,104 UK Biobank exomes. Nature. 2021;597:527–532. doi: 10.1038/s41586-021-03855-y. - DOI - PMC - PubMed
    1. Kaplanis J, et al. Evidence for 28 genetic disorders discovered by combining healthcare and research data. Nature. 2020;586:757–762. doi: 10.1038/s41586-020-2832-5. - DOI - PMC - PubMed

Publication types