. 2023 Mar;13(3):e1215.
doi: 10.1002/ctm2.1215.

Gestational weight gain in pregnant women with obesity is associated with cord blood DNA methylation, which partially mediates offspring anthropometrics

Affiliations

Gestational weight gain in pregnant women with obesity is associated with cord blood DNA methylation, which partially mediates offspring anthropometrics

Josefine Jönsson et al. Clin Transl Med. 2023 Mar.
No abstract available

Keywords: birthweight; epigenetics; fetal programming; lean mass.


Figures
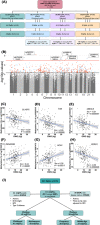
FIGURE 1
FIGURE 1
(A) We performed four linear regression models, including different covariates and adjustments for cell‐type composition, investigating the association between gestational weight gain (GWG) and cord blood DNA methylation. Model 1 adjusted for covariates: maternal age (years), pre‐pregnancy body mass index (BMI; kilograms per meter squared), lifestyle intervention (yes/no), gestational age (GA; days), and offspring sex, and adjustment for cell‐type composition using the reference‐free method from Houseman et al., Model 2 unadjusted model, Model 3 adjusted for covariates as above but not for cell‐type composition, Model 4 adjusted for covariates as above and adjustment for cell‐type composition using a reference‐based method. There are different methods adjusting for cell‐type composition (e.g. reference‐based versus reference‐free), which have their pros and cons. Therefore, both methods (Model 1 and 4) were used in this study showing similar results. (B) A Manhattan plot, representing the distribution of methylation sites across the genome, for the association between GWG and DNA methylation in cord blood from the offspring, after adjustment for covariates and cell‐type composition adjustment (Model 1). The bottom (black) line indicates the FDR‐adjusted P‐value threshold (q < 0.05), of which 441 sites surpassed, and the top (red) line indicates the Bonferroni threshold (1.085199 × 10−07, i.e., 0.05/460,745) of which six sites surpassed (based on Model 1). We used both Benjamini‐Hochberg and Bonferroni to correct for multiple testing. This was done because, in epigenome‐wide association studies (EWAS), Bonferroni is known to be too conservative due to correlating DNA methylation values at nearby sites and the non‐variability of several sites on the array. Whereas the potentially more powerful method, the Benjamini‐Hochberg adjustment may produce some false‐positive results. Methylation sites surpassing the FDR threshold (FDR less than 5%, q < 0.05) are highlighted in colour; red is hypermethylated, and blue is hypomethylated. Hyper‐/hypomethylation is based on beta coefficients from model 2, an unadjusted model without cell‐type composition adjustment. Data are also presented in Table S1. Spearman correlation plots of the six sites that remained statistically significant after Bonferroni correction (P < 1.085199 × 10−07) in Model 1; (C) cg01704198 in the gene body of CLASP2, rho =−0.20, P = 0.0038; (D) cg10383019, in the gene body of TUB, rho =−0.25, P = 0.00026; (E) cg13303461 in the promoter region of UBE2L6, rho =−0.31, P = 0.0000057; (F) cg19152518 in the 1st Exon and 5’ untranslated region of DENND5B, rho = 0.24, P = 0.00051; (G) cg19697475, in the promotor region of HCN1, rho = 0.26, P = 0.00017; and (H) cg22950754 in the promotor region of PDRG1, rho =−0.33, P = 0.0000009. (I) Presents previously identified mQTLs of DNA methylation sites in cord blood, which we found associated with GWG. Several of these mQTLs are associated with traits in published GWAS and EWAS, for example, asthma, birthweight, BMI, and type 2 diabetes. Part of the identified mQTLs in cord blood was also identified in children and mothers (whole blood). These data are also presented in Tables S2–S5. Abbreviations: CpGs, DNA methylation sites; DXA, Dual‐energy X‐ray absorptiometry; EWAS, epigenome‐wide association studies; FDR, false discovery rate; GWAS, genome‐wide association studies; GWG, gestational weight gain; mQTL, methylation Quantitative Trait Loci.
FIGURE 2
FIGURE 2
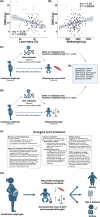
Spearman correlation plots of GWG (kg) and (A) lean mass (%), rho =−0.29, P = 0.00052 and (B) birthweight (g), rho = 0.24, P = 0.00058. Causal mediation analyses were performed using the discovered GWG‐associated DNA methylation sites to investigate whether DNA methylation in cord blood of these sites is part of a pathway through which GWG exerts its effects on (C) lean mass and (D) birthweight. Here (C and D), we show the scheme tested by the causal mediation analysis and the potential mechanisms linking GWG and offspring anthropometric measurements. The solid blue arrow represents the effect of GWG on offspring anthropometric measurements that operate directly (ADE) or through a pathway different from the mediator analyzed in the current study (DNA methylation in cord blood). The dotted blue arrows represent a suggested alternative pathway, where an indirect effect (ACME) of GWG on offspring anthropometric measurements is mediated by cord blood DNA methylation. The effect is estimated for each association between GWG (exposure) and lean mass (62 sites) or birthweight (21 sites) (outcome(s)) using the 441 discovered GWG‐associated DNA methylation sites in cord blood. DNA methylation of each respective site was chosen as the mediator. (E) presents the six sites, and their annotated gene (cg02903589, in the gene body of KDM1B; cg02903822, in the 5’UTR/1st Exon of CCN4; cg04107318, pseudogene; cg06164059, annotated to MUC5AC; cg18115757, intergenic; and cg22950754, in the promotor of PDRG1), that are suggested to partially mediate the effect of GWG on both offspring lean mass and birthweight. Models regarding lean mass were adjusted for lifestyle intervention, maternal smoking during pregnancy, gestational age, and offspring sex. Models regarding offspring birthweight were adjusted for gestational age and parity. Created with BioRender.com. (F) Presents some observed Strengths and Limitations in this work. (G) Hypothesized pathway linking maternal GWG to intrauterine metabolic programming, mediated by DNA methylation, which in turn may affect anthropometric measurements of importance for the future health of the offspring and finally lead to increased risk of developing obesity, type 2 diabetes, and asthma in the offspring. Created with BioRender.com. Abbreviations: GWG, gestational weight gain; ACME, average causal mediator effect; ADE, average direct effect; rho, Spearman correlation coefficient.

References

    1. Rasmussen KM, Yaktine AL, eds. Weight Gain During Pregnancy: Reexamining the Guidelines . National Academies Press (US); 2009. - PubMed
    1. Franzago M, Fraticelli F, Stuppia L, Vitacolonna E. Nutrigenetics, epigenetics and gestational diabetes: consequences in mother and child. Epigenetics. 2019;14(3):215‐135. - PMC - PubMed
    1. Sharp GC, Lawlor DA, Richmond RC, et al. Maternal pre‐pregnancy BMI and gestational weight gain, offspring DNA methylation and later offspring adiposity: findings from the Avon Longitudinal Study of Parents and Children. Int J Epidemiol. 2015;44(4):1288‐1304. - PMC - PubMed
    1. Bohlin J, Andreassen BK, Joubert BR, et al. Effect of maternal gestational weight gain on offspring DNA methylation: a follow‐up to the ALSPAC cohort study. BMC Res Notes. 2015;8:321. - PMC - PubMed
    1. Morales E, Groom A, Lawlor DA, Relton CL. DNA methylation signatures in cord blood associated with maternal gestational weight gain: results from the ALSPAC cohort. BMC Res Notes. 2014;7:278. - PMC - PubMed

LinkOut - more resources