. 2023 Mar 16;8(1):18.
doi: 10.1186/s41235-023-00466-1.

Restricting the distribution of visual attention reduces cybersickness

Affiliations

Restricting the distribution of visual attention reduces cybersickness

Sai Ho Yip et al. Cogn Res Princ Implic. .

Erratum in

Abstract

This study investigated whether increased attention to the central or peripheral visual field can reduce motion sickness in virtual reality (VR). A recent study found that increased attention to the periphery during vection was correlated with lower self-reported motion sickness susceptibility, which suggests that peripheral attention might be beneficial for avoiding cybersickness. We tested this experimentally by manipulating visual attention to central vs. peripheral fields during VR exposure. We also measured attention to the periphery during vection and motion sickness susceptibility to attempt to replicate the previous results. In Experiment 1, task-relevant cues to target locations were provided in the central or peripheral field during navigation in VR, and we found no differences in motion sickness. In Experiment 2, attention to the center or periphery was manipulated with a dot-probe task during passive VR exposure, and we found that motion sickness was greater in the condition that required attention to the periphery. In both experiments, there was no correlation between baseline attentional allocation and self-reported motion sickness susceptibility. Our results demonstrate that restricting attention to the central visual field can decrease cybersickness, which is consistent with previous findings that cybersickness is greater with large FOV.

Keywords: Cybersickness; MSSQ; Misery scale; SSQ; Simulator sickness; Virtual reality; Visual attention; Visually induced motion sickness.


Conflict of interest statement

The authors have no commercial relationships and no conflicts of interest.

Figures

Fig. 1
Fig. 1
Screenshots from the central-cued and peripheral-cued conditions of Experiment 1 (top) and Experiment 2 (bottom). In Experiment 1, subjects navigated in a virtual environment to find targets chests that were obscured by bushes. The chests were sometimes highlighted in red depending on their position and the attentional cueing condition. In the central-cued condition (top left), targets were highlighted when their direction was within 10° of the central direction and less than 50 m away. In the peripheral-cued condition (top right), targets were highlighted when they were at least 40° to the left or right of the center and less than 50 m away. In Experiment 2, subjects passively viewed simulated movement through an environment while performing dot-probe task. In the central-cued condition (bottom left), the superimposed dots appeared within 5° of the center of the display. In the peripheral-cued condition (bottom right), the dots appeared in an annulus between 20 and 30° from the center
Fig. 2
Fig. 2
The Sustained Attention to Response Task (SART). Subjects fixated at a center point and a field of random dots rotated around the center. At random intervals, a red/green dot would appear either in the central region or the peripheral region
Fig. 3
Fig. 3
Percent of subjects who completed each of the virtual navigation blocks in Experiment 1. The procedure was stopped if subjects reported more than mild motion sickness symptoms (>6 on MISC scale). Less than half of the subjects were able to complete the full 8 min of exposure
Fig. 4
Fig. 4
Motion sickness in the central-cued (red) vs peripheral-cued (blue) conditions of Experiment 1. The left graph plots mean MISC scores. The right graph plots mean SSQ scores after transforming by log10(SSQ/10 + 1). Pre-exposure SSQ scores are shown in gray. Error bars depict standard errors of the mean
Fig. 5
Fig. 5
Self-reported motion sickness susceptibility (MSSQ) of individual subjects in Experiment 1 plotted as a function of their attentional allocation scores derived from SART. The attentional allocation score is the mean difference in reaction times for peripheral and central targets: ΔRT = RTCVF − RTPVF. Positive values of ΔRT correspond to more attention to the periphery. Lines show the regression fits. The left graph plots the total MSSQ scores, and the middle and right graphs plot the MSSQ child and MSSQ adult subscores
Fig. 6
Fig. 6
Cybersickness experienced by individual subjects during virtual navigation in Experiment 1 plotted as a function of their attentional allocation scores derived from SART (ΔRT = RTCVF − RTPVF). Positive values of ΔRT correspond to more attention to the periphery. Lines show the regression fits. The left graph plots the MISC scores and the right graph plots the SSQ scores after transforming by log10(SSQ/10 + 1)
Fig. 7
Fig. 7
Cybersickness experienced by individual subjects in Experiment 1 plotted as a function of self-reported motion sickness susceptibility (MSSQ total). Lines show the regression fits. The left graph plots the MISC scores and right graph plots the SSQ after transforming by log10(SSQ/10 + 1)
Fig. 8
Fig. 8
Percent of subjects who completed each of the VR exposure blocks in Experiment 2. The procedure was stopped if subjects reported more than mild motion sickness symptoms (>6 on MISC scale). Over 75% of the subjects were able to complete the full 8 min of exposure
Fig. 9
Fig. 9
Motion sickness in the central-cued (red) vs peripheral-cued (blue) conditions of Experiment 2. The left graph plots mean MISC scores. The right graph plots mean SSQ scores after transforming by log10(SSQ/10 + 1). Pre-exposure SSQ scores are shown in gray. Error bars depict standard errors of the mean
Fig. 10
Fig. 10
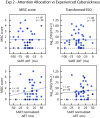
Self-reported motion sickness susceptibility (MSSQ) of individual subjects in Experiment 2 plotted as a function of their attentional allocation scores derived from SART. The two rows use different measures of attentional allocation: the mean difference in reaction times for central and peripheral targets with coherent background motion (top row), or the mean difference after normalizing for reaction times in the incoherent motion conditions (bottom row). Positive values of ΔRT correspond to more attention to the periphery. Lines show the regression fits. The left graph plots the total MSSQ scores, and the middle and right graphs plot the MSSQ child and MSSQ adult subscores
Fig. 11
Fig. 11
Cybersickness experienced by individual subjects during virtual navigation in Experiment 2 plotted as a function of their attentional allocation scores. The two rows use different measures of attentional allocation: the mean difference in reaction times for central and peripheral targets with coherent background motion (top row), or the mean difference after normalizing for reaction times in the incoherent motion conditions (bottom row). Positive values of ΔRT correspond to more attention to the periphery. Lines show the regression fits. The left graph plots the MISC scores and the right graph plots the SSQ scores after transforming by log10(SSQ/10 + 1)
Fig. 12
Fig. 12
Cybersickness experienced by individual subjects in Experiment 2 plotted as a function of self-reported motion sickness susceptibility (MSSQ total). Lines show the regression fits. The left graph plots the MISC scores and right graph plots the SSQ after transforming by log10(SSQ/10 + 1)

References

    1. Bos JE. Less sickness with more motion and/or mental distraction. Journal of Vestibular Research. 2015;25(1):23–33. doi: 10.3233/ves-150541. - DOI - PubMed
    1. Bos, J. E., MacKinnon, S., & Patterson, A. (2005). Motion sickness symptoms in a ship motion simulator: Effects of inside, outside and no view. Aerospace Medicine and Human Performance, 76(12), 1111–1118. - PubMed
    1. Botella J, Ximénez C, Revuelta J, Suero M. Optimization of sample size in controlled experiments: The CLAST rule. Behavior Research Methods. 2006;38(1):65–76. doi: 10.3758/BF03192751. - DOI - PubMed
    1. Brandt T, Bartenstein P, Janek A, Dieterich M. Reciprocal inhibitory visual-vestibular interaction. Visual motion stimulation deactivates the parieto-insular vestibular cortex. Brain: A Journal of Neurology. 1998;121(9):1749–1758. doi: 10.1093/brain/121.9.1749. - DOI - PubMed
    1. Brandt T, Glasauer S, Stephan T, Bense S, Yousry TA, Deutschländer A, Dieterich M. Visual-vestibular and visuo-visual cortical interaction: New insights from fMRI and PET. Annals of the New York Academy of Sciences. 2002;956(1):230–241. doi: 10.1111/j.1749-6632.2002.tb02822.x. - DOI - PubMed

Publication types

LinkOut - more resources