. 2023 Jun;66(6):1024-1034.
doi: 10.1007/s00125-023-05898-4. Epub 2023 Mar 17.

Significant impact of time-of-day variation on metformin pharmacokinetics

Affiliations

Significant impact of time-of-day variation on metformin pharmacokinetics

Denise Türk et al. Diabetologia. 2023 Jun.

Abstract

Aims/hypothesis: The objective was to investigate if metformin pharmacokinetics is modulated by time-of-day in humans using empirical and mechanistic pharmacokinetic modelling techniques on a large clinical dataset. This study also aimed to generate and test hypotheses on the underlying mechanisms, including evidence for chronotype-dependent interindividual differences in metformin plasma and efficacy-related tissue concentrations.

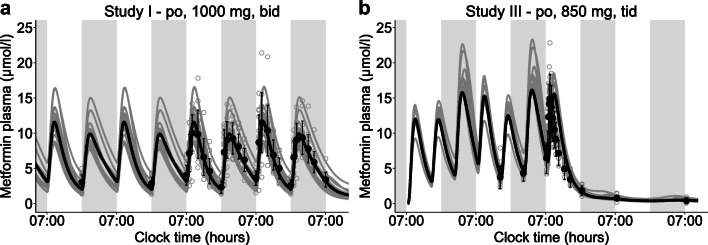
Methods: A large clinical dataset consisting of individual metformin plasma and urine measurements was analysed using a newly developed empirical pharmacokinetic model. Causes of daily variation of metformin pharmacokinetics and interindividual variability were further investigated by a literature-informed mechanistic modelling analysis.

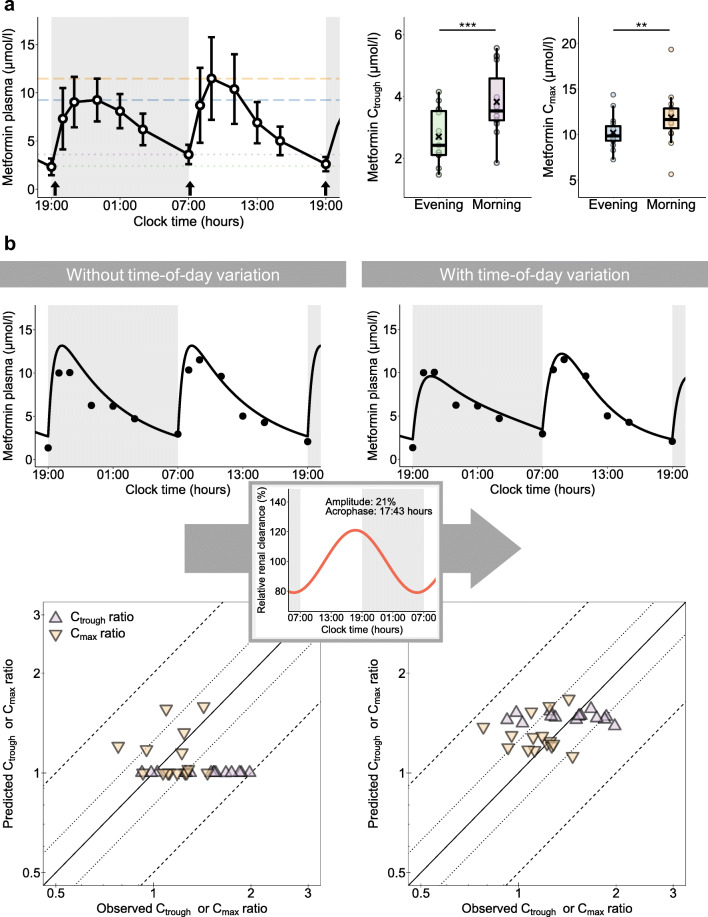
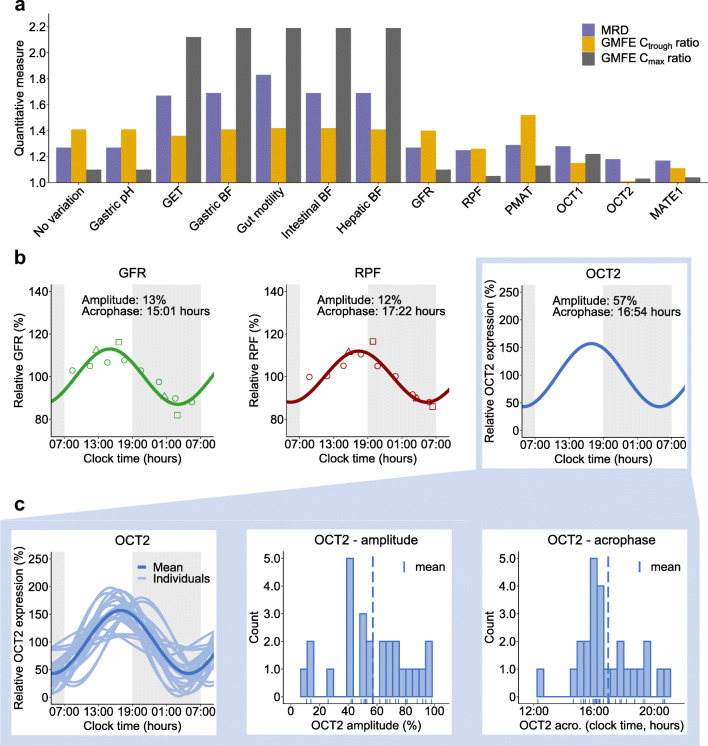
Results: A significant effect of time-of-day on metformin pharmacokinetics was found. Daily rhythms of gastrointestinal, hepatic and renal processes are described in the literature, possibly affecting drug pharmacokinetics. Observed metformin plasma levels were best described by a combination of a rhythm in GFR, renal plasma flow (RPF) and organic cation transporter (OCT) 2 activity. Furthermore, the large interindividual differences in measured metformin concentrations were best explained by individual chronotypes affecting metformin clearance, with impact on plasma and tissue concentrations that may have implications for metformin efficacy.

Conclusions/interpretation: Metformin's pharmacology significantly depends on time-of-day in humans, determined with the help of empirical and mechanistic pharmacokinetic modelling, and rhythmic GFR, RPF and OCT2 were found to govern intraday variation. Interindividual variation was found to be partly dependent on individual chronotype, suggesting diurnal preference as an interesting, but so-far underappreciated, topic with regard to future personalised chronomodulated therapy in people with type 2 diabetes.

Keywords: Chronopharmacology; Empirical modelling; Mechanistic modelling; Metformin; Pharmacokinetics; Renal excretion; Transporter.


Figures

Fig. 1
Fig. 1
Investigation of daytime-dependent metformin pharmacokinetics with concentration measurements from study I [7]. (a) Statistically significant differences between trough plasma concentrations (Ctrough) measured in the morning compared with the evening and maximum plasma concentrations (Cmax) measured in the morning compared with the evening were found. Data are shown as arithmetic means ± SD. Metformin administration (1000 mg twice daily) is indicated by arrows. Grey areas indicate night-time. In the box plots, mean Ctrough and Cmax values are indicated by crosses, individual values (n=15) by dots. Boxes represent the distance between first and third quartiles (IQR). Whiskers range from smallest to highest value (<1.5 × IQR). **p<0.01; ***p<0.001. (b) Performance of the NLME model without and with time-of-day variation via the estimated oscillation function (insert and Equation 1) applied on clearance. Representative individual plasma concentration–time profiles (n=1) are plotted after twice daily administration of 1000 mg metformin. Dots indicate observed data and lines indicate model predictions. Goodness-of-fit plots show comparisons of all predicted and observed individual Ctrough and Cmax ratios after twice daily administration of 1000 mg metformin. The straight solid line marks the line of identity, dotted lines indicate 1.25-fold and dashed lines indicate twofold deviations
Fig. 2
Fig. 2
Implementation of a daily rhythm in the metformin PBPK model. (a) Hypothesis testing. Rhythmic physiological processes and transporter activities tested using the PBPK model with the respective prediction performance metrics, i.e. MRDs and GMFEs. (b, c) Final PBPK model processes with rhythmic excretion. (b) Time-of-day variation of GFR and RPF as reported in the literature [–20] (measurements from different reports indicated by dots, triangles and squares) and OCT2 implemented in the final PBPK model. (c) Rhythm of OCT2 was optimised with the PBPK model for each individual, and individual OCT2 parametrisation is shown as distribution of individually optimised OCT2 amplitudes and acrophases (n=26). acro, acrophase; BF, blood flow; GET, gastric emptying time
Fig. 3
Fig. 3
Mean (black lines) and individual (grey lines) PBPK model predictions of metformin plasma concentration–time profiles compared with measurements from (a) study I (n=15) and (b) study III (n=11) [7, 39]. Closed black dots indicate arithmetic means ± SD, open grey dots indicate individual measurements. Grey areas indicate night-time. bid, twice daily; po, oral; tid, three times daily
Fig. 4
Fig. 4
PBPK model simulations of plasma and tissue concentration–time profiles of an oral administration of three-times daily 1000 mg metformin (highest recommended dose according to the German prescribing information [21]) at 07:00, 15:00 and 23:00 hours (indicated by arrows). (ae) Comparison of metformin levels in (a) plasma, (b) kidney tissue, (c) liver tissue, (d) fat tissue and (e) muscle tissue. Respective simulations with a mean parameter set of OCT2 kcat, amplitude and acrophase are shown as dark lines, simulations with individual parameter sets (n=26) are shown as light lines. Grey areas indicate night-time. (f) Comparison of metformin peak-to-trough ratios for simulations in plasma and tissues. The three box plots per tissue give peak-to-trough ratios after metformin administration at 07:00, 15:00 and 23:00 hours. Dots (peak 1), triangles (peak 2) and squares (peak 3) show individual peak-to-trough ratios (n=26), crosses indicate mean values. Boxes represent the distance between first and third quartiles (IQR). Whiskers range from smallest to highest value (<1.5 × IQR)

Comment in

References

    1. American Diabetes Association 9. Pharmacologic approaches to glycemic treatment: Standards of medical care in diabetes—2020. Diabetes Care. 2020;43(Supplement 1):S98–S110. doi: 10.2337/dc20-S009. - DOI - PubMed
    1. McCreight LJ, Bailey CJ, Pearson ER. Metformin and the gastrointestinal tract. Diabetologia. 2016;59(3):426–435. doi: 10.1007/s00125-015-3844-9. - DOI - PMC - PubMed
    1. Rena G, Hardie DG, Pearson ER. The mechanisms of action of metformin. Diabetologia. 2017;60(9):1577–1585. doi: 10.1007/s00125-017-4342-z. - DOI - PMC - PubMed
    1. Galuska D, Nolte LA, Zierath JR, Wallberg-Henriksson H. Effect of metformin on insulin-stimulated glucose transport in isolated skeletal muscle obtained from patients with NIDDM. Diabetologia. 1994;37(8):826–832. doi: 10.1007/BF00404340. - DOI - PubMed
    1. Coyle C, Cafferty FH, Vale C, Langley RE (2016) Metformin as an adjuvant treatment for cancer: a systematic review and meta-analysis. Ann Oncol 27(12):2184–2195. 10.1093/annonc/mdw410 - PMC - PubMed

Publication types