. 2023 Mar 17;85(5):32.
doi: 10.1007/s11538-023-01130-x.

COVID-19 Vaccination and Healthcare Demand

Affiliations

COVID-19 Vaccination and Healthcare Demand

Matthew I Betti et al. Bull Math Biol. .

Abstract

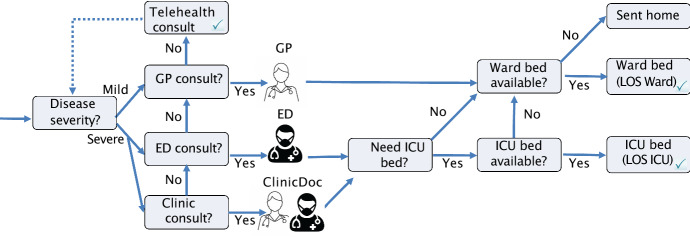
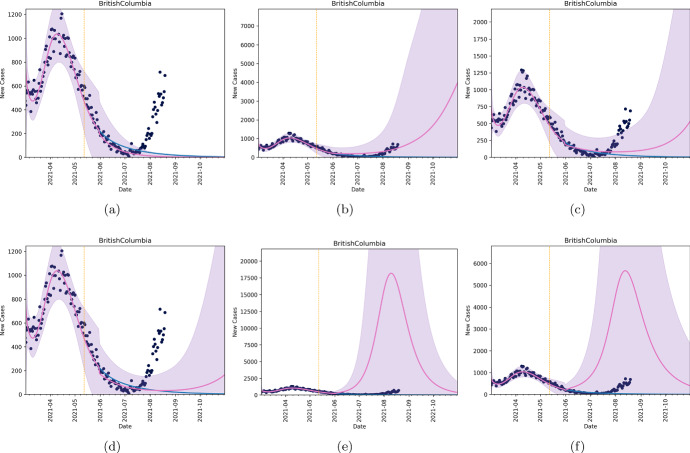
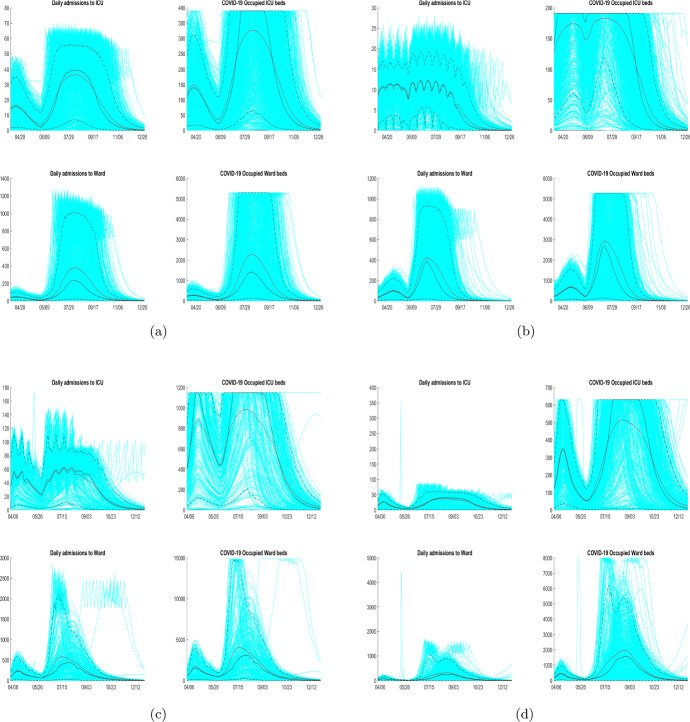
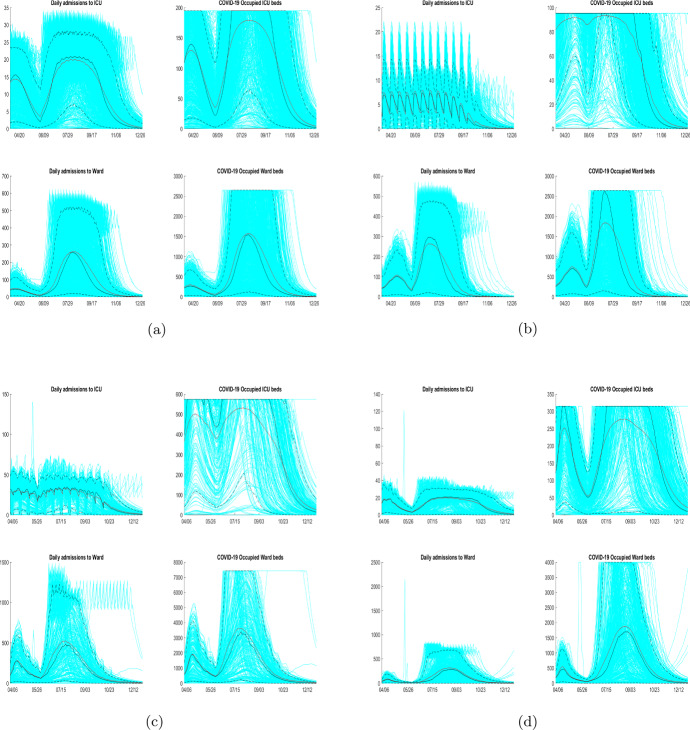
One of the driving concerns during any epidemic is the strain on the healthcare system. As we have seen many times over the globe with the COVID-19 pandemic, hospitals and ICUs can quickly become overwhelmed by cases. While strict periods of public health mitigation have certainly helped decrease incidence and thus healthcare demand, vaccination is the only clear long-term solution. In this paper, we develop a two-module model to forecast the effects of relaxation of non-pharmaceutical intervention and vaccine uptake on daily incidence, and the cascade effects on healthcare demand. The first module is a simple epidemiological model which incorporates non-pharmaceutical intervention, the relaxation of such measures and vaccination campaigns to predict caseloads into the Fall of 2021. This module is then fed into a healthcare module which can forecast the number of doctor visits, the number of occupied hospital beds, number of occupied ICU beds and any excess demand of these. From this module, we can also estimate the length of stay of individuals in ICU. For model verification and forecasting, we use the four most populous Canadian provinces as a case study.

Keywords: COVID-19; Healthcare demand; Public health mitigation; Vaccination.


Figures

Fig. 1
Fig. 1
COVID-19 cases and vaccination in Canada. (left) New reported cases per day. The green shaded regions generally correspond to strict public health lockdowns in Canada’s three largest provinces (Ontario, Quebec, and British Columbia). The red shaded region is the time period after a relaxation of public health measures (e.g. reopening of schools, non-essential retail, construction, etc.). (right) Total vaccine doses administered. We see that by May 23, 2021, roughly 57% of Canadians have had at least one dose of a COVID-19 vaccine. Note the slow start of the vaccination program in late 2020 into early 2021 (Color figure online)
Fig. 2
Fig. 2
Clinical pathways flow diagram. Adapted from Moss et al. (2020a) (Color figure online)
Fig. 3
Fig. 3
Forecasts in British Columbia under six different scenarios. In all scenarios, the blue line corresponds to Model (1) with Eq. (2). Black dots are data, and the vertical line is the last date used for model fitting. The pink line (and purple shaded region) corresponds to the mean and confidence intervals for six different scenarios under Model (4), with Eqs. (5) and (6). The scenarios are implemented in early June. (scenario a) no NPI relaxation, τ=, (scenario b) no change in vaccination, V(t)=0, and NPI relaxation with θ=10, (scenario c) a combination of vaccination and relaxation assuming starting in early June, (scenario d) the same as in scenario (c), but with E=0.8. Scenario (e) shows relaxation with no vaccination with parameter θ=1. Scenario (f) shows the combined effects of vaccination and relaxation with E=0.6 and θ=1 (Color figure online)
Fig. 4
Fig. 4
Forecasts in Alberta under four different scenarios. In all scenarios, the blue line corresponds to Model (1) with Eq. (2). Black dots are data and the vertical line is the last date used for model fitting. The pink line (and purple shaded region) corresponds to the mean and confidence intervals for six different scenarios under Model (4), with Eqs. (5) and (6). The scenarios are implemented in early June. (scenario a) no NPI relaxation, τ=, (scenario b) no change in vaccination, V(t)=0, and NPI relaxation with θ=10, (scenario c) a combination of vaccination and relaxation assuming starting in early June, (scenario d) the same as in scenario (c), but with E=0.8. Scenario (e) shows relaxation with no vaccination with parameter θ=1. Scenario (f) shows the combined effects of vaccination and relaxation with E=0.6 and θ=1 (Color figure online)
Fig. 5
Fig. 5
Forecasts in Ontario under six different scenarios. In all scenarios, the blue line corresponds to Model (1) with Eq. (2). Black dots are data, and the vertical line is the last date used for model fitting. The pink line (and purple shaded region) corresponds to the mean and confidence intervals for six different scenarios under Model (4), with Eqs. (5) and (6). The scenarios are implemented in early June. (scenario a) no NPI relaxation, τ=, (scenario b) no change in vaccination, V(t)=0, and NPI relaxation with θ=10, (scenario c) a combination of vaccination and relaxation assuming starting in early June, (scenario d) the same as in scenario (c), but with E=0.8. Scenario (e) shows relaxation with no vaccination with parameter θ=1. Scenario (f) shows the combined effects of vaccination and relaxation with E=0.6 and θ=1 (Color figure online)
Fig. 6
Fig. 6
Forecasts in Quebec under six different scenarios. In all scenarios, the blue line corresponds to Model (1) with Eq. (2). Black dots are data and the vertical line is the last date used for model fitting. The pink line (and purple shaded region) correspond to the mean and confidence intervals for six different scenarios under Model (4), with Eqs. (5) and (6). The scenarios are implemented in early June. (scenario a) no NPI relaxation, τ=, (scenario b) no change in vaccination, V(t)=0, and NPI relaxation with θ=10, (scenario c) a combination of vaccination and relaxation assuming starting in early June, (scenario d) the same as in scenario (c), but with E=0.8. Scenario (e) shows relaxation with no vaccination with parameter θ=1. Scenario (f) shows the combined effects of vaccination and relaxation with E=0.6 and θ=1 (Color figure online)
Fig. 7
Fig. 7
Daily admission and occupancy of ICU and Ward beds, by province, assuming 50% maximum bed availability, for Model (4), with Eqs. (5) and (6), with E=0.6 and θ=1—Scenario (e). (panel a) BC, (panel b) AB, (panel c) ON, (panel d) QC. The daily admissions (left column) and occupancy (right column) of ICU (top row) and Ward (bottom row) beds is shown for the provincial best match LOS—see Table 2. Results from April 1 to December 31, 2021 are shown. Admissions for each simulation are shown (light blue lines), with median (black line) and mean (red line) (Color figure online)
Fig. 8
Fig. 8
Daily admissions and occupancy of ICU and Ward beds, by province, assuming 25% maximum bed availability, for Model (4), with Eqs. (5) and (6), with E=0.6 and θ=1—Scenario (e). (panel a) BC, (panel b) AB, (panel c) ON, (panel d) QC. The daily admissions (left column) and occupancy (right column) of ICU (top row) and Ward (bottom row) beds is shown for the provincial best match LOS—see Table 2. Results from April 1 to December 31, 2021 are shown. Admissions for each simulation are shown (light blue lines), with median (black line) and mean (red line) (Color figure online)

References

    1. Badr HS, Du H, Marshall M, Dong E, Squire MM, Gardner LM. Association between mobility patterns and covid-19 transmission in the USA: a mathematical modelling study. Lancet Infect Dis. 2020;20(11):1247–1254. doi: 10.1016/S1473-3099(20)30553-3. - DOI - PMC - PubMed
    1. Barrett K, Khan YA, Mac S, Ximenes R, Naimark DM, Sander B. Estimation of covid-19-induced depletion of hospital resources in Ontario, Canada. CMAJ. 2020;192(24):E640–E646. doi: 10.1503/cmaj.200715. - DOI - PMC - PubMed
    1. Berry I, Soucy J-PR, Tuite A, Fisman D. Open access epidemiologic data and an interactive dashboard to monitor the covid-19 outbreak in canada. CMAJ. 2020;192(15):E420–E420. doi: 10.1503/cmaj.75262. - DOI - PMC - PubMed
    1. Betti MI, Heffernan JM. A simple model for fitting mild, severe, and known cases during an epidemic with an application to the current sars-cov-2 pandemic. Infect Dis Model. 2021;6:313–323. - PMC - PubMed
    1. Betti M, Bragazzi N L, Heffernan J, Kong J, Raad A (2021) Integrated vaccination and non-pharmaceutical interventions based strategies in Ontario, Canada, as a case study: a mathematical modeling study. Interface - PMC - PubMed

Substances