. 2023 Mar 15;9(11):eade1685.
doi: 10.1126/sciadv.ade1685. Epub 2023 Mar 17.

Ventilation of the deep Gulf of Mexico and potential insights to the Atlantic Meridional Overturning Circulation

Affiliations

Ventilation of the deep Gulf of Mexico and potential insights to the Atlantic Meridional Overturning Circulation

Rainer M W Amon et al. Sci Adv. .

Abstract

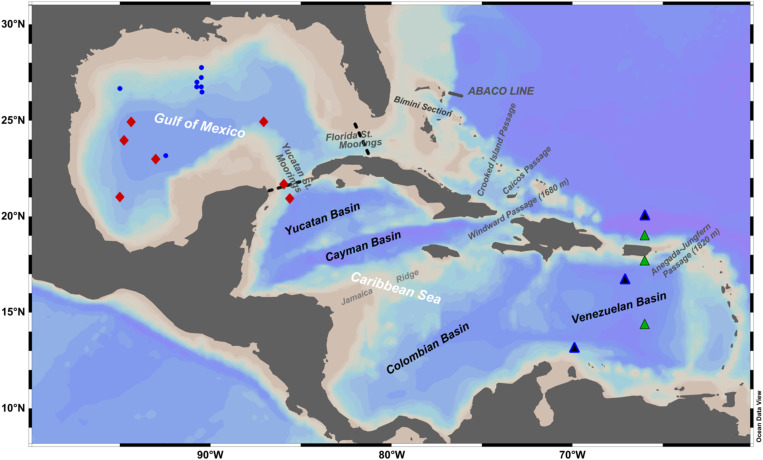
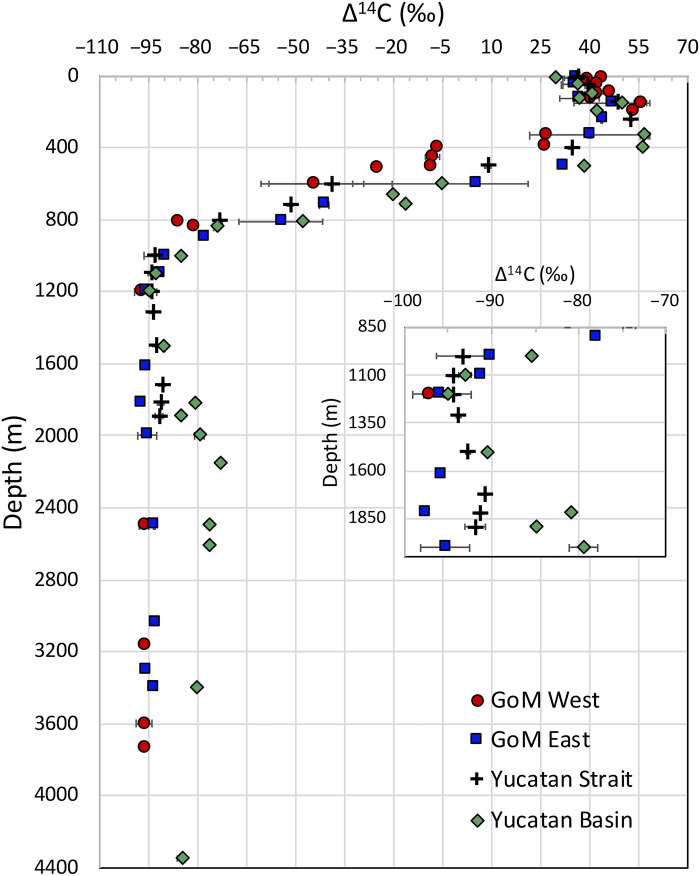
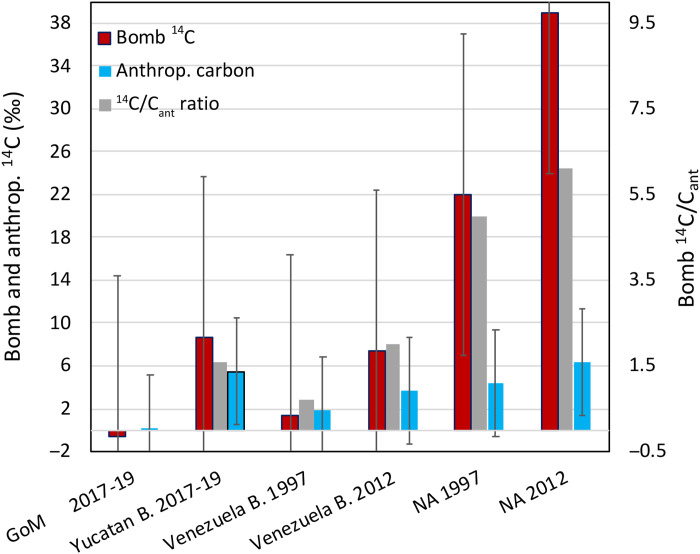
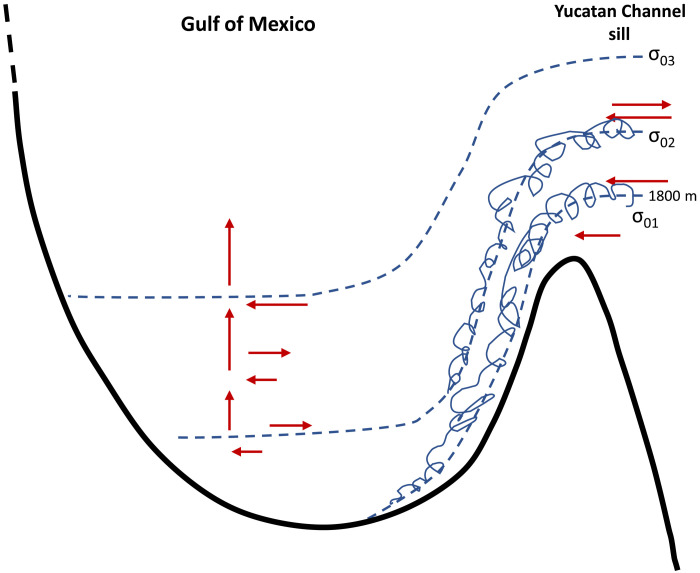
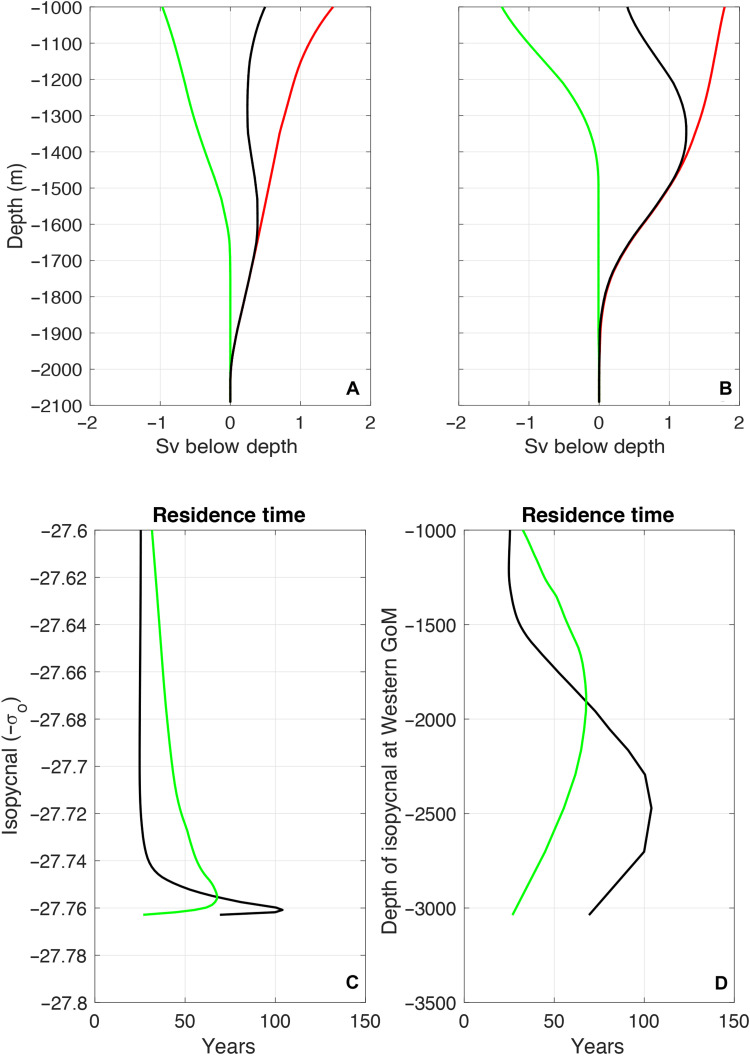
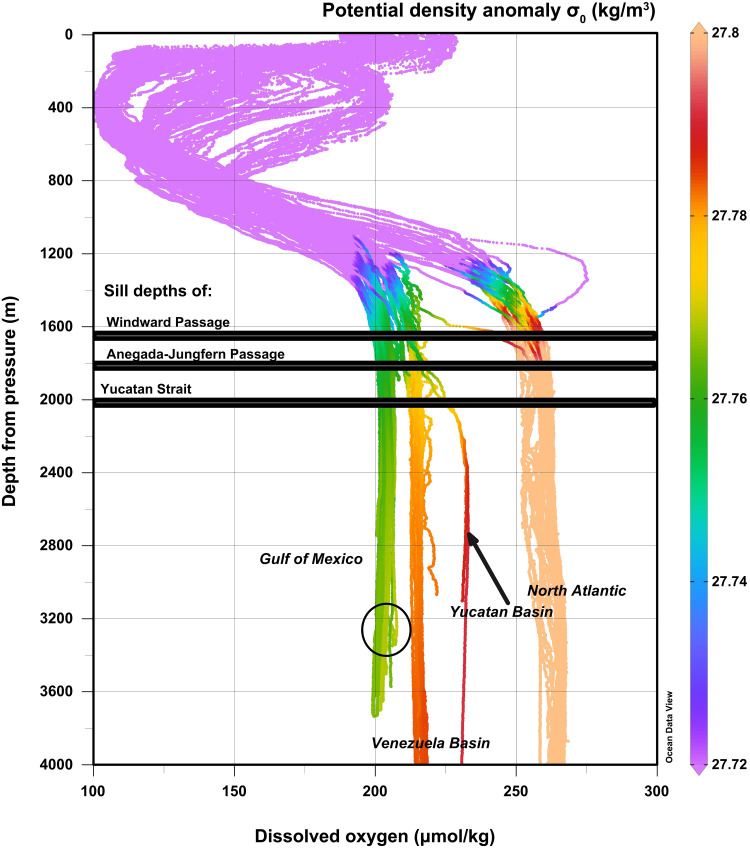
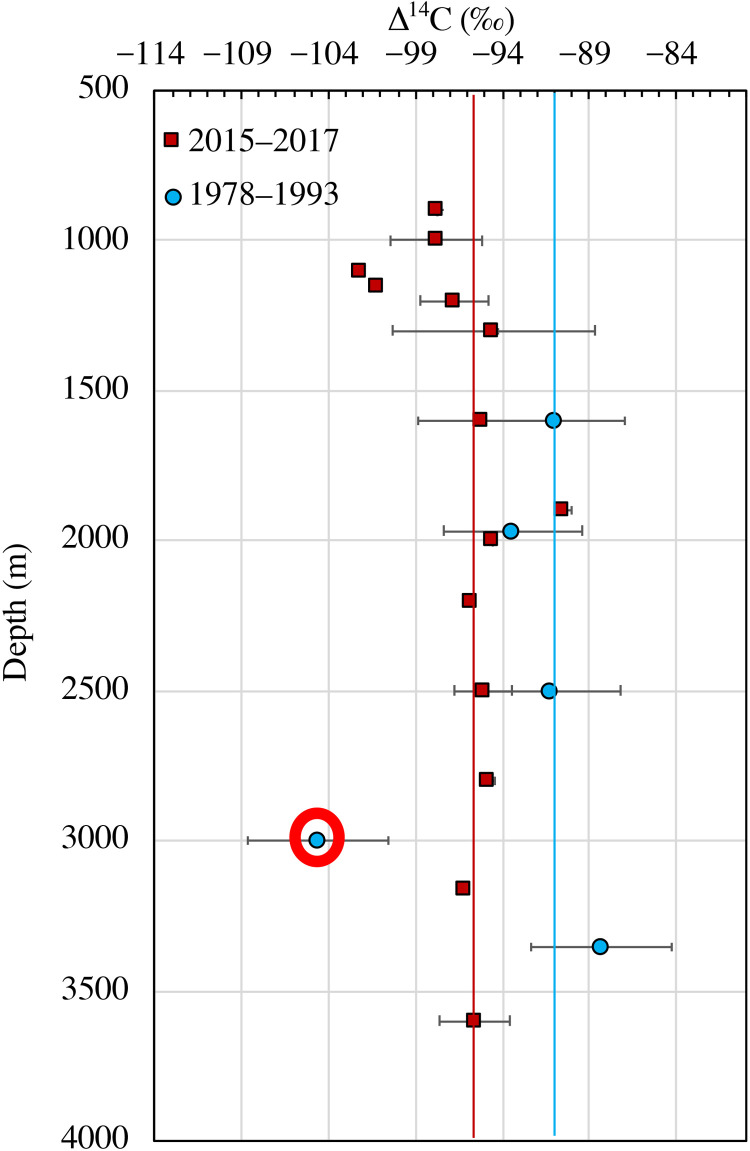
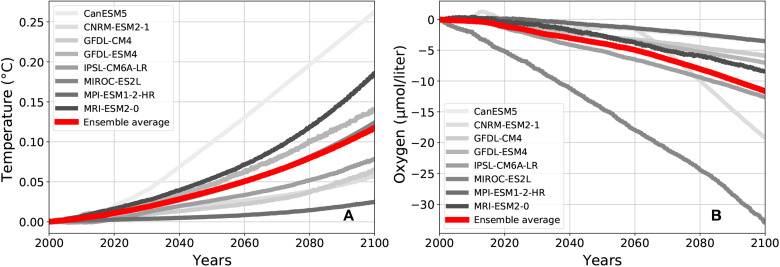
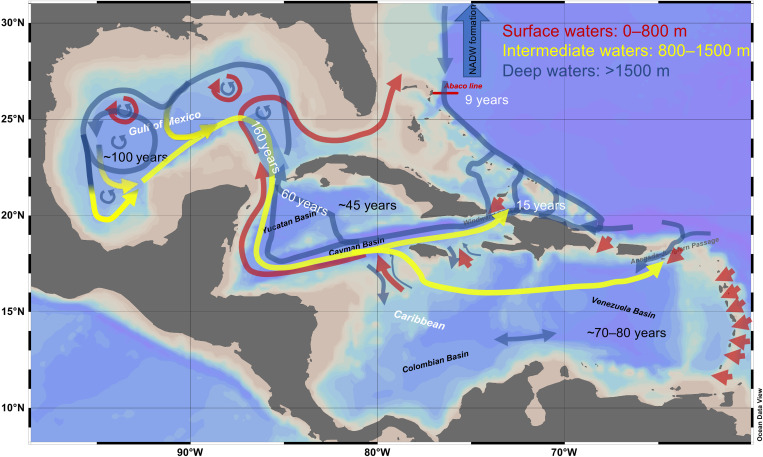
Ventilation in the deep Gulf of Mexico (GoM), its connection to the North Atlantic, and its susceptibility to changes of the Atlantic Meridional Overturning Circulation are investigated by combining observations of radiocarbon and volume transport with a Coupled Model Intercomparison Project phase 6 (CMIP6) General Circulation Model (GCM) ensemble output. Radiocarbon data and multiannual volume transport through the Yucatan Channel suggest deep water residence times ~100 years for the GoM. Comparisons to previous radiocarbon observations suggest that the deep GoM has aged in the recent past, consistent with observed raising temperatures and the CMIP6 GCM simulations. The distribution of radiocarbon indicates a time frame of ~160 years between North Atlantic convection and complete ventilation of the deep GoM. This suggests that aging and warming of GoM deep waters were initiated in the North Atlantic before ~1890 consistent with reported rapid and persistent AMOC weakening since the Little Ice Age.


Figures

Fig. 1.
Fig. 1.. Radiocarbon sampling locations during the 2017 CIGoM program (red diamonds).
Also included are existing data from the GoM [blue dots; (20, 28, 29)] and from the WOCE and CLIVAR section A22 [green triangles; (74); black triangles; (56)]. Approximate positions of mooring arrays are indicated with black dotted lines.
Fig. 2.
Fig. 2.. Depth profiles of DI14C from different locations in the GoM.
Sample locations include the western and central GoM (red symbols; averaged), the easternmost station nearest to YC (blue squares), the YC (black crosses), and the Yucatan Basin in the Northern Caribbean (green diamonds). The strong radiocarbon gradient between 300 and 800 m represents the transition from NACW to SACW and AAIW. Inset expands the scale for mid-depth samples.
Fig. 3.
Fig. 3.. Distribution of bomb 14C and anthropogenic carbon (expressed in per mill equivalents, Eq. 11) along with the bomb 14C/Cant ratio in the different ocean basins and over time.
Values are averages for potential density anomaly >27.725 kg m−3 (to the sill depths of 1680 m at Windward Passage and 1820 m at Anegada Passage for inflowing NADW). Bomb 14C is based on the relationship to silicate (36), and Cant is based on the approach of Lee et al. (37). Error bars represent the uncertainty given in the respective references, which are 15‰ for bomb 14C and 6‰ for Cant. The uncertainty for Cant was reported (37) as 8 μmol liter−1 and was converted to ‰ equivalents using Eq. 11. NA, North Atlantic Basin.
Fig. 4.
Fig. 4.. Schematic drawing of mixing of dense overflow water with resident water in the GoM near YC.
The downslope flow fills the deep waters within the gulf. Inflowing waters of density σ01 from ~1800 m to the bottom at the Yucatan sill are denser than anything found in the interior GoM. The isopycnal σ02 at ~1700 m at the sill is found on the bottom of the GoM, a vertical displacement of ~1800 m. Such mixing is evident in dissolved oxygen (DO) profiles in the eastern Gulf (fig. S4). The σ03 isopycnal represents a lighter density water than σ02, which permits outflowing waters below it and diapycnal mixing with the waters above.
Fig. 5.
Fig. 5.. Mean volume transport below the 1000m reference depth in the YC and derived residence times in the deep GoM.
- Volume transport estimates are based on the 4-year observed current means (A) or based on the mean distribution matching the transport between YC and FS (B). In green is the contribution toward the Caribbean Sea, in red is the contribution into the GoM, and in black is the total transport. Residence time versus isopycnals (C) or depth (D) for the two mean current profiles obtained in YC by Candela et al. (27). The green line corresponds to the volume transport based on direct mean current measurements with more than 1 year of observations in YC (A), and the black line represents estimates derived from matching the volume transport in YS and FS (B).
Fig. 6.
Fig. 6.. Depth profiles of DO in the different basins along with potential density anomaly in color.
The horizontal black lines indicate sill depths of the Windward Passage, the Anegada-Jungfern Passage, and the YC. The black circle highlights the bottom oxygen maximum at the easternmost station (A10) in the GoM.
Fig. 7.
Fig. 7.. Depths profiles of recent (red squares, 2015 and 2017–2019) and older (blue circles, 1978) radiocarbon measurements in the GoM.
The red circle around the 3000-m data point in the historical profile is excluded from Student’s t test (see main text).
Fig. 8.
Fig. 8.. Simulated temperature and oxygen changes in GoM deep waters between 2000 and 2100.
Output from an ensemble of eight CMIP6 GCMs under historical and SSP585 scenarios for the 21st century.
Fig. 9.
Fig. 9.. Schematic for the general flow patterns of surface, intermediate, and deep waters in the GoM/Caribbean basins.
White numbers indicate years since formation in the North Atlantic. Black numbers indicate the approximate deep waters residence times in the different basins.

References

    1. W. J. Schmitz Jr., D. C. Biggs, A. Lugo-Fernández, L.-Y. Oey, W. Sturges, A synopsis of the circulation in the Gulf of Mexico and on its continental margins, in Circulation in the Gulf of Mexico: Observations and Models, Alexis Lugo-Fernández and Wilton Sturges, Eds. (American Geophysical Union, 2005), vol. 108, pp. 11–29.
    1. P. Pérez-Brunius, H. Furey, A. Bower, P. Hamilton, J. Candela, P. García-Carrillo, R. Leben, Dominant circulation patterns of the deep gulf of Mexico. J. Phys. Oceanogr. 48, 511–529 (2018).
    1. P. Hamilton, R. Leben, A. Bower, H. Furey, P. Pérez-Brunius, Hydrography of the gulf of mexico using autonomous floats. J. Phys. Oceanogr. 48, 773–794 (2018).
    1. M. Tenreiro, J. Candela, E. Pallas-Sanz, J. Sheinbaum, J. Ochoa, Near-surface and deep circulation coupling in the western gulf of Mexico. J. Phys. Oceanogr. 48, 145–161 (2018).
    1. L.-Y. Oey, H.-C. Lee, Deep eddy energy and topographic Rossby waves in the Gulf of Mexico. J. Phys. Oceanogr. 32, 3499–3527 (2002).