. 2023 Mar 15;9(11):eade4582.
doi: 10.1126/sciadv.ade4582. Epub 2023 Mar 17.

Digital spatial profiling of intraductal papillary mucinous neoplasms: Toward a molecular framework for risk stratification

Affiliations

Digital spatial profiling of intraductal papillary mucinous neoplasms: Toward a molecular framework for risk stratification

Matthew K Iyer et al. Sci Adv. .

Abstract

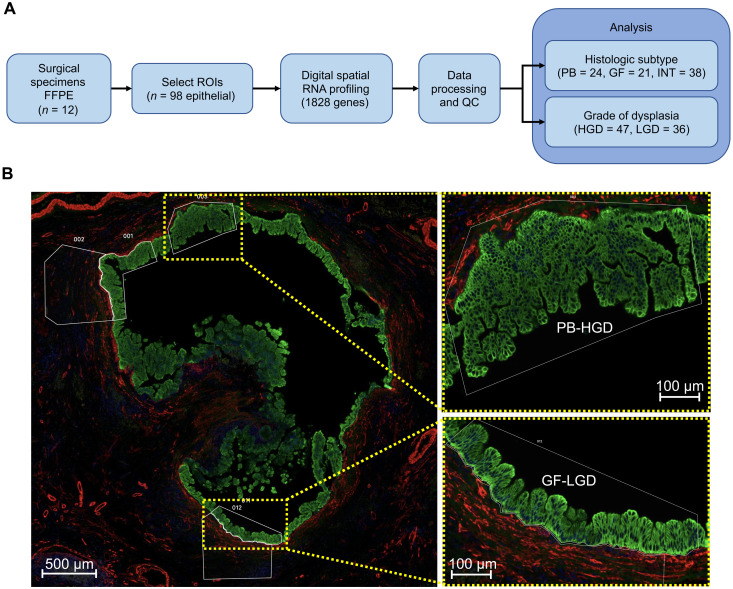
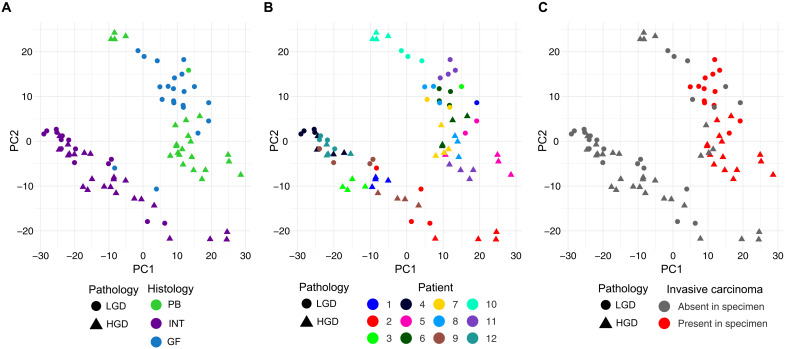
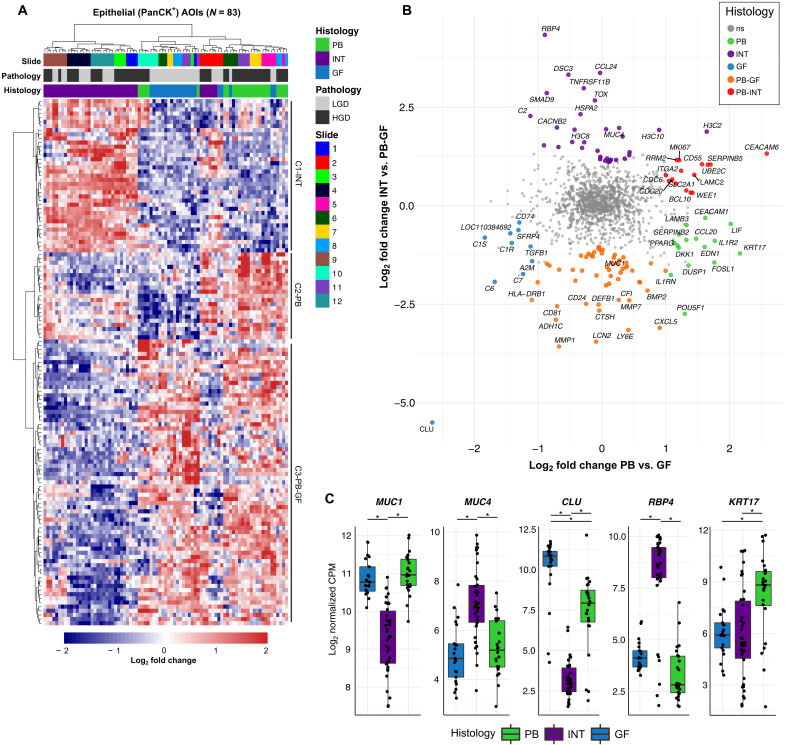
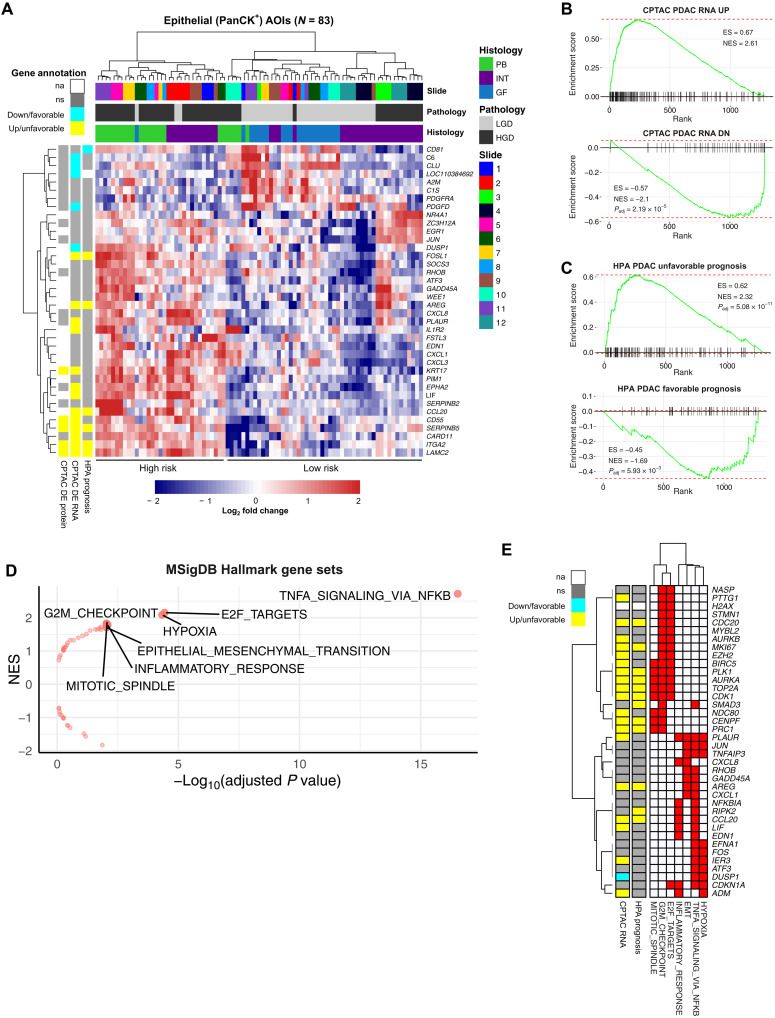
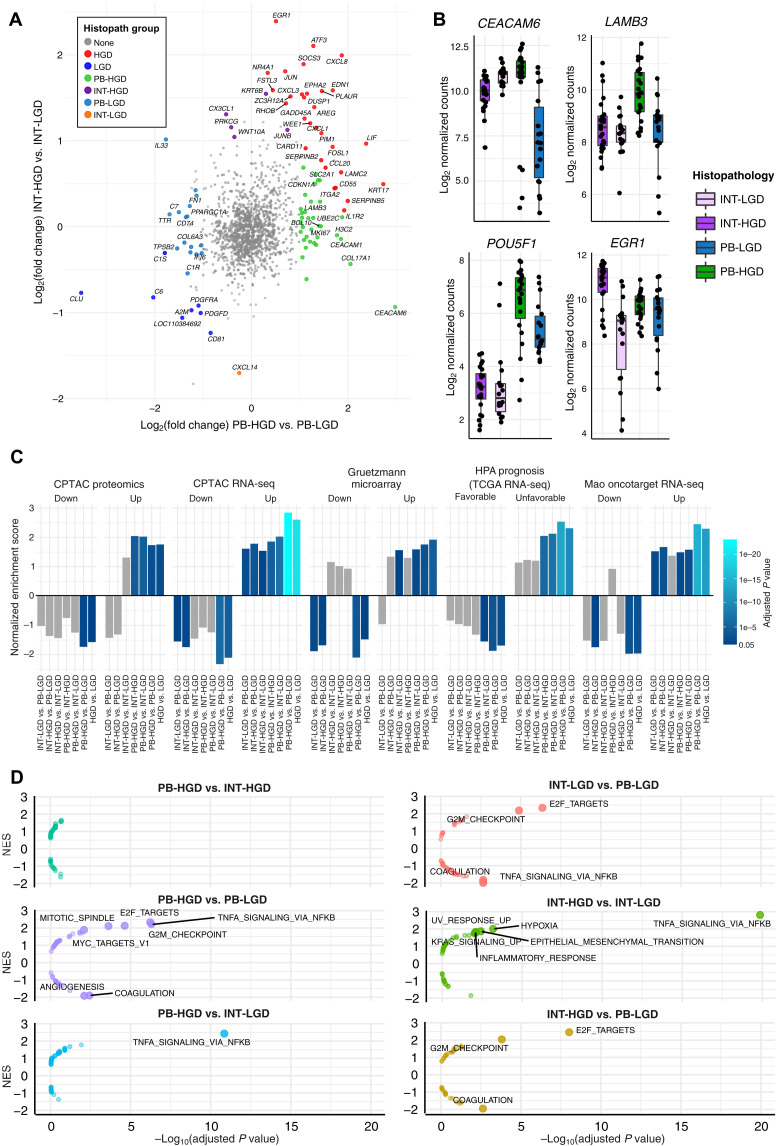
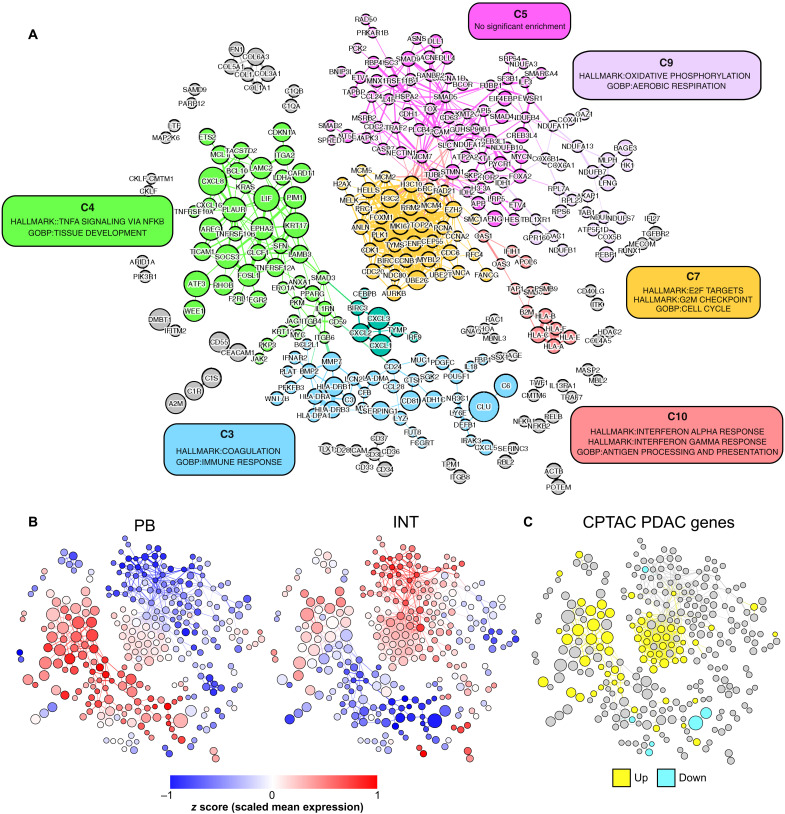
The histopathologic heterogeneity of intraductal papillary mucinous neoplasms (IPMN) complicates the prediction of pancreatic ductal adenocarcinoma (PDAC) risk. Intratumoral regions of pancreaticobiliary (PB), intestinal (INT), and gastric foveolar (GF) epithelium may occur with either low-grade dysplasia (LGD) or high-grade dysplasia (HGD). We used digital spatial RNA profiling of dysplastic epithelium (83 regions) from surgically resected IPMN tissues (12 patients) to differentiate subtypes and predict genes associated with malignancy. The expression patterns of PB and GF lesions diverged from INT, suggesting that PB and GF arise from a common lineage. Transcriptional dysregulation within PB lesions mirrored that of PDAC, whereas INT and GF foci did not. Tumor necrosis factor/nuclear factor κB (TNF-NFκB) and cell cycle (cycling S and cycling G2-M) programs occurred with relative prominence in PB and INT subtypes, respectively. Together, this study delineates markers of high-risk IPMN and insights into malignant progression.


Figures

Fig. 1.
Fig. 1.. Spatial RNA profiling of IPMN.
(A) Study overview flow diagram. (B) A representative high-resolution microscopy image from patient slide 6 depicting regions of HGD (PB) and LGD (GF) cyst epithelium chosen for profiling. ROIs, regions of interest; QC, quality control.
Fig. 2.
Fig. 2.. Principal components analysis of normalized spatial RNA profiles.
Scatterplot of the first two principal components (PC1 and PC2). The shape of AOIs reflects the grade of dysplasia. (A to C) AOIs colored by (A) histologic subtype, (B) patient/slide ID, and (C) presence of carcinoma elsewhere in the specimen.
Fig. 3.
Fig. 3.. Analysis of epithelial subtypes of IPMN.
(A) Heatmap plot of differentially expressed genes specific to PB, INT, and GF subtype [absolute log2 fold change > 1, adjusted P value (Padj) < 0.05]. Columns represent individual AOIs annotated by slide identifier, grade of dysplasia, and epithelial subtype. Rows represent individual genes with expression values scaled by z score. Hierarchical clustering of both columns and rows was performed. (B) Scatterplot showing log2 fold change of PB versus GF genes (x axis) and INT versus PB-GF (non-intestinal) (y axis). Genes that are significantly differentially expressed (absolute log2 fold change > 1, Padj < 0.05) are colored by the histologic subtype that they represent. The top 10 differentially expressed genes from each analysis are labeled. The widely used marker gene MUC1, which was overexpressed in PB-GF relative to INT, is labeled for reference. (C) Boxplots showing the log-normalized gene expression of subtype marker genes MUC1, MUC4, CLU, RBP4, and KRT17. *P < 0.05. PanCK+, pan-cytokeratin positive; ns, not significant; CPM, counts per million.
Fig. 4.
Fig. 4.. Analysis by grade of dysplasia (HGD versus LGD).
(A) Heatmap plot of differentially expressed genes in AOIs representing HGD versus LGD (absolute log2 fold change > 1, Padj < 0.05). Gene expression values are scaled by z score. AOIs (columns) are annotated by slide identifier, grade of dysplasia, and epithelial subtype. High-risk and low-risk AOI clusters are annotated below. Genes (rows) are further annotated by established markers PDAC, including datasets from the Human Protein Atlas (HPA Prognosis) and Clinical Proteomic Tumor Analysis Consortium (CPTAC) analysis (CPTAC DE RNA and CPTAC DE protein). (B and C) Gene Set Enrichment Analysis (GSEA) enrichment plots using external PDAC gene sets comparing AOIs with HGD compared to LGD, ranked by log fold change. (D) Volcano plot of Molecular Signatures Database (MSigDB) Hallmark gene sets associated with HGD compared to LGD, with statistical significance plotted on the x axis and normalized enrichment score plotted on the y axis. Significantly enriched gene sets (Padj < 0.01) are shown with text labels. (E) Heatmap showing genes (rows) associated with two or more enriched Hallmark gene sets (columns). Rows are also annotated with evidence of dysregulation (CPTAC RNA) or prognostic relevance (HPA Prognosis) in PDAC.
Fig. 5.
Fig. 5.. Comparison of epithelial subtypes by grade of dysplasia.
(A) Scatterplot showing log2 fold change of PB-HGD versus PB-LGD (x axis) and INT-HGD versus INT-LGD (y axis). Significant DE genes are colored by histopathologic subgroup. Top 10 DE genes from each analysis are labeled. (B) Boxplots showing the log-normalized gene expression of histopathologic marker genes. (C) Barplots depicting GSEA normalized enrichment score obtained from testing of histopathologic groups against several external PDAC gene sets. Bar colors depict the Padj of each test. Gray bars are not statistically significant (Padj > 0.05). (D) Volcano plots of MSigDB Hallmark gene sets associated with each histopathologic subgroup (relative to its counterparts), with statistical significance plotted on the x axis and normalized enrichment score plotted on the y axis. Significant enrichment results (Padj < 0.01) are shown with text labels.
Fig. 6.
Fig. 6.. Coexpression network analysis.
Gene coexpression network was produced by correlation analysis of all epithelial AOIs, where nodes represent individual genes and edges connect highly correlated gene pairs. Node size reflects the fold change in expression between HGD and LGD AOIs. (A) Unsupervised clustering of network with color-coded clusters. Clusters with >10 genes were tested for enrichment against MSigDB Hallmark gene sets, GO:BP gene sets, and PDAC gene sets. Cluster annotation based on the most significantly enriched gene sets are shown in colored boxes. (B) Overlay showing standardized mean gene expression (z score) across PB-HGD AOIs (left) and INT-HGD AOIs (right). (C) Overlay showing overexpressed (yellow) and underexpressed (cyan) genes from the CPTAC PDAC RNA-seq dataset.

References

    1. R. L. Siegel, K. D. Miller, H. E. Fuchs, A. Jemal, Cancer statistics, 2022. CA Cancer J. Clin. 72, 7–33 (2022). - PubMed
    1. R. H. Hruban, A. Maitra, S. E. Kern, M. Goggins, Precursors to pancreatic cancer. Gastroenterol. Clin. North Am. 36, 831–849 (2007). - PMC - PubMed
    1. R. Salvia, A. Burelli, G. Perri, G. Marchegiani, State-of-the-art surgical treatment of IPMNs. Langenbecks Arch. Surg. 406, 2633–2642 (2021). - PMC - PubMed
    1. J. Wu, Y. Wang, Z. Li, H. Miao, Accuracy of Fukuoka and American gastroenterological association guidelines for predicting advanced neoplasia in pancreatic cyst neoplasm: A meta-analysis. Ann. Surg. Oncol. 26, 4522–4536 (2019). - PubMed
    1. M. Tanaka, C. Fernández-del Castillo, T. Kamisawa, J. Y. Jang, P. Levy, T. Ohtsuka, R. Salvia, Y. Shimizu, M. Tada, C. L. Wolfgang, Revisions of international consensus Fukuoka guidelines for the management of IPMN of the pancreas. Pancreatology 17, 738–753 (2017). - PubMed

MeSH terms