. 2023 Mar 15;9(11):eadd3243.
doi: 10.1126/sciadv.add3243. Epub 2023 Mar 17.

HDAC3 is critical in tumor development and therapeutic resistance in Kras-mutant non-small cell lung cancer

Affiliations

HDAC3 is critical in tumor development and therapeutic resistance in Kras-mutant non-small cell lung cancer

Lillian J Eichner et al. Sci Adv. .

Abstract

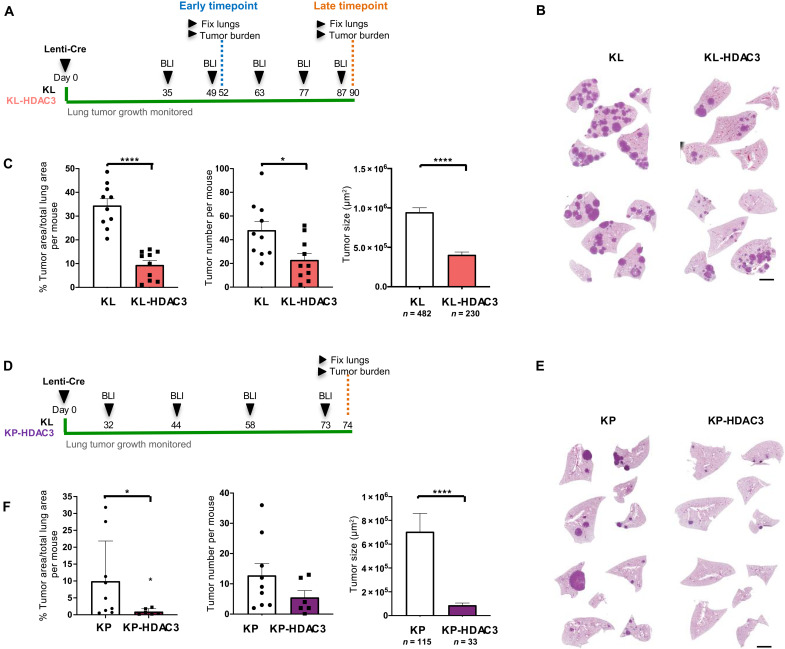
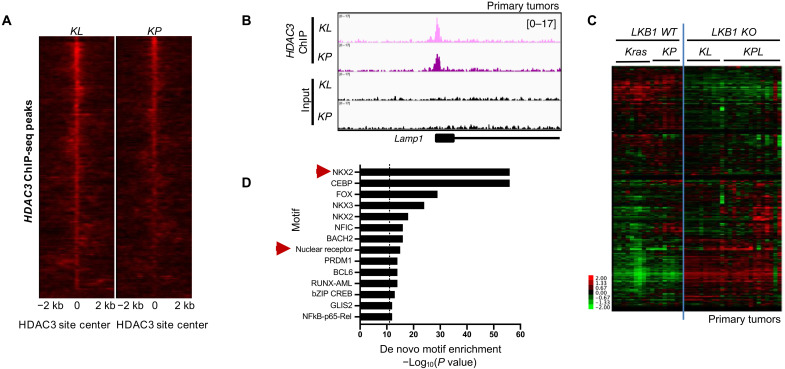
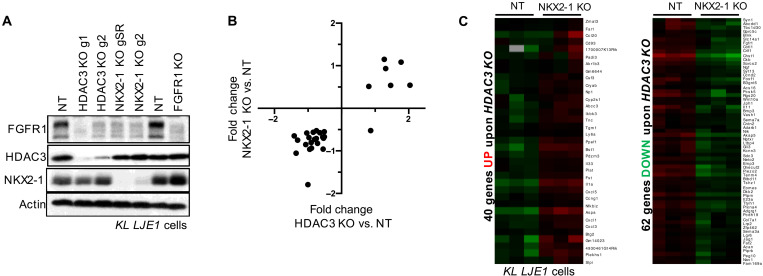
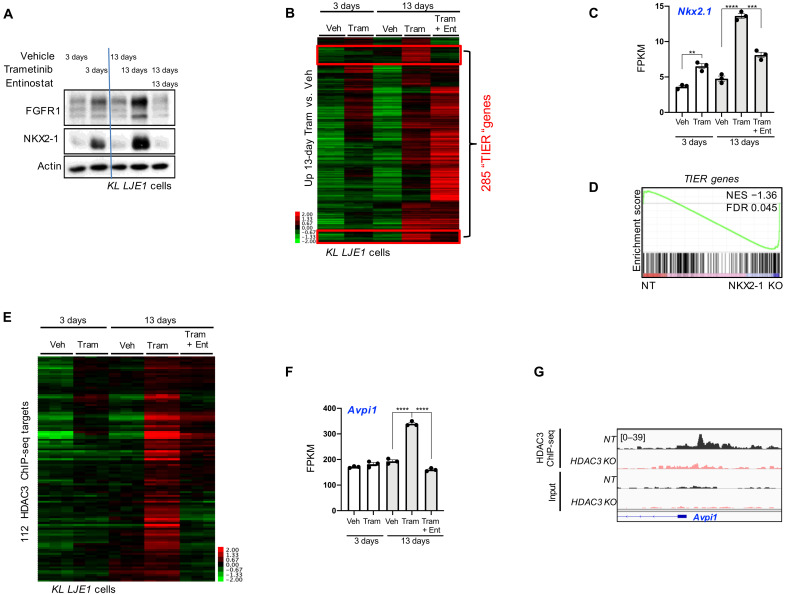
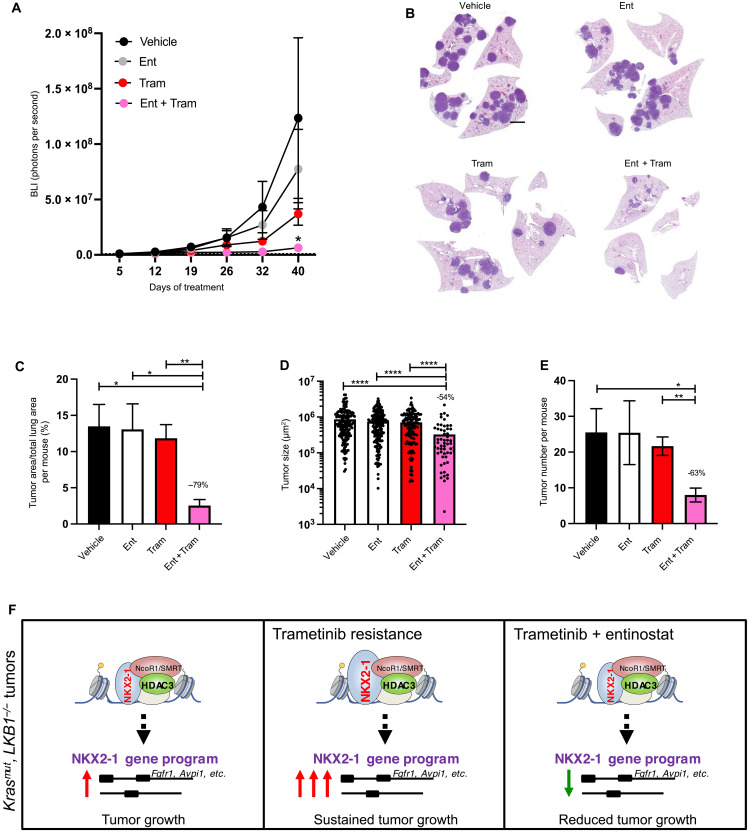
HDAC3 is one of the main targets of histone deacetylase (HDAC) inhibitors in clinical development as cancer therapies, yet the in vivo role of HDAC3 in solid tumors is unknown. We identified a critical role for HDAC3 in Kras-mutant lung cancer. Using genetically engineered mouse models (GEMMs), we found that HDAC3 is required for lung tumor growth in vivo. HDAC3 was found to direct and enhance the transcription effects of the lung cancer lineage transcription factor NKX2-1 to mediate expression of a common set of target genes. We identified FGFR1 as a critical previously unidentified target of HDAC3. Leveraging this, we identified that an HDAC3-dependent transcriptional cassette becomes hyperactivated as Kras/LKB1-mutant cells develop resistance to the MEK inhibitor trametinib, and this can be reversed by treatment with the HDAC1/HDAC3 inhibitor entinostat. We found that the combination of entinostat plus trametinib treatment elicits therapeutic benefit in the Kras/LKB1 GEMM.


Figures

Fig. 1.
Fig. 1.. HDAC3 is essential for lung tumorigenesis in vivo in KL and KP GEMM models of NSCLC.
(A) Schematic of experimental design in KrasG12D/+, LKB1L/L (KL), and KL-HDAC3L/L (KL-HDAC3) mouse models administered lentivirus expressing Cre recombinase (Lenti-Cre). (B) Representative hematoxylin and eosin (H&E)–stained sections from the late time point. Scale bar, 1000 μm. (C) Quantitation from H&E-stained sections from the late time point cohort: Tumor area as a percentage of total lung area per mouse (n = 10), tumor number per mouse (n = 10), and average tumor size (n = 482 or 230 as indicated). (D) Schematic of experimental design in KrasG12D/+, p53L/L (KP), and KP-HDAC3L/L (KP-HDAC3) mouse models administered Lenti-Cre. (E) Representative H&E-stained sections. Scale bar, 1000 μm. (F) Quantitation from H&E-stained sections: tumor area as a percentage of total lung area per mouse (n = 9 or 6 as indicated), tumor number per mouse (n = 9 or 6 as indicated), and average tumor size (n = 115 or 33 as indicated). Values are expressed as means ± SEM. *P < 0.05 and ****P < 0.0001, determined by two-tailed Mann-Whitney test.
Fig. 2.
Fig. 2.. HDAC3 genome occupancy in primary tumors.
(A) A total of 1522 HDAC3 ChIP-seq peaks common to KL and KP primary tumors. (B) Example of HDAC3 ChIP-seq peaks at genomic regions bound by HDAC3 in both KL and KP primary tumors. (C) Heatmap of RNA-seq data showing FPKM (fragments per kilobase of transcript per million) read counts from primary tumors from LKB1 wild type (Kras and KP) and LKB1 knockout (KO) (KL and KPL) models for the 753 nonredundant genes associated with at least one HDAC3 ChIP-seq peak within 25 kb of the TSS. Kras, KrasLSL-G12D/+; KL, KrasLSL-G12D/+ Stk11−/−; KP, KrasLSL-G12D/+ p53−/−; KPL, KrasLSL-G12D/+ Stk11−/− p53−/−. (D) Homer de novo motif enrichment analysis of the HDAC3-bound peaks in (A). All significantly enriched motifs are listed.
Fig. 3.
Fig. 3.. HDAC3 cooperates with NKX2-1 to regulate the expression of a common set of target genes.
(A) Western blot analysis of HDAC3, NKX2-1, or FGFR1 KO by CRISPR-Cas9 in polyclonal lysates from KL LJE1 cells. (B) Plot of fold change upon HDAC3 KO compared to NKX2-1 KO for the genes significantly deregulated (adjusted P < 0.05; fold, ±0.5) upon loss of both factors in KL LJE1 cells. (C) Heatmap of RNA-seq data showing FPKM read counts for genes commonly up-regulated (left) or down-regulated (right) upon both HDAC3 KO and NKX2-1 KO in KL cells, as defined from red box regions on heatmap in fig. S3D.
Fig. 4.
Fig. 4.. HDAC3 and NKX2-1 common target genes are aberrantly engaged upon trametinib resistance.
(A) Western blot analysis of protein lysates from KL LJE1 cells treated with vehicle, 10 nM trametinib, or 1 μM entinostat for 3 or 13 days. (B) Heatmap of RNA-seq data showing FPKM read counts across all treatment conditions for the 2141 genes significantly up-regulated (adjusted P < 0.05; fold, >±0.5) upon 13 day of trametinib compared to 13 days of vehicle in KL LJE1 cells. Veh, vehicle; Tram, trametinib; Ent, entinostat. Red boxes identify TIER genes. (C) Nkx2-1 mRNA levels (FPKM) across all treatment conditions (n = 3) from RNA-seq data in (B). (D) Gene set enrichment analysis (GSEA) of the 285 TIER genes queried across RNA-seq data from NKX2-1 KO versus NT KL LJE1 cells. (E) Heatmap of RNA-seq data showing FPKM read counts across all treatment conditions for the 112 TIER genes that are HDAC3 ChIP-seq target genes. (F) Avpi1 mRNA levels across all treatment conditions from RNA-seq data from cells in (B) (n = 3). (G) HDAC3 ChIP-seq data in NT and HDAC3 KO KL LJE1 cells at the Avpi1 genomic locus. Values are expressed as means ± SEM. **P < 0.01, ***P < 0.001, and ****P < 0.0001, determined by two-tailed Student’s t test.
Fig. 5.
Fig. 5.. Trametinib plus entinostat combination treatment elicits therapeutic efficacy in KL NSCLC GEMM in vivo.
(A) Average longitudinal BLI data. (B) Representative H&E-stained sections at experimental end point. Scale bar, 1000 μm. (C to E) Quantitation from H&E-stained sections: (C) tumor area as a percentage of total lung area per mouse, (D) average tumor size, and (E) tumor number per mouse. (F) Model of HDAC3 cooperation with NKX2-1 to support KL tumor growth basally and in the context of trametinib resistance. Values are expressed as means ± SEM. *P < 0.05, **P < 0.01, and ****P < 0.0001, determined by t test with Welch’s correction.

References

    1. J. E. Bradner, D. Hnisz, R. A. Young, Transcriptional addiction in cancer. Cell 168, 629–643 (2017). - PMC - PubMed
    1. T. De Raedt, E. Beert, E. Pasmant, A. Luscan, H. Brems, N. Ortonne, K. Helin, J. L. Hornick, V. Mautner, H. Kehrer-Sawatzki, W. Clapp, J. Bradner, M. Vidaud, M. Upadhyaya, E. Legius, K. Cichowski, PRC2 loss amplifies Ras-driven transcription and confers sensitivity to BRD4-based therapies. Nature 514, 247–251 (2014). - PubMed
    1. J. Shi, C. R. Vakoc, The mechanisms behind the therapeutic activity of BET bromodomain inhibition. Mol. Cell 54, 728–736 (2014). - PMC - PubMed
    1. N. Tasdemir, A. Banito, J. S. Roe, D. Alonso-Curbelo, M. Camiolo, D. F. Tschaharganeh, C. H. Huang, O. Aksoy, J. E. Bolden, C. C. Chen, M. Fennell, V. Thapar, A. Chicas, C. R. Vakoc, S. W. Lowe, BRD4 connects enhancer remodeling to senescence immune surveillance. Cancer Discov. 6, 612–629 (2016). - PMC - PubMed
    1. T. Shimamura, Z. Chen, M. Soucheray, J. Carretero, E. Kikuchi, J. H. Tchaicha, Y. Gao, K. A. Cheng, T. J. Cohoon, J. Qi, E. Akbay, A. C. Kimmelman, A. L. Kung, J. E. Bradner, K. K. Wong, Efficacy of BET bromodomain inhibition in Kras-mutant non-small cell lung cancer. Clin. Cancer Res. 19, 6183–6192 (2013). - PMC - PubMed

MeSH terms