. 2023 Mar 28;95(12):5196-5204.
doi: 10.1021/acs.analchem.2c04133. Epub 2023 Mar 17.

Dense and Acidic Organelle-Targeted Visualization in Living Cells: Application of Viscosity-Responsive Fluorescence Utilizing Restricted Access to Minimum Energy Conical Intersection

Affiliations

Dense and Acidic Organelle-Targeted Visualization in Living Cells: Application of Viscosity-Responsive Fluorescence Utilizing Restricted Access to Minimum Energy Conical Intersection

Junya Adachi et al. Anal Chem. .

Abstract

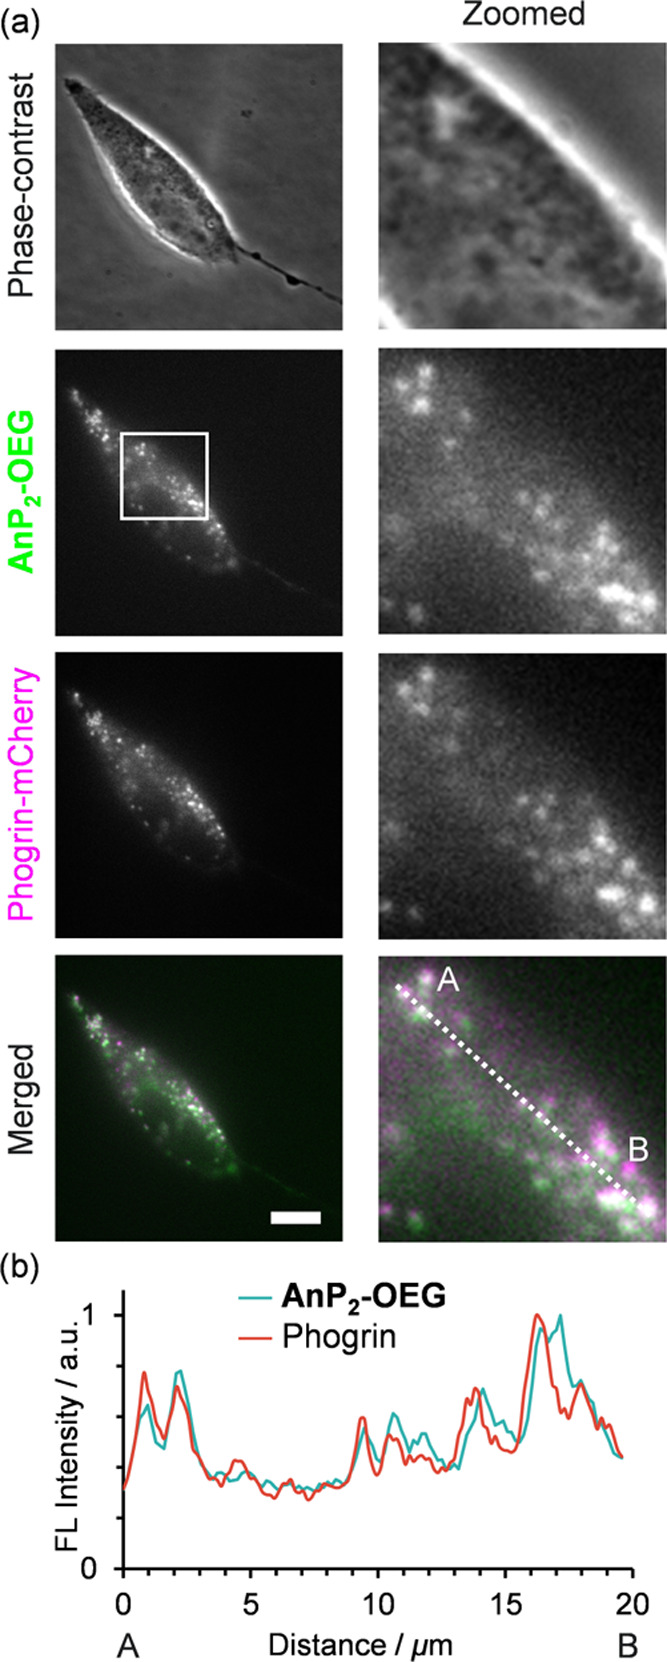
Cell-imaging methods with functional fluorescent probes are an indispensable technique to evaluate physical parameters in cellular microenvironments. In particular, molecular rotors, which take advantage of the twisted intramolecular charge transfer (TICT) process, have helped evaluate microviscosity. However, the involvement of charge-separated species in the fluorescence process potentially limits the quantitative evaluation of viscosity. Herein, we developed viscosity-responsive fluorescent probes for cell imaging that are not dependent on the TICT process. We synthesized AnP2-H and AnP2-OEG, both of which contain 9,10-di(piperazinyl)anthracene, based on 9,10-bis(N,N-dialkylamino)anthracene that adopts a nonflat geometry at minimum energy conical intersection. AnP2-H and AnP2-OEG exhibited enhanced fluorescence as the viscosity increased, with sensitivities comparable to those of conventional molecular rotors. In living cell systems, AnP2-OEG showed low cytotoxicity and, reflecting its viscosity-responsive property, allowed specific visualization of dense and acidic organelles such as lysosomes, secretory granules, and melanosomes under washout-free conditions. These results provide a new direction for developing functional fluorescent probes targeting dense organelles.


Conflict of interest statement

The authors declare no competing financial interest.

Figures

Figure 1
Figure 1
(a) Molecular structures of AnP2-H and AnP2-OEG. OEG denotes octa(ethylene glycol). (b) Schematic illustration of the anthracene unit after excitation at low and high viscosities.
Figure 2
Figure 2
(a) Fluorescence spectra of AnP2-OEG in different solvent systems (5.0 μM at 293 K, λex = 396 nm). (b) Relationship between the photoluminescence maximum of each spectrum and solvent viscosity. 95, 90, 85, 80, 75, and 60 w% glycerol in water, 2-propanol, and methanol, with viscosities of 523, 219, 109, 60.1, 35.3, 10.8, 2.43, and 0.568 cP, respectively, were used as the solvent. PL denotes photoluminescence.
Figure 3
Figure 3
Cytotoxicity of AnP2-H and AnP2-OEG. HeLa cells were incubated in the presence of AnP2-H and AnP2-OEG for 24 h. Cell viability was evaluated by the WST-8 assay. Error bars represent standard deviations (n = 5).
Figure 4
Figure 4
Representative microscopic images showing lysosomal staining of HeLa cells in the presence of AnP2-OEG. (a) Phase-contrast and fluorescence images of AnP2-OEG (10 μM) and LysoTracker-Red (50 nM) are shown with their merged images. Zoomed images of the boxed area are shown on the right. Arrows indicate the regions where the dark structures in the phase-contrast images coincide with fluorescence signals from both AnP2-OEG and LysoTracker. Scale bar: 20 μm. (b) Intensity profile of AnP2-OEG and LysoTracker along the dashed line.
Figure 5
Figure 5
Investigation of mechanisms of cellular uptake and lysosomal localization of AnP2-OEG. Phase-contrast (left) and fluorescence (right) microscopic images of HeLa cells treated with AnP2-OEG (10 μM) at (a) 37 °C and (b) 4 °C for 30 min and (c) pretreated with bafilomycin A1 (200 nM, 37 °C, 1 h) and then treated with AnP2-OEG (10 μM, 37 °C, 30 min). Scale bar: 10 μm. Pseudo-color, lookup table (LUT): fire.
Figure 6
Figure 6
Costaining images of AtT-20 cells by AnP2-OEG and Phogrin-mCherry. (a) Phase-contrast and fluorescence images of AnP2-OEG (10 μM) and Phogrin-mCherry (expressed by transfection) are shown with merged images of AnP2-OEG and Phogrin-mCherry. Zoomed images of the boxed area are shown on the right. Scale bar: 10 μm. (b) Intensity profile of ROIs along the dashed line.
Figure 7
Figure 7
Costaining images of B16-F1 cells by AnP2-OEG and LysoTracker-Red. Phase-contrast and fluorescence images of AnP2-OEG (10 μM) and LysoTracker-Red (50 nM) are shown with merged images of AnP2-OEG and LysoTracker. Zoomed images of the boxed area are shown on the bottom. Arrows indicate the AnP2-OEG-positive regions that LysoTracker rarely stained. Scale bar: 20 μm.

References

    1. Pittet M. J.; Weissleder R. Intravital Imaging. Cell 2011, 147, 983–991. 10.1016/j.cell.2011.11.004. - DOI - PMC - PubMed
    1. Germain R. N.; Robey E. A.; Cahalan M. D. A Decade of Imaging Cellular Motility and Interaction Dynamics in the Immune System. Science 2012, 336, 1676–1681. 10.1126/science.1221063. - DOI - PMC - PubMed
    1. Xiao H.; Li P.; Tang B. Small Molecular Fluorescent Probes for Imaging of Viscosity in Living Biosystems. Chem.–Eur. J. 2021, 27, 6880–6898. 10.1002/chem.202004888. - DOI - PubMed
    1. Kowada T.; Maeda H.; Kikuchi K. BODIPY-Based Probes for the Fluorescence Imaging of Biomolecules in Living Cells. Chem. Soc. Rev. 2015, 44, 4953–4972. 10.1039/C5CS00030K. - DOI - PubMed
    1. Zhu C.; Kwok R. T. K.; Lam J. W. Y.; Tang B. Z. Aggregation-Induced Emission: A Trailblazing Journey to the Field of Biomedicine. ACS Appl. Bio Mater. 2018, 1, 1768–1786. 10.1021/acsabm.8b00600. - DOI - PubMed

Publication types

Substances