. 2023 May:95:106319.
doi: 10.1016/j.ultsonch.2023.106319. Epub 2023 Feb 6.

Probing the pressure dependence of sound speed and attenuation in bubbly media: Experimental observations, a theoretical model and numerical calculations

Affiliations

Probing the pressure dependence of sound speed and attenuation in bubbly media: Experimental observations, a theoretical model and numerical calculations

A J Sojahrood et al. Ultrason Sonochem. 2023 May.

Abstract

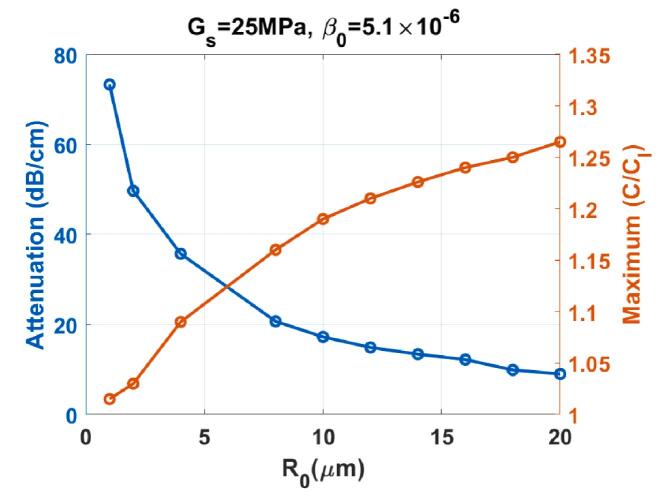
The problem of attenuation and sound speed of bubbly media has remained partially unsolved. Comprehensive data regarding pressure-dependent changes of the attenuation and sound speed of a bubbly medium are not available. Our theoretical understanding of the problem is limited to linear or semi-linear theoretical models, which are not accurate in the regime of large amplitude bubble oscillations. Here, by controlling the size of the lipid coated bubbles (mean diameter of ≈5.4μm), we report the first time observation and characterization of the simultaneous pressure dependence of sound speed and attenuation in bubbly water below, at and above microbubbles resonance (frequency range between 1-3 MHz). With increasing acoustic pressure (between 12.5-100 kPa), the frequency of the peak attenuation and sound speed decreases while maximum and minimum amplitudes of the sound speed increase. We propose a nonlinear model for the estimation of the pressure dependent sound speed and attenuation with good agreement with the experiments. The model calculations are validated by comparing with the linear and semi-linear models predictions. One of the major challenges of the previously developed models is the significant overestimation of the attenuation at the bubble resonance at higher void fractions (e.g. 0.005). We addressed this problem by incorporating bubble-bubble interactions and comparing the results to experiments. Influence of the bubble-bubble interactions increases with increasing pressure. Within the examined exposure parameters, we numerically show that, even for low void fractions (e.g. 5.1×10⁻⁶) with increasing pressure the sound speed may become 4 times higher than the sound speed in the non-bubbly medium.

Keywords: Attenuation; Cavitation; Microbubbles; Nonlinear Dynamics; Sound Speed.


Conflict of interest statement

Declaration of Competing Interest The authors declare that they have no known competing financial interests or personal relationships that could have appeared to influence the work reported in this paper.

Figures

Fig. 1
Fig. 1
Schematic of the flow-focusing microfluidic procedure for the production of monodisperse lipid coated microbubbles .
Fig. 2
Fig. 2
Size distribution of the MBs in the experiments measured by Coulter-counter. The volume fraction β0 can directly be calculated from the size distribution. Each size bin is 0.029μm.
Fig. 3
Fig. 3
The schematic of the setup for the measurements. A broadband pulse with 2.25 MHz center frequency is transmitted by the transducer on the right hand. After propagation through the chamber, the pulse will be received by the transducer on the left hand side.
Fig. 4
Fig. 4
Experimentally measured a) attenuation and b) sound speed of the bubbly medium for four different pressures.
Fig. 5
Fig. 5
Experimentally measured (blue) and simulated (red) attenuation of the sample for a) 12.5 kPa, b) 25 kPa, c) 50 kPa and d) 100 kPa. Sound speed of the sample for e) 12.5 kPa, f) 25 kPa, g) 50 kPa and h) 100 kPa. Errors bars represent the standard deviation.
Fig. D.1
Fig. D.1
Case of a bubbly medium with MBs with R0 = 2 μm and β0=10-5. Attenuation calculated using the linear model and nonlinear model (left) and sound speed calculated using the linear model and the nonlinear model at (P = 1 kPa) (Right) for: uncoated bubbles in water (a and b), coated bubbles in water (c and d) and uncoated bubbles in tissue (ρ = 1060 kg/m3,Cl = 1540 m/s, μs = 0.00287 Pa.s, G = 0.5 MPa, σ = 0.056 N/m [60]) (e and f).
Fig. D.2
Fig. D.2
Case of a bubbly medium with MBs with R0 = 2 μm and β0=10-5 sonicated at various pressures. Left: Ik2 calculated using the nonlinear model (Eqs. 11) and Louisnard model (Eq. C.8) and Right: Rk2 calculated using the nonlinear model (Eqs. 10) and Louisnard model (Eq. C.9) (Louisnard model employs the linear model for the real part; thus it is pressure independent) for: uncoated bubbles in water (a and b), coated bubbles in water (c & d) and uncoated bubbles in tissue (ρ = 1060 kg/m3,Cl = 1540 m/s, μs = 0.00287 Pa.s, G = 0.5 MPa, σ = 0.056 N/m [60]) (e and f).
Fig. D.3
Fig. D.3
Comparison between the predictions the Louisnard & the nonlinear model for sound speed and attenuation. Case of a bubbly medium with uncoated MBs with R0 = 2 μ m and β0=10-5. a) attenuation at Pa = 40 kPa, b) sound speed at Pa = 40 kPa, c) attenuation at Pa = 100 kPa d) sound speed at Pa = 100 kPa, e) attenuation at Pa = 150 kPa and f) sound speed at Pa = 150 kPa.
Fig. E.1
Fig. E.1
Influence of bubble–bubble interaction on the pressure dependent sound speed and attenuation at 100 kPa for a coated bubble with R0=2μm with Gs = 10 MPa in Eq. A2: a-b) β0=10-7, c-d) β0=5.1×10⁻⁶ and e-f) β0=10-4. In each case 20 bubbles are considered and randomly distributed in a cube. The side lengths of the cube were chosen to replicate the β0 in each case. The side length can be calculated as d=(20×4πR03/3β0)1/3. The minimum distance between neighboring MBs was chosen to be 10μm..
Fig. E.2
Fig. E.2
Case of a bubbly medium with β0=5.3×10⁻³ and R0 = 2.07 mm (a- attenuation and b-sound speed curves). Blue circles are constructed by solving the nonlinear model (NM) without bubble–bubble interaction. Blue solid line is constructed by the linear Commander and Prosperetti model . The red line-circle is constructed by solving the nonlinear model and incorporating bubble–bubble interaction. Green diamonds are experimentally measured values by Silberman . For the simulations, similar to pressure amplitude of 10 Pa is used.
Fig. F.1
Fig. F.1
Influence of the shell stiffness on the sound speed and attenuation in case of a coated bubble with β0 = 5.1×10⁻⁶ and R0=2μm in Eq. A2 when Pa is 100 kPa. The shell viscosity (μsh) is calculated as 1.49(R0(μm)-0.86)θ (nm) where θ = 4 nm . a) attenuation and b) sound speed as a function of f/fr where fr is the linear resonance frequency.
Fig. F.2
Fig. F.2
Influence of the shell viscosity on the sound speed and attenuation in case of a coated bubble with β0=5.1×10⁻⁶,R0=2μm, and Gs = 25 MPa in Eq. A2 when Pa is 100 kPa. The shell viscosity (μsh) is calculated as A*1.49(R0(μm)-0.86)/θ (nm) where θ = 4 nm and A is varied between 0.5 and 2. a) attenuation and b) sound speed as a function of f/fr where fr is the linear resonance frequency.
Fig. F.3
Fig. F.3
Influence of the bubble initial radius on the sound speed and attenuation in case of a coated bubble with β0=5.1×10⁻⁶, and Gs = 25 MPa in Eq. A2 when Pa is 100 kPa. The shell viscosity (μsh) is calculated as 1.49(R0(μm)-0.86)θ (nm) where θ = 4 nm. a) attenuation and b) sound speed as a function of f/fr where fr is the linear resonance frequency of each bubble.
Fig. F.4
Fig. F.4
Relationship between the bubble initial radius and the maximum sound speed and attenuation in case of a coated bubble with β0=5.1×10⁻⁶, and Gs = 25 MPa in Eq. A2 when Pa is 100 kPa. The shell viscosity (μsh) is calculated as 1.49(R0(μm)-0.86)θ (nm) where θ = 4 nm. The maximum sound speed and attenuation are calculated within the range of 0.33frf2.5fr.
Fig. G.1
Fig. G.1
Influence of increasing the pressure amplitude on the sound speed and attenuation at β0=5.1×10⁻⁶ for a coated bubble with R0=2μm in Eq. A2 when Pa is: a-b) 200 kPa c-d)500 kPa and e-f)1000 kPa. In each case 20 bubbles are considered and randomly distributed in a cube. The dimensions of the cube were chosen to replicate the β0 in each case. The dimension can be calculated as d=(20×4πR03/3β0)1/3. The minimum distance between neighboring MBs was chosen to be 50μm to eliminate the possibility of MBs collisions at higher pressures.
Fig. H.1
Fig. H.1
Influence of increasing the pressure amplitude on the sound speed and attenuation of a lipid coated MB with R0 = 2.7μm, β0=5.1×10⁻⁶ and different sets of shell parameters A,B,C and D: a-b)12.5 kPa c-d)25 kPa and e-f)50 kPa, g-h)100 kPa. For each group, the shell parameters are given in Table H.1. Radial oscillations are calculated using Eq. 12 and bubble–bubble interactions and transducer response are neglected for simplicity. The duration of the sonicating pulse is 3μs.

References

    1. Suslick K.S. Sonochemistry. Science. 1990;247(4949):1439–1445. - PubMed
    1. Mantouka A., Dogan H., White P.R., Leighton T.G. Modelling acoustic scattering, sound speed, and attenuation in gassy soft marine sediments. The journal of the acoustical society of America. 2016;140(1):274–282. - PubMed
    1. Etter P.C. CRC Press; 2013. Underwater acoustic modeling and simulation.
    1. Leighton T.G., Dogan H., Fox P., Mantouka A., Best A.I., Robb G.B., White P.R. Acoustic propagation in gassy intertidal marine sediments: An experimental study. The Journal of the Acoustical Society of America. 2021;150(4):2705–2716. - PubMed
    1. Maisonhaute E., Prado C., White P.C., Compton R.G. Surface acoustic cavitation understood via nanosecond electrochemistry. Part III: Shear stress in ultrasonic cleaning. Ultrasonics sonochemistry. 2002;9(6):297–303. - PubMed

LinkOut - more resources