. 2023 Mar 16;186(6):1127-1143.e18.
doi: 10.1016/j.cell.2023.02.021.

Dynamic CD8+ T cell responses to cancer immunotherapy in human regional lymph nodes are disrupted in metastatic lymph nodes

Affiliations

Dynamic CD8+ T cell responses to cancer immunotherapy in human regional lymph nodes are disrupted in metastatic lymph nodes

Maha K Rahim et al. Cell. .

Abstract

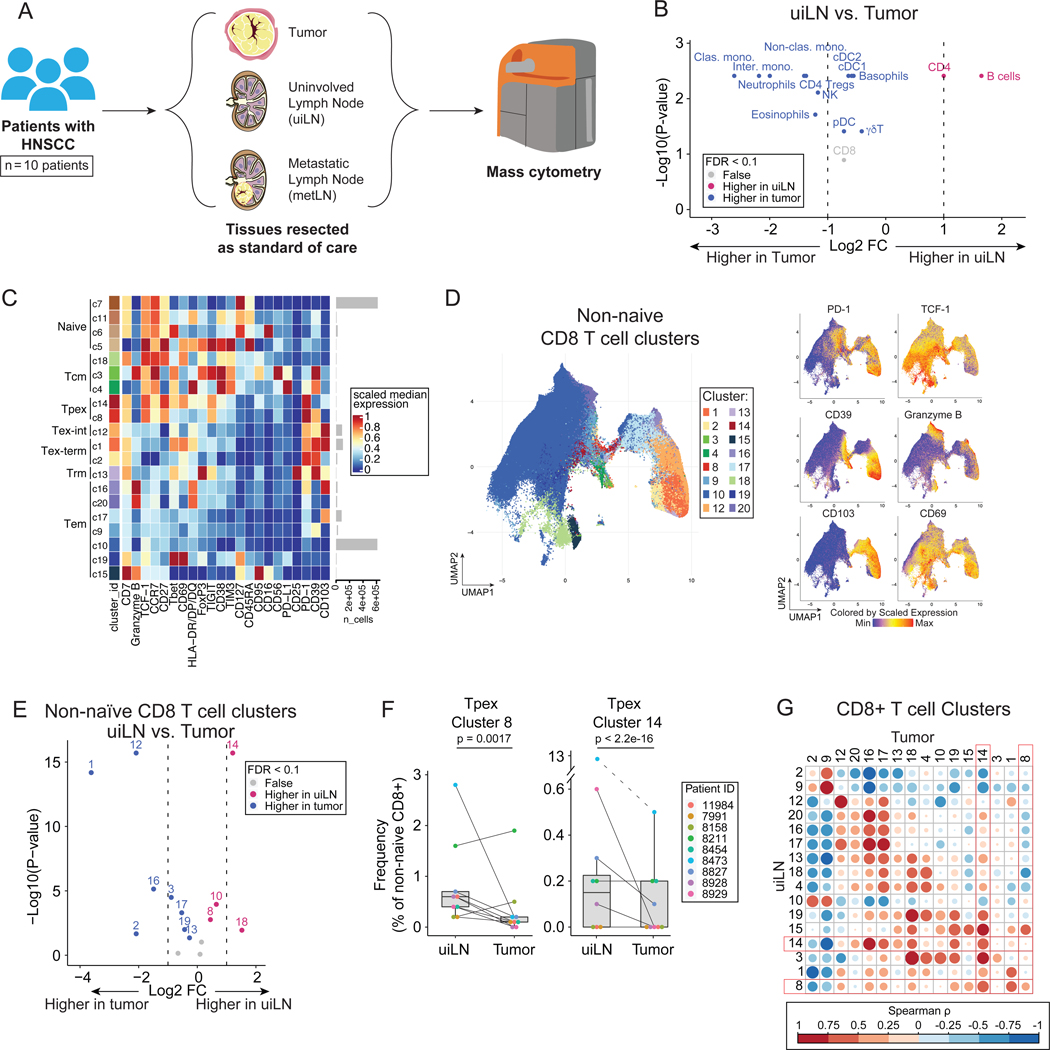
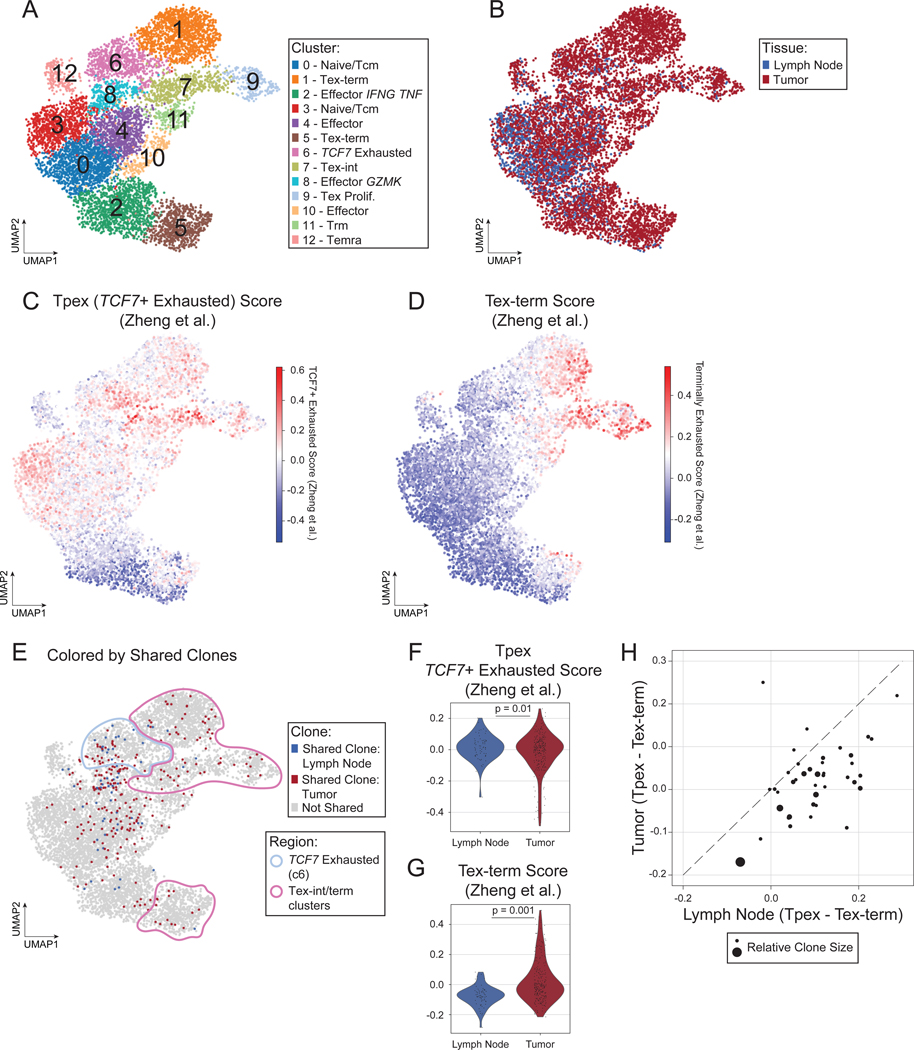
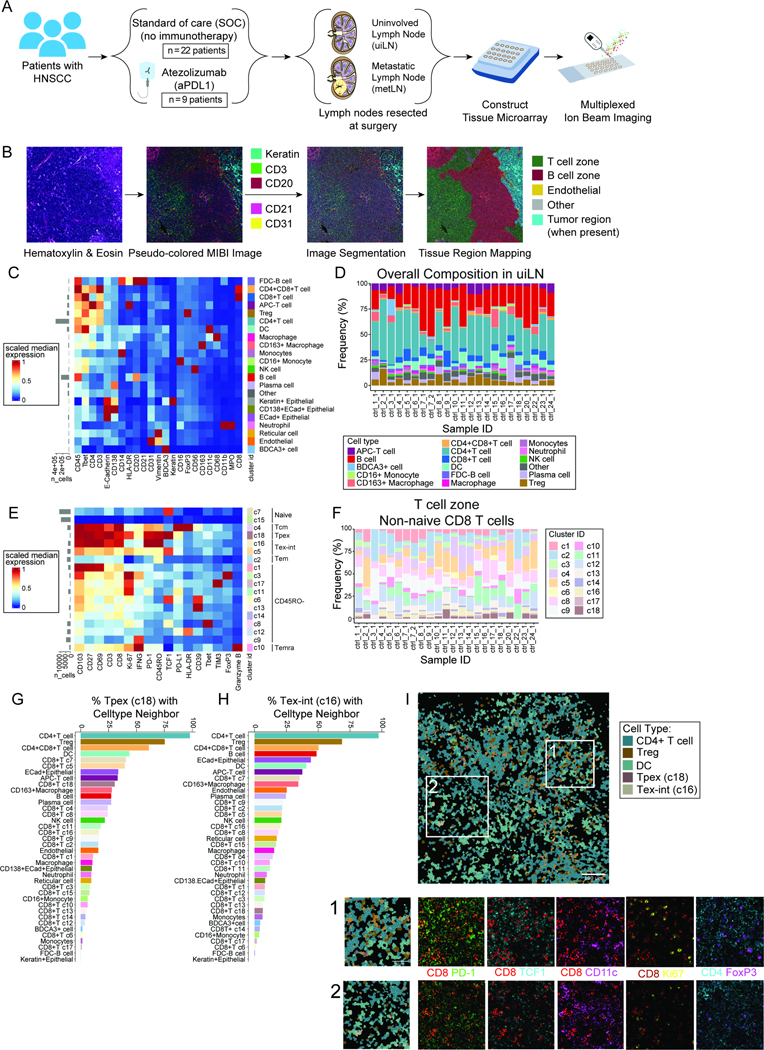
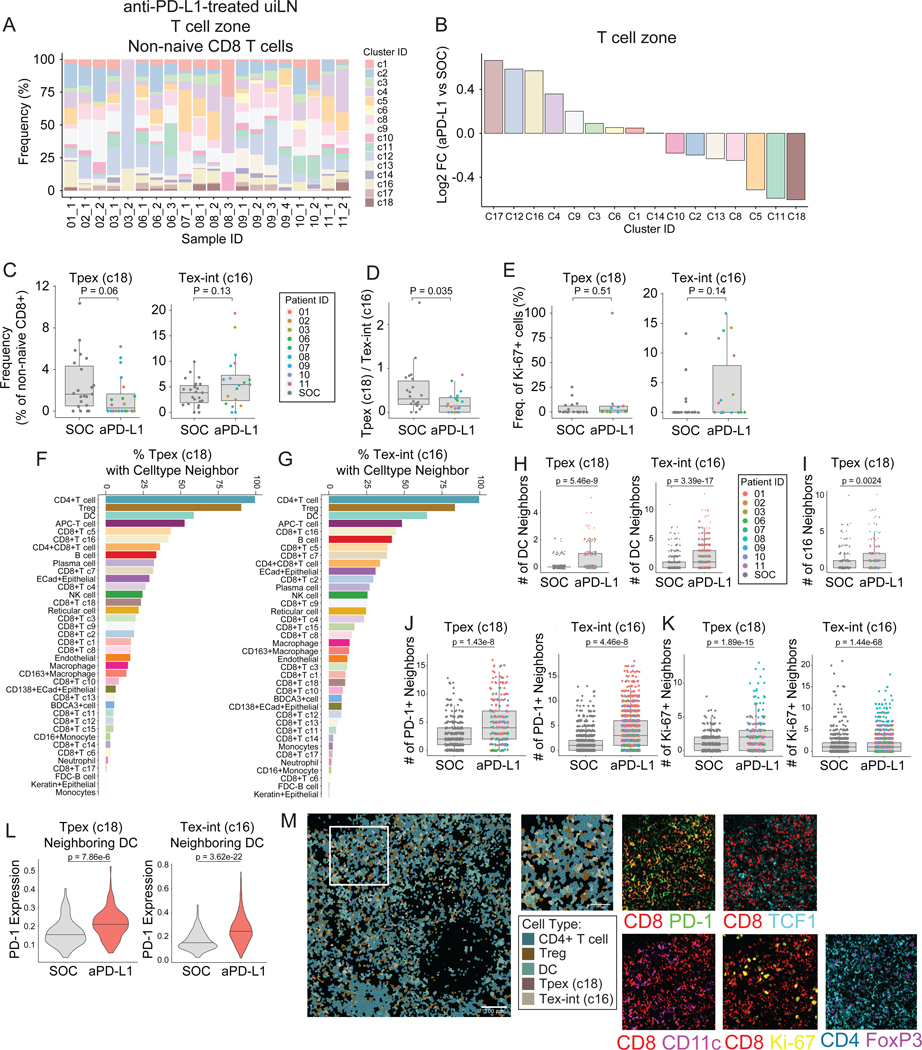
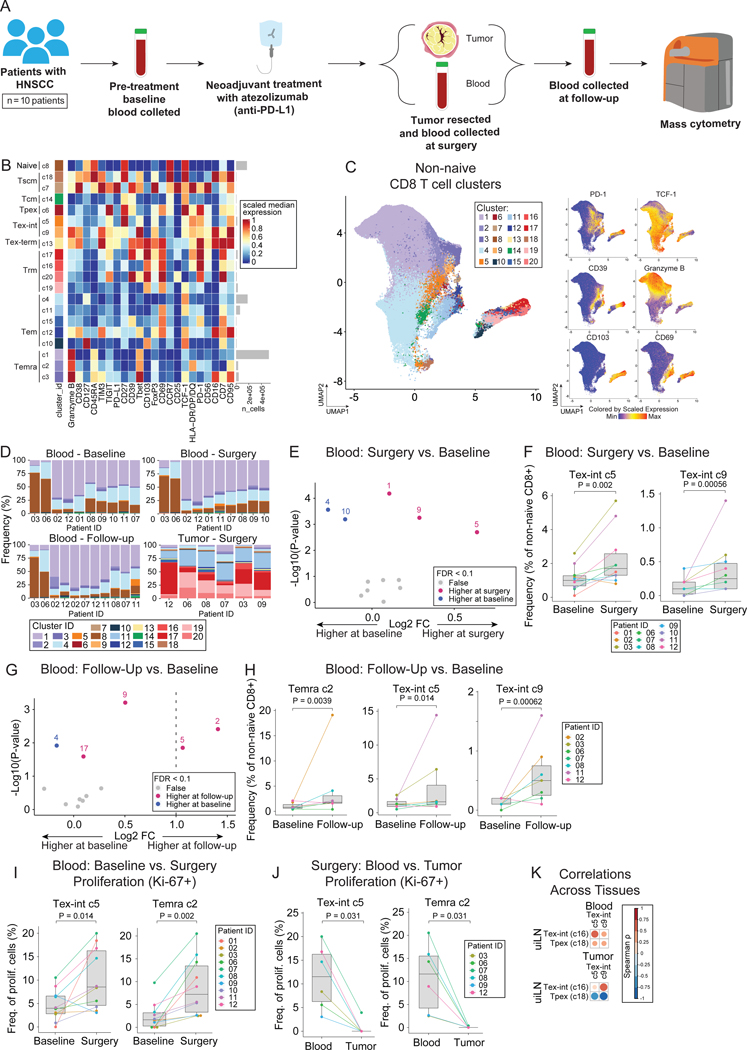
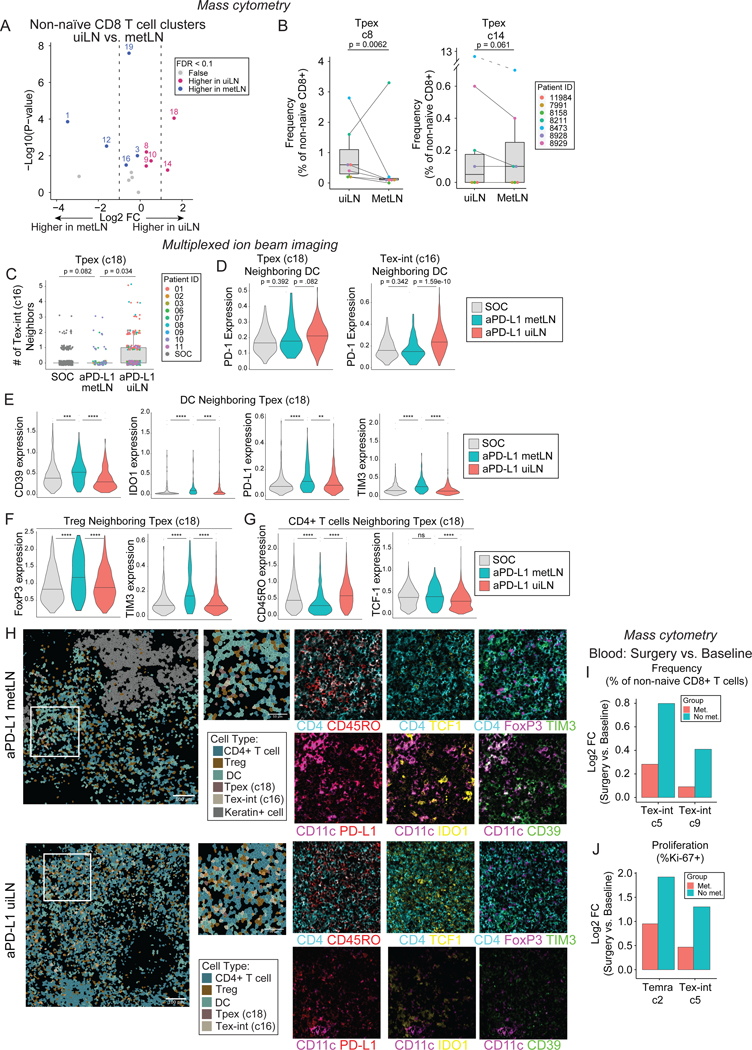
CD8+ T cell responses are critical for anti-tumor immunity. While extensively profiled in the tumor microenvironment, recent studies in mice identified responses in lymph nodes (LNs) as essential; however, the role of LNs in human cancer patients remains unknown. We examined CD8+ T cells in human head and neck squamous cell carcinomas, regional LNs, and blood using mass cytometry, single-cell genomics, and multiplexed ion beam imaging. We identified progenitor exhausted CD8+ T cells (Tpex) that were abundant in uninvolved LN and clonally related to terminally exhausted cells in the tumor. After anti-PD-L1 immunotherapy, Tpex in uninvolved LNs reduced in frequency but localized near dendritic cells and proliferating intermediate-exhausted CD8+ T cells (Tex-int), consistent with activation and differentiation. LN responses coincided with increased circulating Tex-int. In metastatic LNs, these response hallmarks were impaired, with immunosuppressive cellular niches. Our results identify important roles for LNs in anti-tumor immune responses in humans.

Trial registration: ClinicalTrials.gov NCT03708224.

Keywords: CD8(+) T cells; T cell exhaustion; cancer immunotherapy; immune checkpoint blockade; lymph nodes.


Conflict of interest statement

Declaration of interests W.E.O’G. and K.B.J. are employees of Genentech/Roche. M.F.K. is senior advisor and founder of Foundery Immune Studios. M.A. is an inventor on patents related to MIBI technology. M.A. is a consultant, board member, and shareholder in Ionpath Inc. M.H.S. is founder and a board member of Teiko.bio and has received a speaking honorarium from Fluidigm Inc. M.F.K., L.F., A.P.A., P.H., and M.H.S. received research funding from Roche/Genentech.

Figures

Figure 1:
Figure 1:. Tpex cells are increased in uninvolved lymph nodes of HNSCC patients.
A) Overview of cohort. Paired tumor and lymph node samples (uninvolved; uiLN and/or metastatic; metLN) were obtained from patients with HNSCC (n = 10). Samples were analyzed by mass cytometry. B) Paired differential abundance (DA) of main immune cell populations between uiLN and tumor (n = 9; paired Wilcoxon Rank Sum Test). The log2 fold changes are plotted against the negative log10 (nominal p-values). Colors indicate if cell populations are significantly more abundant in uiLN (purple), tumor (blue), or not differentially abundant (False, grey) after Benjamini-Hochberg correction, FDR < 0.1. C) Heatmap of markers used for CD8+ T cell clustering. Scaled median expression per marker is shown for cluster annotation. D) UMAP of non-naïve CD8+ T cell clusters and expression for a subset of markers. E) Paired differential abundance analysis of non-naïve CD8+ T cell subsets between uiLN and tumor (n = 9; generalized linear mixed models). See color scheme for Figure 1B. F) Cluster 8 and 14 abundances (as percentage of non-naïve CD8+ T cells) in paired samples from uiLN and tumor. P-values obtained by generalized linear mixed models. G) Spearman correlation between clusters in uiLN and clusters in tumors. Tpex clusters are highlighted in red boxes. See also Figure S1.
Figure 2:
Figure 2:. CD8+ T cells in the tumor and LN are clonally related.
A-E) UMAP of 8,245 CD8+ T cells from 5 paired tumor and LN samples (10 samples total) colored by (A) Leiden cluster, (B) tissue of origin, (C) TCF7 exhaustion score, (D) Tex-term score, or (E) highlighting shared clones between the tumor (red) and lymph node (blue). F-G) Violin plot of expression of (F) TCF7 exhaustion score and (G) Tex-term score in CD8+ T cells with shared clones in the LN versus tumor. P-values obtained by generalized linear mixed models. H) Scatter plot of average TCF7 exhaustion score – average terminal exhaustion score for each shared clone in the LN (x-axis) versus tumor (y-axis). Dashed line is the identity line. Dots are sized according to the number of cells in LN and tumor for the clone. See also Figure S2.
Figure 3:
Figure 3:. Localization of Tpex in human uiLN.
A) Overview of cohort. uiLN samples were obtained from patients with HNSCC that received standard of care (SOC; n = 23) or 1 to 2 cycles of anti-PD-L1 treatment prior to surgery (n = 9). For anti-PD-L1 treated patients that had metastatic disease (n = 4), metLN samples were also obtained. Tissue cores were distributed across two tissue microarrays for analysis by multiplexed ion beam imaging (MIBI). B) Overview of the image analysis pipeline. C) Heatmap of scaled median marker expression for cell lineage assignments. D) Relative abundance of main immune cell types in uiLN (global, n = 23) from SOC treated patients (n = 22). Sample ID represents patient ID followed by LN number. E) Heatmap of markers used for CD8+ T cell clustering. Scaled median expression per marker is shown for cluster annotation. F) Relative abundance of non-naïve CD8+ T cell clusters in uiLN (T cell zone, n = 23) from SOC treated patients (n = 22). G-H) Percentage of (G) cluster 18 and (H) cluster 16 cells with a specific cell type as its neighbor in uiLN (T cell zone) from SOC treated patients. I) Representative image of an uiLN from a SOC treated patient (patient 23) showing the spatial localization of CD4 T cells, Tregs, DCs, Tpex (cluster 18), and Tex-int (cluster 16). Cell identity overlaid onto the segmentation mask. Highlighted regions 1 and 2 are colored by the expression of CD8+ (red), PD-1 (green), TCF-1 (cyan), CD11c (purple), Ki-67 (yellow), CD4 (cyan), and FoxP3 (purple). See also Figure S3.
Figure 4:
Figure 4:. anti-PD-L1 ICB impacts Tpex and Tex-int in uiLN.
A) Relative abundance of non-naïve CD8+ T cell clusters in uiLN (T cell zone, n = 20) from anti-PD-L1 treated patients (n = 9). Sample ID represents patient ID followed by LN number. B) Non-naïve CD8+ T cell cluster ratios represented as log2 fold changes between uiLN (T cell zone, n = 20) from anti-PD-L1 treated patients and uiLN (T cell zone, n = 22) from SOC treated patients. C) Cluster 18 and 16 abundances (as percentage of non-naïve CD8+ T cells) in the T cell zone of uiLN from SOC and anti-PD-L1 treated patients. D) Cluster 18/cluster 16 ratio in uiLN (T cell zone) from SOC and anti-PD-L1 treated patients. E) Percentage of cluster 18 and 16 proliferating cells in uiLN (T cell zone) from SOC and anti-PD-L1 treated patients. F-G) Percentage of (F) cluster 18 and (G) cluster 16 cells with a specific cell type as its neighbor in uiLN (T cell zone) from anti-PD-L1 treated patients. H) Number of DC neighbors for cluster 18 and cluster 16 cells in uiLN (T cell zone) from SOC and anti-PD-L1 treated patients. I) Number of cluster 16 neighbors for cluster 18 cells in uiLN (T cell zone) from SOC and anti-PD-L1 treated patients. J-K) Number of (J) PD-1 positive and (K) Ki-67+ neighbors for cluster 18 and cluster 16 cells in uiLN (T cell zone) from SOC and anti-PD-L1 treated patients. L) Expression of PD-1 on cluster 18 and cluster 16 cells with a DC neighbor in uiLN (T cell zone) from SOC and anti-PD-L1 treated patients. M) Representative image of an uiLN from an anti-PD-L1 treated patient (patient 01) showing the spatial localization of CD4 T cells, Tregs, DCs, Tpex (cluster 18), and Tex-int (cluster 16). Cell identity overlaid onto the segmentation mask. Highlighted region is colored by the expression of CD8+ (red), PD-1 (green), TCF-1 (cyan), CD11c (purple), Ki-67 (yellow), CD4 (cyan), and FoxP3 (purple). C-E and H-L) P-values obtained by Wilcoxon Rank Sum Test. See also Figure S4.
Figure 5:
Figure 5:. Tex-int are present at higher levels in the blood following ICB.
A) Overview of cohort. Blood samples were collected pre-treatment (baseline, 2–29 days before surgery), at time of surgery, and at follow-up (27–38 days post-surgery) from patients with HNSCC that received anti-PD-L1 treatment prior to surgery (n = 10). Additionally, tumor samples were collected at time of surgery. For a few patients, additional samples were collected (see complete overview in Figure S6A). Samples were analyzed by mass cytometry. B) Heatmap of markers used for CD8+ T cell clustering. Scaled median expression per marker is shown for cluster annotation. C) UMAP of non-naïve CD8+ T cell clusters and expression for a subset of markers. D) Frequencies of non-naïve CD8+ T cell clusters. E) Paired differential abundance analysis of non-naïve CD8+ T cell subsets between blood at time of surgery and baseline (n = 10) (generalized linear mixed models). The log2 fold changes are plotted against the negative log10(nominal p-values). Colors indicate if cell populations are significantly more abundant in blood at time of surgery (purple) or baseline (blue) or not differentially abundant (False, grey) after Benjamini-Hochberg correction, FDR < 0.1. F) Cluster 5 and 9 abundances (as percentage of non-naïve CD8+ T cells) in paired blood samples at time of surgery and baseline. P-values obtained by generalized linear mixed models. G) Paired differential abundance analysis of non-naïve CD8+ T cell subsets between blood at time of follow-up and at baseline (n = 7) (generalized linear mixed models). See color scheme for Figure 6C. H) Cluster 2, 5, and 9 abundances (as percentage of non-naïve CD8+ T cells) in paired blood samples at follow-up and baseline. P-values obtained by generalized linear mixed models. I-J) Percentage of cluster 2 and 5 proliferating cells in (I) paired blood samples at time of surgery and baseline and (J) in blood and tumor at time of surgery. P-values obtained by paired Wilcoxon Rank Sum Test. K) Spearman correlation between cluster 16 and 18 in LN (MIBI data) and cluster 5 and 9 in blood (CyTOF data) at time of surgery. See also Figure S5.
Figure 6:
Figure 6:. Immunosuppressive niches surround Tpex and Tex-int in metLN after anti-PD-L1 ICB.
A) Paired differential abundance (DA) analysis of main immune cell populations between uiLN and metLN (n = 9; paired Wilcoxon Rank Sum Test). The log2 fold changes are plotted against the negative log10 (nominal p-values). Colors indicate if cell populations are significantly more abundant in uiLN (purple), tumor (blue), or not differentially abundant (False, grey) after Benjamini-Hochberg correction, FDR < 0.1. B) Cluster 8 and 14 abundances (as percentage of non-naïve CD8+ T cells) in paired samples from uiLN and metLN. P-values obtained by generalized linear mixed models. C) Number of cluster 16 neighbors for cluster 18 cells in ui-cores (global) and met-cores (global) from SOC and anti-PD-L1 treated patients. D) Expression of PD-1 on cluster 18 and cluster 16 cells with a DC neighbor in ui-cores (global) and met-cores (global) from SOC and anti-PD-L1 treated patients. E) Expression of CD39, IDO1, PD-L1, and TIM3 on DCs neighboring Tpex (cluster 18 cells) in ui-cores (global) and met-cores (global) from SOC and anti-PD-L1 treated patients. F) Expression of FOXP3 and TIM3 on Tregs neighboring Tpex (cluster 18 cells) in ui-cores (global) and met-cores (global) from SOC and anti-PD-L1 treated patients. G) Expression of CD45RO and TCF-1 on CD4+ T cells neighboring Tpex (cluster 18 cells) in ui-cores (global) and met-cores (global) from SOC and anti-PD-L1 treated patients. H) Representative images of a metLN (patient 10) and uiLN (patient 01) from anti-PD-L1 treated patients showing the spatial localization of CD4 T cells, Tregs, DCs, Tpex (cluster 18), Tex-int (cluster 16), and keratin+ cells. Cell identity overlaid onto the segmentation mask. Highlighted region is colored by the expression of CD4+ (cyan), CD45RO (red), CD11c (purple), PD-L1 (red), TCF-1 (yellow), IDO1 (yellow), FoxP3 (purple), TIM-3 (green), and CD39 (green). I) Log2 fold changes of cluster 5 and 9 abundances at time of surgery vs baseline stratified into patients with metastatic LN (Met) and patients without metastatic LN (No met). J) Log2 fold changes of cluster 2 and 5 frequencies of proliferating cells at time of surgery vs baseline stratified into patients with metastatic LN (Met) and patients without metastatic LN (No met). C-G) P-values obtained by Wilcoxon Rank Sum Test. See also Figure S6.

Comment in

References

    1. Hiam-Galvez KJ, Allen BM, and Spitzer MH (2021). Systemic immunity in cancer. Nat. Rev. Cancer 21, 345–359. - PMC - PubMed
    1. Spitzer MH, Carmi Y, Reticker-Flynn NE, Kwek SS, Madhireddy D, Martins MM, Gherardini PF, Prestwood TR, Chabon J, Bendall SC, et al. (2017). Systemic Immunity Is Required for Effective Cancer Immunotherapy. Cell 168, 487–502.e15. - PMC - PubMed
    1. Fransen MF, Schoonderwoerd M, Knopf P, Camps MG, Hawinkels LJ, Kneilling M, van Hall T, and Ossendorp F. (2018). Tumor-draining lymph nodes are pivotal in PD-1/PD-L1 checkpoint therapy. JCI Insight 3. 10.1172/jci.insight.124507. - DOI - PMC - PubMed
    1. Dammeijer F, van Gulijk M, Mulder EE, Lukkes M, Klaase L, van den Bosch T, van Nimwegen M, Lau SP, Latupeirissa K, Schetters S, et al. (2020). The PD-1/PD-L1-Checkpoint Restrains T cell Immunity in Tumor-Draining Lymph Nodes. Cancer Cell 38, 685–700.e8. - PubMed
    1. Yost KE., Satpathy AT., Wells DK., Qi Y., Wang C., Kageyama R., McNamara KL., Granja JM., Sarin KY., Brown RA., et al.. (2019). Clonal replacement of tumor-specific T cells following PD-1 blockade. Nat. Med. 25, 1251–1259. - PMC - PubMed

Publication types

Associated data