

ModelArray: An R package for statistical analysis of fixel-wise data
- PMID: 36931330
- PMCID: PMC10119782
- DOI: 10.1016/j.neuroimage.2023.120037
ModelArray: An R package for statistical analysis of fixel-wise data
Abstract
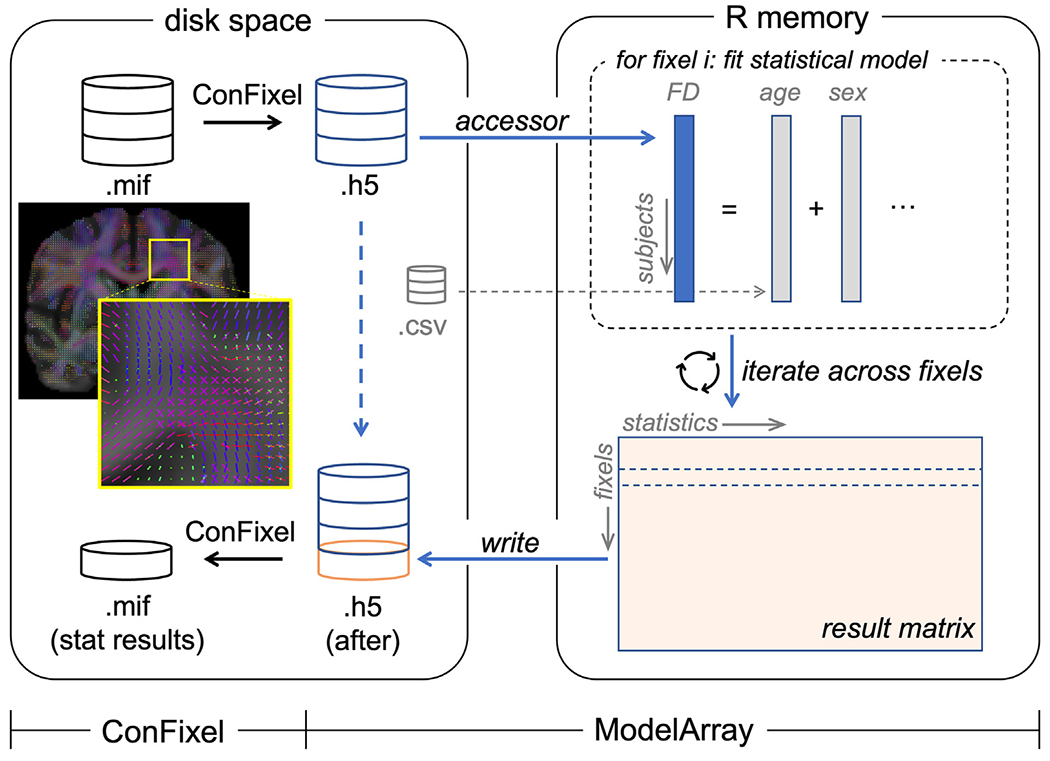
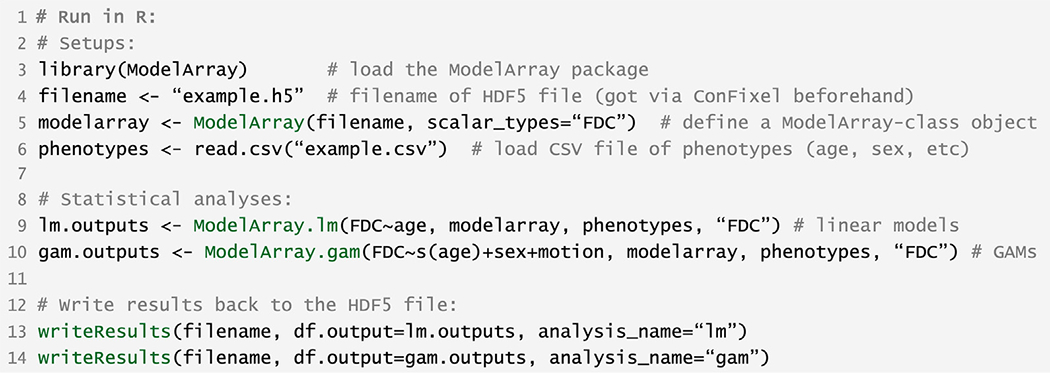
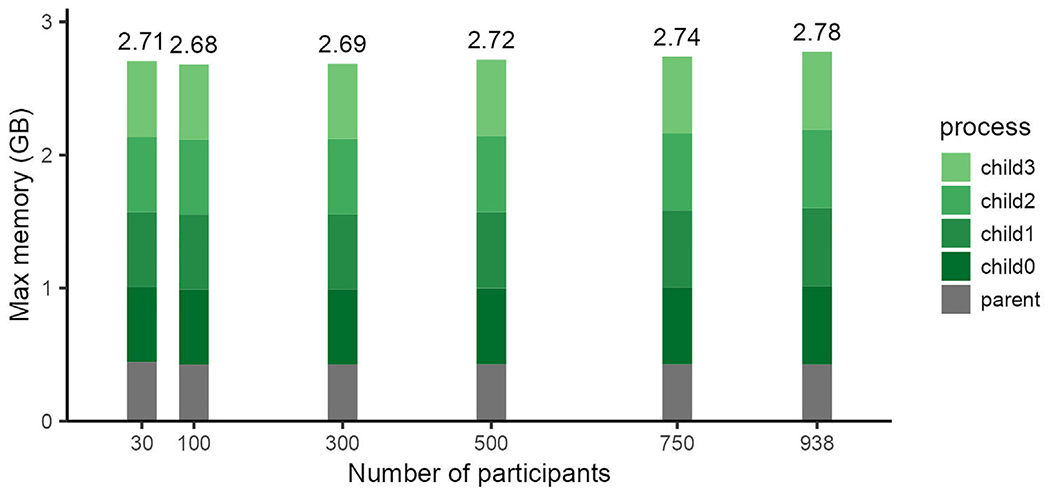
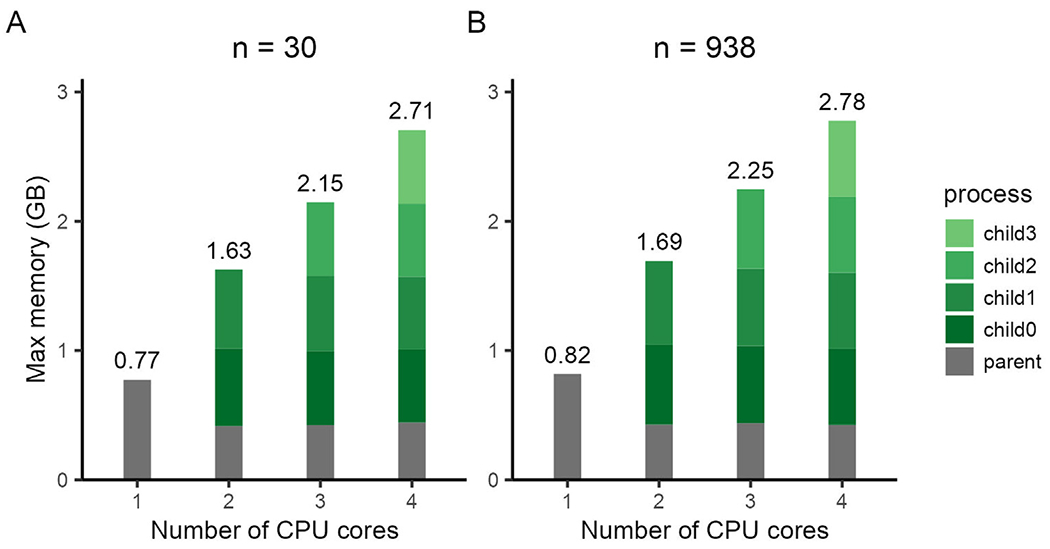
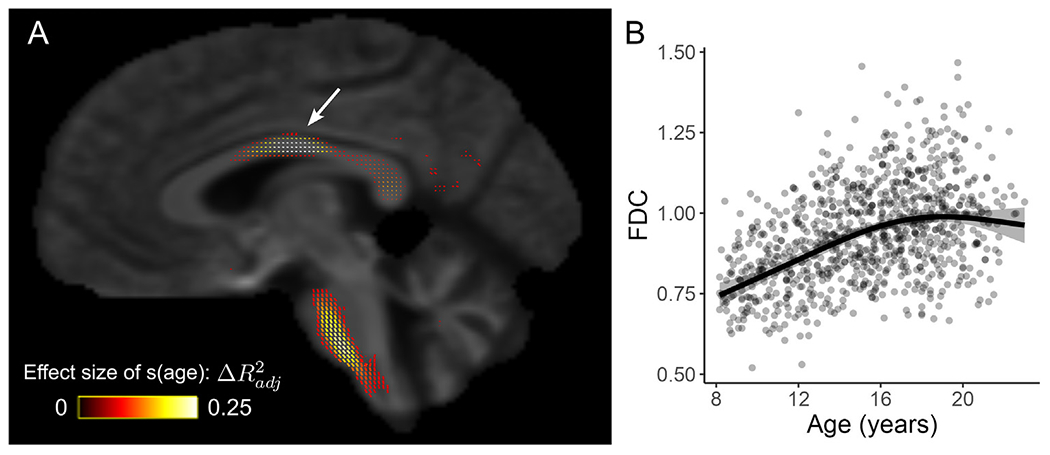
Diffusion MRI is the dominant non-invasive imaging method used to characterize white matter organization in health and disease. Increasingly, fiber-specific properties within a voxel are analyzed using fixels. While tools for conducting statistical analyses of fixel-wise data exist, currently available tools support only a limited number of statistical models. Here we introduce ModelArray, an R package for mass-univariate statistical analysis of fixel-wise data. At present, ModelArray supports linear models as well as generalized additive models (GAMs), which are particularly useful for studying nonlinear effects in lifespan data. In addition, ModelArray also aims for scalable analysis. With only several lines of code, even large fixel-wise datasets can be analyzed using a standard personal computer. Detailed memory profiling revealed that ModelArray required only limited memory even for large datasets. As an example, we applied ModelArray to fixel-wise data derived from diffusion images acquired as part of the Philadelphia Neurodevelopmental Cohort (n = 938). ModelArray revealed anticipated nonlinear developmental effects in white matter. Moving forward, ModelArray is supported by an open-source software development model that can incorporate additional statistical models and other imaging data types. Taken together, ModelArray provides a flexible and efficient platform for statistical analysis of fixel-wise data.
Keywords: Big data; Development; Fixel-based analysis; MRI; Software; Statistical analysis.
Copyright © 2023 The Author(s). Published by Elsevier Inc. All rights reserved.
Figures
References
-
- Alexander LM, Escalera J, Ai L, Andreotti C, Febre K, Mangone A, Vega-Potler N, Langer N, Alexander A, Kovacs M, Litke S, O’Hagan B, Andersen J, Bronstein B, Bui A, Bushey M, Butler H, Castagna V, Camacho N, …, Milham MP, 2017. An open resource for transdiagnostic research in pediatric mental health and learning disorders. Sci. Data, 4 doi:10.1038/sdata.2017.181. - DOI - PMC - PubMed
-
- Bethlehem RAI, Seidlitz J, White SR, Vogel JW, Anderson KM, Adamson C, Adler S, Alexopoulos GS, Anagnostou E, Areces-Gonzalez A, Astle DE, Auyeung B, Ayub M, Bae J, Ball G, Baron-Cohen S, Beare R, Bedford SA, Benegal V, …, Alexander-Bloch AF, 2022. Brain charts for the human lifespan. Nature 1–11. doi:10.1038/s41586-022-04554-y. - DOI - PMC - PubMed
Publication types
MeSH terms
Grants and funding
- RF1 MH121867/MH/NIMH NIH HHS/United States
- R37 MH125829/MH/NIMH NIH HHS/United States
- R01 MH123550/MH/NIMH NIH HHS/United States
- R01 MH120482/MH/NIMH NIH HHS/United States
- U24 NS130411/NS/NINDS NIH HHS/United States
- RF1 MH116920/MH/NIMH NIH HHS/United States
- R01 MH113550/MH/NIMH NIH HHS/United States
- R01 MH120174/MH/NIMH NIH HHS/United States
- R01 NS085211/NS/NINDS NIH HHS/United States
- T32 DC000038/DC/NIDCD NIH HHS/United States
- K99 MH127293/MH/NIMH NIH HHS/United States
- R01 MH119185/MH/NIMH NIH HHS/United States
- R01 MH112847/MH/NIMH NIH HHS/United States
- R01 EB022573/EB/NIBIB NIH HHS/United States
- R01 NS112274/NS/NINDS NIH HHS/United States
LinkOut - more resources
Full Text Sources
Research Materials
