. 2023 May:230:109439.
doi: 10.1016/j.exer.2023.109439. Epub 2023 Mar 15.

The accumulated oxygen deficit as an indicator of the ischemic retinal insult

Affiliations

The accumulated oxygen deficit as an indicator of the ischemic retinal insult

Norman P Blair et al. Exp Eye Res. 2023 May.

Abstract

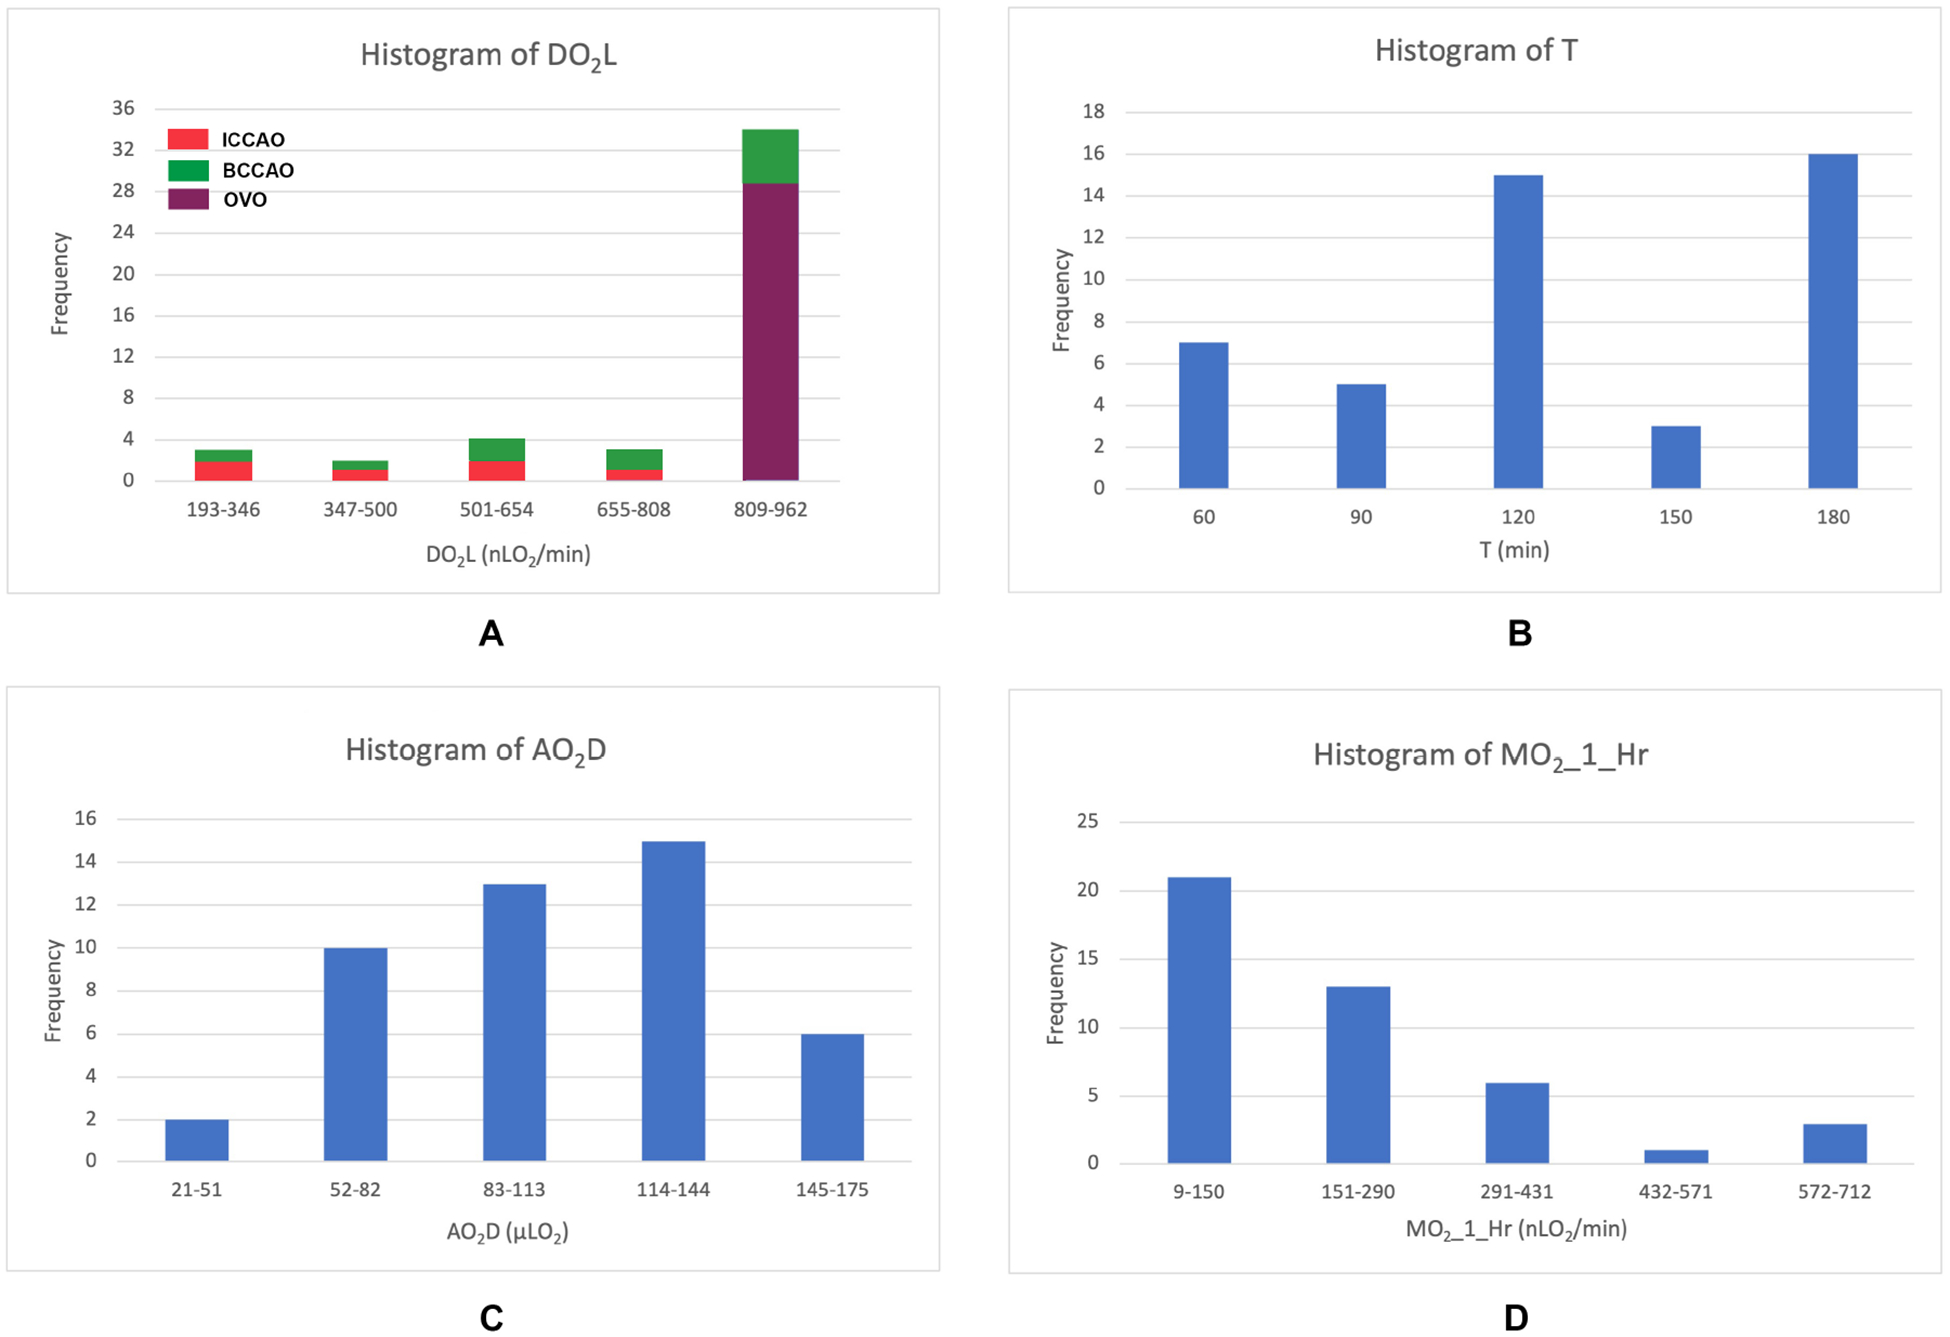
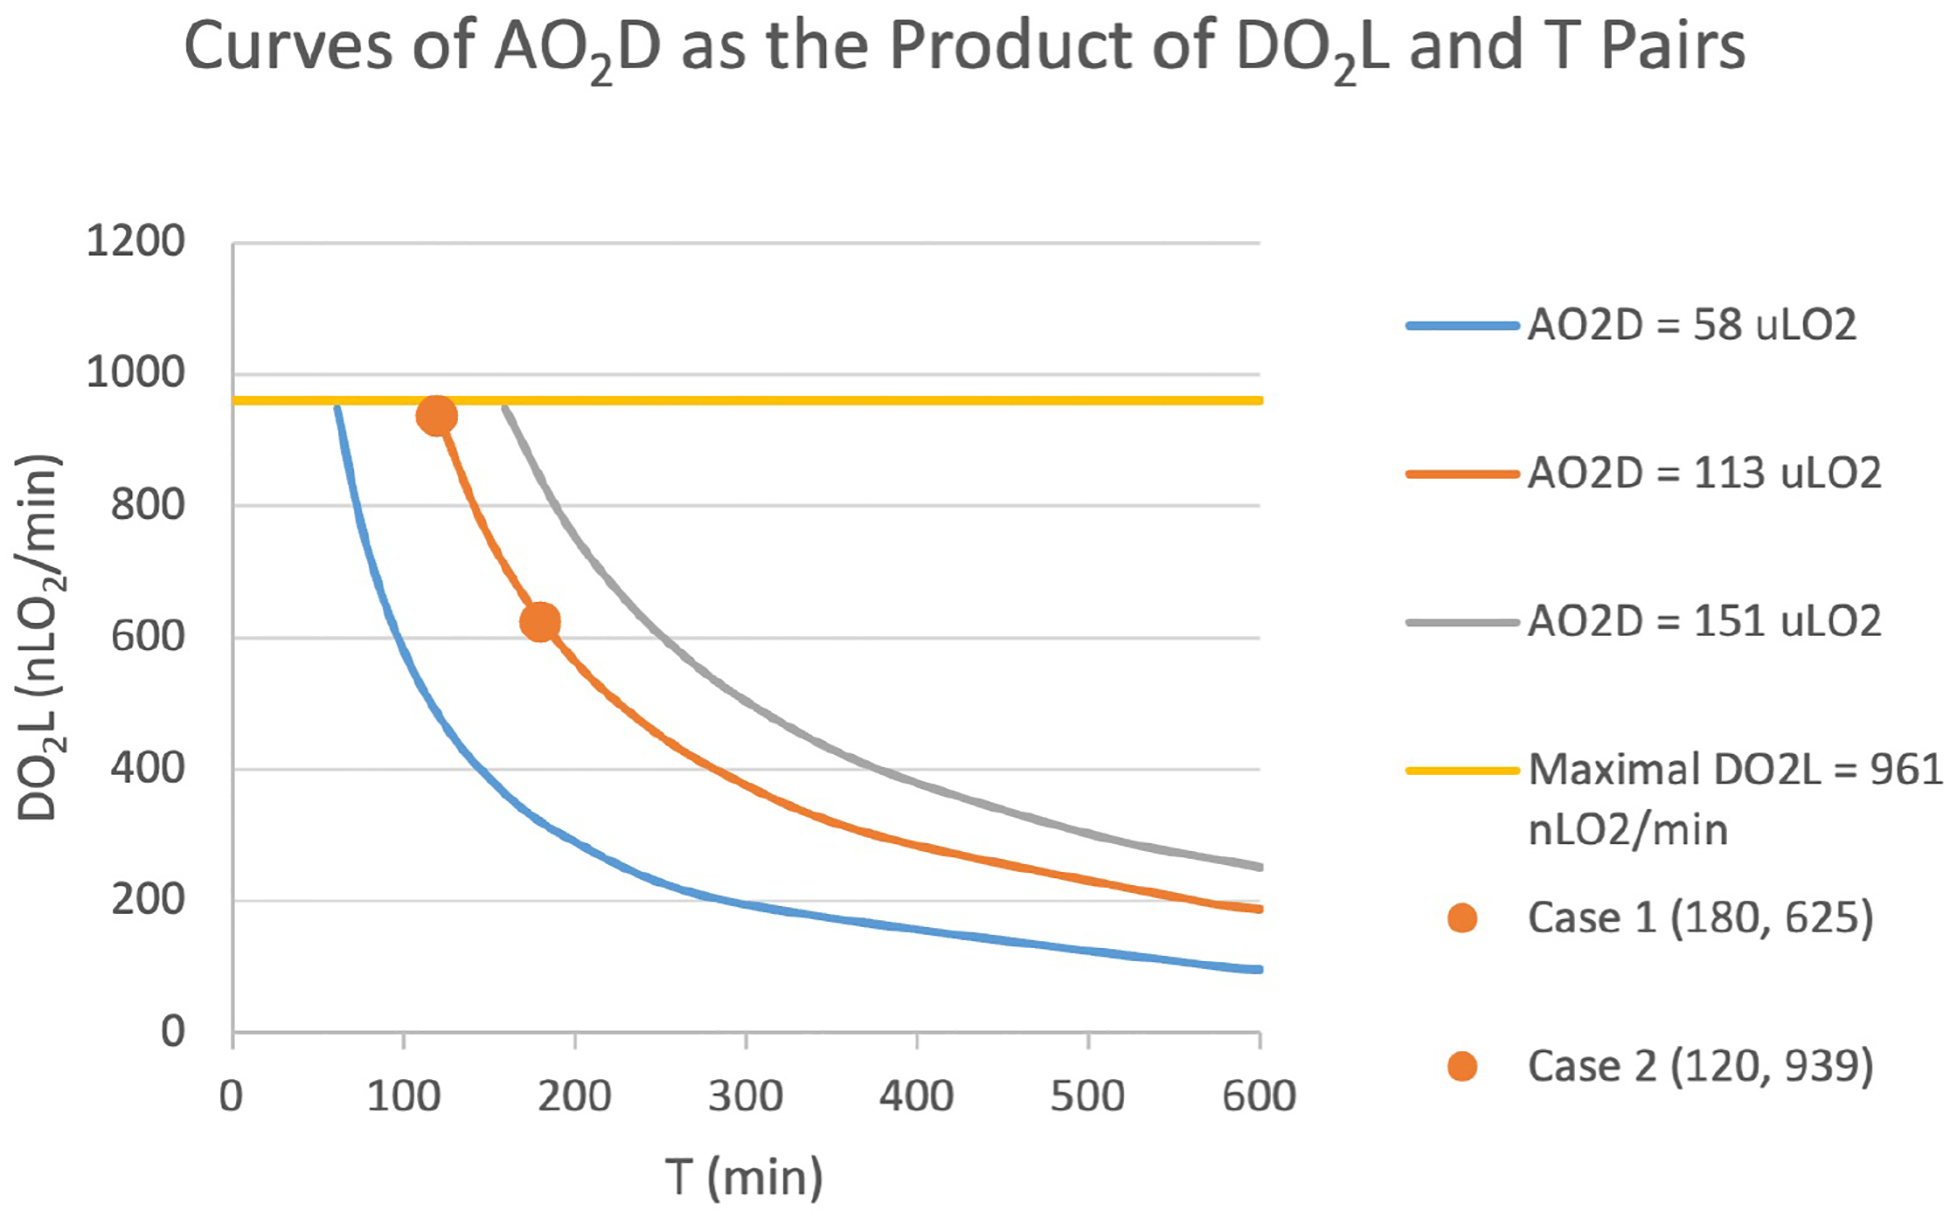
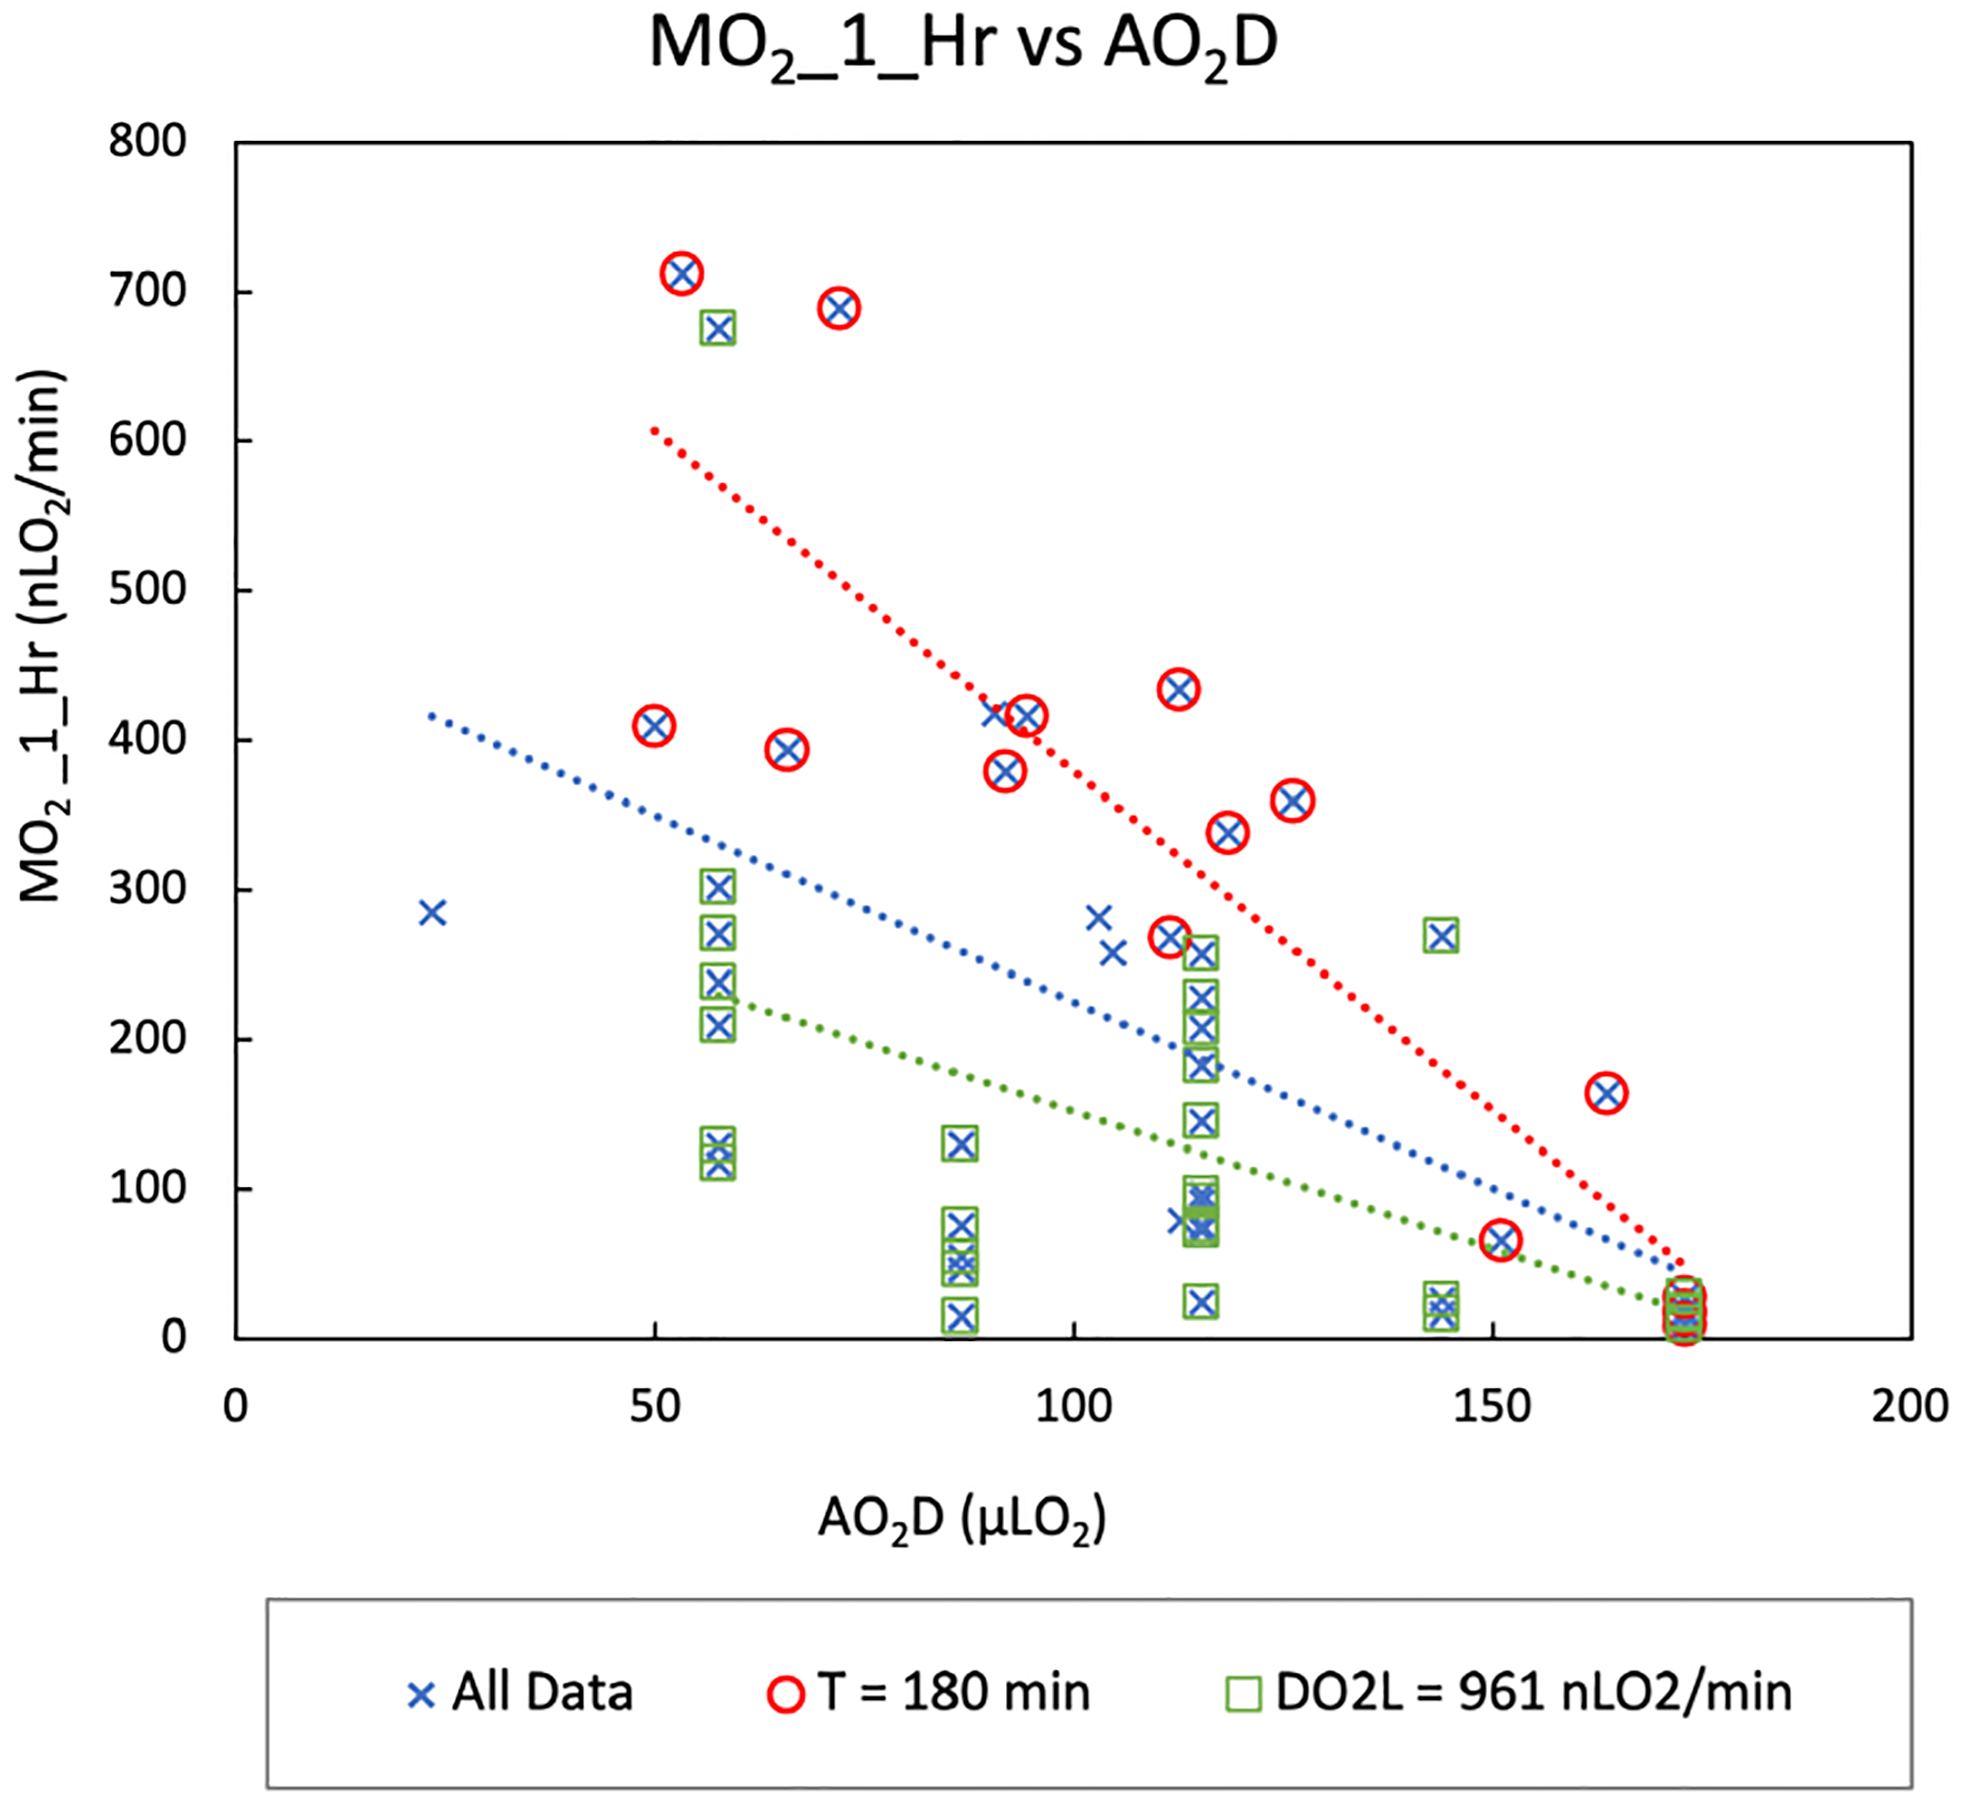
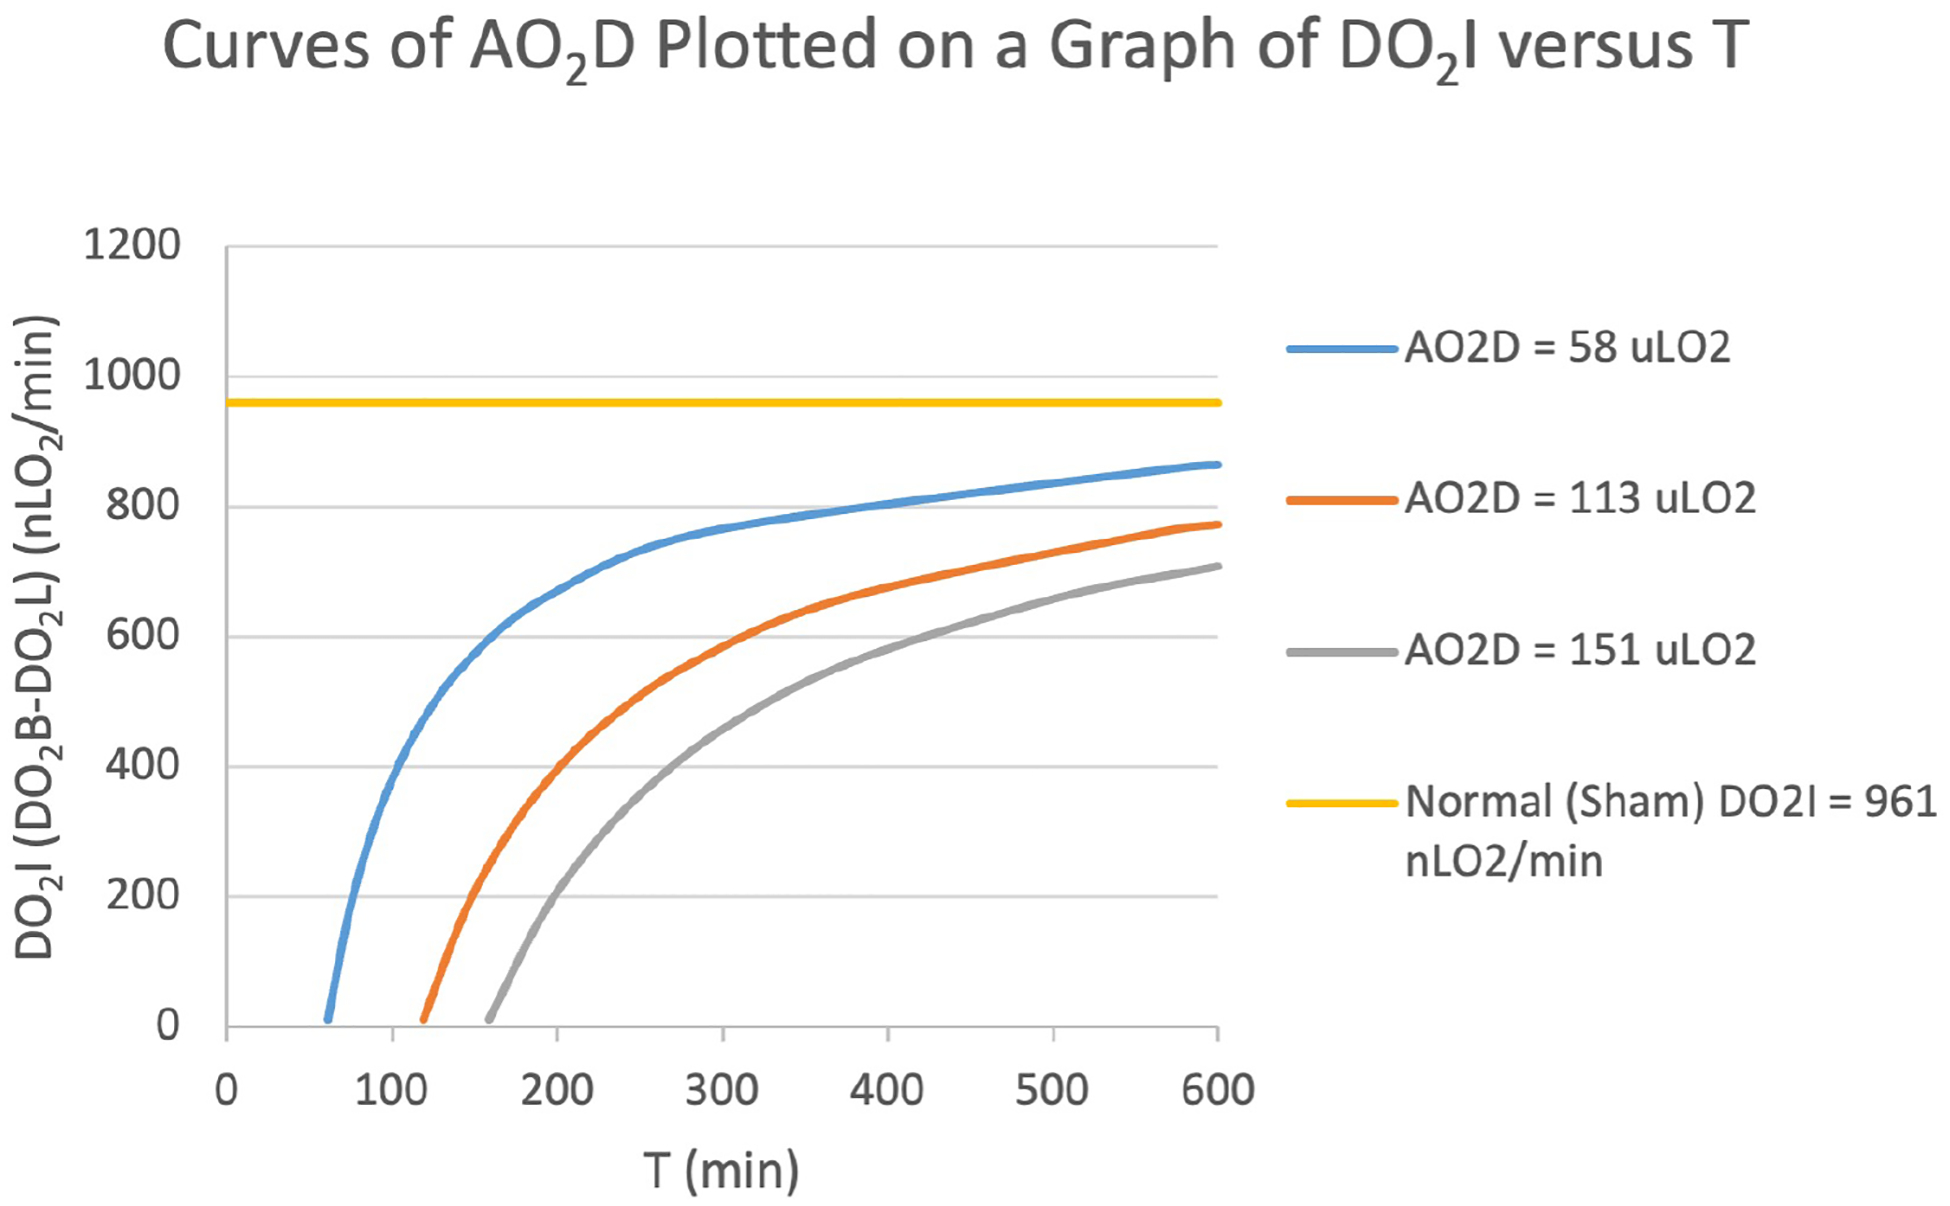
We here attempt to improve quantification of the ischemic retinal insult, that is, what is imposed on the retinal tissue by ischemia, especially in experimental models of ischemia. The ischemic retinal insult initiates the ischemic retinal injury (or outcome). Accordingly, it is reasonable to assume that the better the quantification of the insult, the better the correlation with, and thereby estimation of, the injury. The insult seldom has been quantified in terms of the relevant physiological factors, especially in connection with the rate of oxygen delivery (DO2). We here propose the accumulated oxygen deficit (AO2D) as an indicator of the ischemic retinal insult. We hypothesized that AO2D is correlated with the rate of oxygen metabolism measured 1 h after reperfusion following an episode of ischemia (MO2_1_Hr). Previously, we showed that MO2_1_Hr is related to the electroretinogram amplitude and the retinal thickness when they are measured seven days after reperfusion. We studied 27 rats, as well as 26 rats from our published data on retinal ischemia in which we had measurements of DO2 and duration of ischemia (T) of various levels and durations. We also measured DO2 in 29 rats treated with sham surgery. Ischemia was induced by either ipsilateral or bilateral common carotid artery occlusion or by ophthalmic artery occlusion, which gave a wide range of DO2. DO2 and MO2_1_Hr were evaluated based on three types of images: 1) red-free images to measure vessel diameters, 2) fluorescence images to estimate blood velocities by the displacement of intravascular fluorescent microspheres over time, and 3) phosphorescence images to quantify vascular oxygen tension from the phosphorescence lifetime of an intravascular oxygen sensitive phosphor. Loss of oxygen delivery (DO2L) was calculated as the difference between DO2 under normal/sham condition and DO2 during ischemia. AO2D, a volume of oxygen, was calculated as the product DO2L and T. Including all data, the linear relationship between AO2D and MO2_1_Hr was significant (R2 = 0.261, P = 0.0003). Limiting data to that in which T or DO2L was maximal also yielded significant relationships, and revealed that DO2L at a long duration of ischemia contributed disproportionately more than T to MO2_1_Hr. We discuss the potential of AO2D for quantifying the ischemic retinal insult, predicting the ischemic retinal injury and evaluating the likelihood of infarction.

Keywords: Imaging; Retinal blood flow; Retinal ischemia; Retinal oxygen delivery; Retinal oxygen metabolism.


Conflict of interest statement

Declaration of competing interest M. Shahidi holds a patent for the oxygen imaging technology. The other authors have no interests to declare.

Figures

Figure 1:
Figure 1:
The distributions of the loss of oxygen delivery during ischemia (DO2L), duration of ischemia (T), accumulated oxygen deficit (AO2D) and the rate of oxygen metabolism at one hour after reperfusion (MO2_1_Hr). These data are presented as histograms. The y-axis indicates the number of rats (frequency). We divided the results arbitrarily into five equal intervals in order to allow a sense of their distribution. A: Histogram of DO2L. For this panel we divided the bars by type of vascular occlusion: red indicates ipsilateral common carotid artery occlusion (ICCAO), green shows bilateral common carotid occlusion (BCCAO) and purple depicts ophthalmic artery occlusion (OVO). B: Histogram of T. C: Histogram of AO2D. D: Histogram of MO2_1_Hr.
Figure 2:
Figure 2:
Curves of AO2D as the Product of DO2L and T Pairs Curves representing pairs of loss of oxygen delivery (DO2L) and duration of ischemia (T) for three representative values of accumulated oxygen deficit (AO2D) in our experimental data are shown. The values of 58 and 151 μLO2 were selected because they were near the lower and upper ends of the range in our data, respectively. The value 113 μLO2 was chosen because it was near the middle of the range. In addition, there were two cases of DO2L and T whose product was 113 μLO2, and these are indicated by dots on curve. This illustrates how more than one pair of DO2L and T can yield the same AO2D. The horizontal line at DO2L = 961 nLO2/min indicates the maximal loss of oxygen delivery, since this represents the condition in which all of the oxygen delivery present at baseline has been lost. The values of T were limited to less than 600 min because, at low values of DO2L, T increases severely. These values of T, far above the maximal value of 180 min used in our experiments, are included for illustrative purposes. Each curve fit perfectly to a power equation (x*y = a, that is, y = a*x−1) because of the procedure by which the points were calculated.
Figure 3:
Figure 3:
Rate of oxygen metabolism at one 1 hour after reperfusion (MO2_1_Hr) plotted versus the accumulated oxygen deficit (AO2D) over the course of ischemia. Data were obtained from rat eyes undergoing various levels and durations of retinal ischemia. Linear regression lines are presented using either all data (blue crosses), data in which T (duration of ischemia) = 180 min (red circles) or data in which DO2L (loss of oxygen delivery during ischemia) = 961 nLO2/min (green squares). Overlapping symbols on a data point indicates that the data point falls into more than one group used for the regressions. We note that there were five data points with neither T = 180 nor DO2L = 961, and also there were four data points in which both T = 180 and DO2L = 961. Since these four had the most extreme values, they had the highest AO2D values and the lowest associated MO2_1_Hr values.
Figure 4:
Figure 4:
Figure 29–4 and its legend from Lassen and Astrup.(Lassen, 1987) The legend from that reference reads: “Ischemia severity-duration diagram with line of discrimination between reversible (penumbra) and irreversible (infarction) paralysis. Experiments with permanent middle cerebral artery (MCA) occlusion in awake Macaca monkeys left open possibility of chronic penumbra (impaired function without infarction) in flow interval of 18 to 23 ml/1000 g/min. (Modified from Jones et al.)” (Jones et al., 1981)
Figure 5:
Figure 5:
Curves of AO2D Plotted on a Graph of DO2I versus T Values of accumulated oxygen deficit (AO2D, the product of pairs of loss of oxygen delivery (DO2L) and durations of ischemia (T)) for three representative values of AO2D in our data are plotted on a graph of the remaining rate of oxygen delivery (DO2I) under ischemia versus T. The values of 58 and 151 μLO2 were selected because they were near the lower and upper ends of the range in our data, respectively. The value 113 μLO2 was chosen because it was near the middle of the range. DO2I, T and AO2D are related as follows: DO2I = − (AO2D/T) + DO2B, where DO2B is DO2 at baseline, that is, with no ischemia (taken to be 961 nLO2/min, from the sham group). A horizontal line has been placed at the maximal value of DO2I in which none of the DO2 present at baseline (DO2B) has been lost. The values of T were limited to less than 600 min because, at large values of DO2I, T increases severely. These values of T, far above the maximal value of 180 min used in our experiments, are included for illustrative purposes.

Similar articles

References

    1. Alder VA, Ben-Nun J, Cringle SJ, 1990. PO2 profiles and oxygen consumption in cat retina with an occluded retinal circulation. Investigative ophthalmology & visual science 31, 1029–1034. - PubMed
    1. Ames A 3rd, 2000. CNS energy metabolism as related to function. Brain Res Brain Res Rev 34, 42–68. - PubMed
    1. Ames A 3rd, Li YY, Heher EC, Kimble CR, 1992. Energy metabolism of rabbit retina as related to function: high cost of Na+ transport. The Journal of neuroscience : the official journal of the Society for Neuroscience 12, 840–853. - PMC - PubMed
    1. Ames A 3rd, Maynard KI, Kaplan S, 1995. Protection against CNS ischemia by temporary interruption of function-related processes of neurons. Journal of cerebral blood flow and metabolism : official journal of the International Society of Cerebral Blood Flow and Metabolism 15, 433–439. - PubMed
    1. Auer RN, 1998. Histopathology of Cerebral Ischemia, in: Ginsberg MD, Bogousslavsky J (Ed.), Cerebrovascular Disease:Pathophysiology, Diagnosis, Management. Blackwell Science, Malden, MA, pp. 90–101.

Publication types