. 2023 Apr;11(3):282-292.
doi: 10.1002/ueg2.12375. Epub 2023 Mar 17.

Colorectal polyps: Targets for fluorescence-guided endoscopy to detect high-grade dysplasia and T1 colorectal cancer

Affiliations

Colorectal polyps: Targets for fluorescence-guided endoscopy to detect high-grade dysplasia and T1 colorectal cancer

Nik Dekkers et al. United European Gastroenterol J. 2023 Apr.

Abstract

Background: Differentiating high-grade dysplasia (HGD) and T1 colorectal cancer (T1CRC) from low-grade dysplasia (LGD) in colorectal polyps can be challenging. Incorrect recognition of HGD or T1CRC foci can lead to a need for additional treatment after local resection, which might not have been necessary if it was recognized correctly. Tumor-targeted fluorescence-guided endoscopy might help to improve recognition.

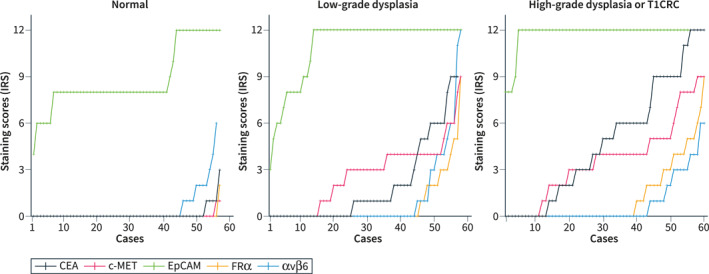
Objective: Selecting the most suitable HGD and T1CRC-specific imaging target from a panel of well-established biomarkers: carcinoembryonic antigen (CEA), c-mesenchymal-epithelial transition factor (c-MET), epithelial cell adhesion molecule (EpCAM), folate receptor alpha (FRα), and integrin alpha-v beta-6 (αvβ6).

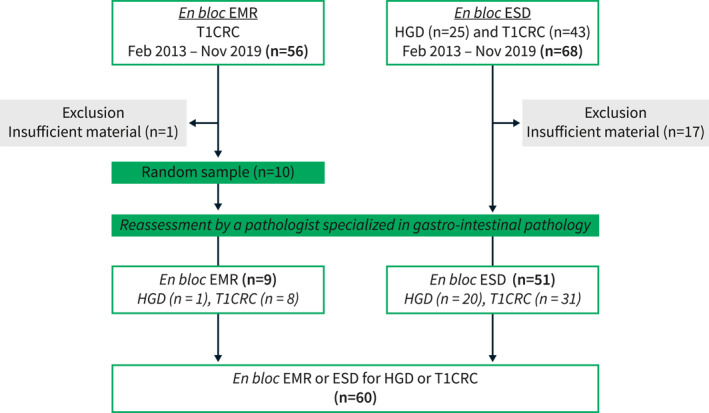
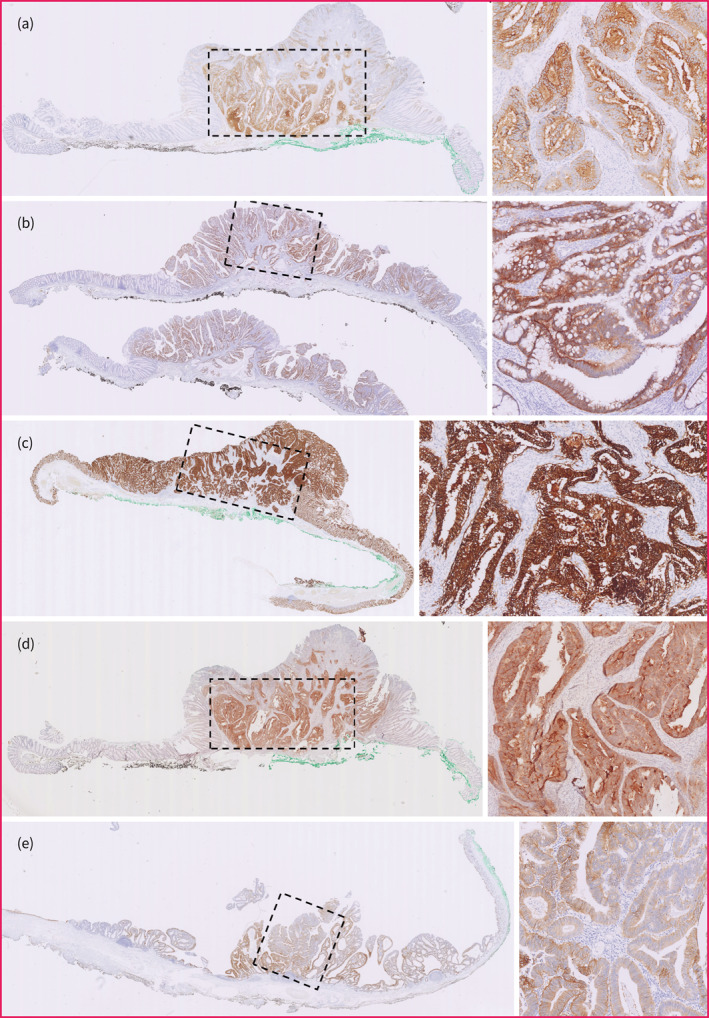
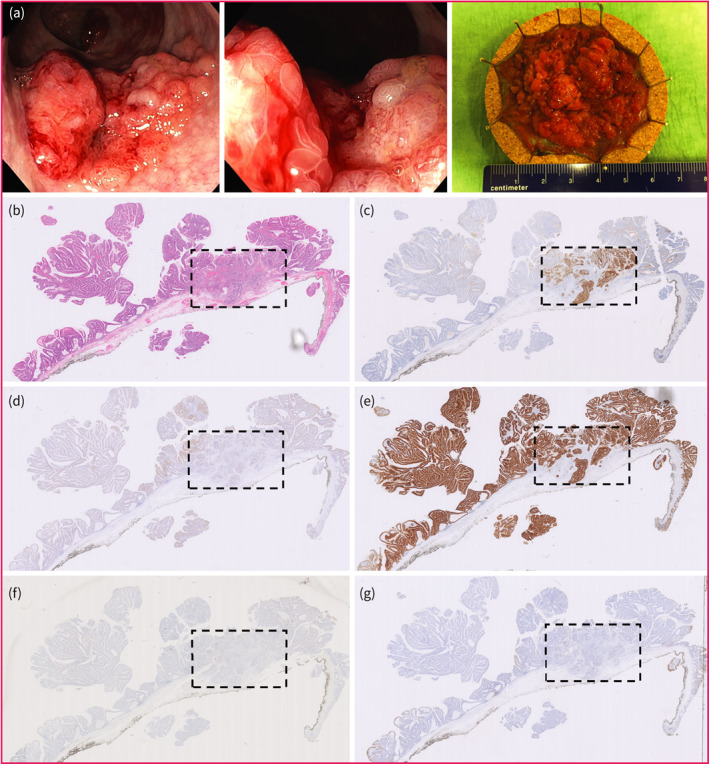
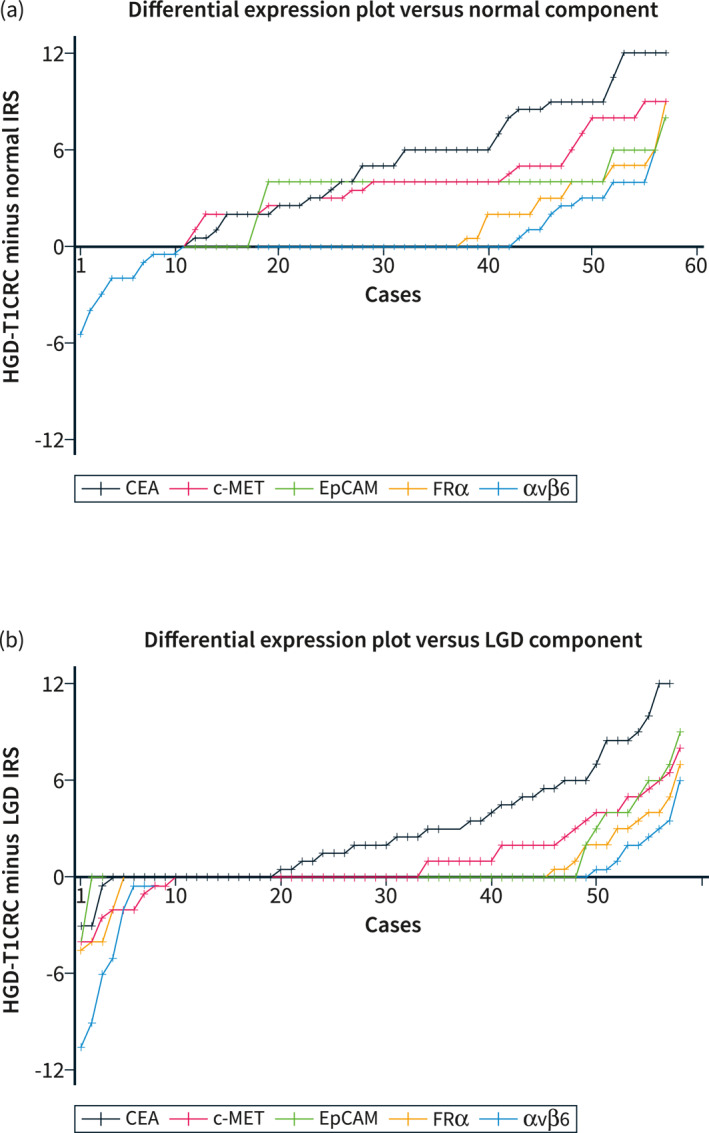
Methods: En bloc resection specimens of colorectal polyps harboring HGD or T1CRC were selected. Immunohistochemistry on paraffin sections was used to determine the biomarker expression in normal epithelium, LGD, HGD, and T1CRC (scores of 0-12). The differential expression in HGD-T1CRC components compared to surrounding LGD and normal components was assessed, just as the sensitivity and specificity of each marker.

Results: 60 specimens were included (21 HGD, 39 T1CRC). Positive expression (score >1) of HGD-T1CRC components was found in 73.3%, 78.3%, and 100% of cases for CEA, c-MET, and EpCAM, respectively, and in <40% for FRα and αvβ6. Negative expression (score 0-1) of the LGD component occurred more frequently for CEA (66.1%) than c-MET (31.6%) and EpCAM (0%). The differential expression in the HGD-T1CRC component compared to the surrounding LGD component was found for CEA in 66.7%, for c-MET in 43.1%, for EpCAM in 17.2%, for FRα in 22.4%, and for αvβ6 in 15.5% of the cases. Moreover, CEA showed the highest combined sensitivity (65.0%) and specificity (75.0%) for the detection of an HGD-T1CRC component in colorectal polyps.

Conclusion: Of the tested targets, CEA appears the most suitable to specifically detect HGD and T1 cancer foci in colorectal polyps. An in vivo study using tumor-targeted fluorescence-guided endoscopy should confirm these findings.

Keywords: CRC; advance; biomarkers; colorectal cancer; colorectal polyps; dysplasia; endoscopy; fluorescence; resection; target.


Conflict of interest statement

Jurjen Boonstra is a consultant at Boston Scientific.

Figures

FIGURE 1
FIGURE 1
Flowchart of patient selection. CRC, colorectal cancer; EMR, endoscopic mucosal resection; ESD, endoscopic submucosal dissection; HGD, high‐grade dysplasia.
FIGURE 2
FIGURE 2
Staining scores of CEA, c‐MET, EpCAM, FRα, and αvβ6 in normal colorectal tissue, low‐grade dysplasia (LGD) and high‐grade dysplasia (HGD) or T1 colorectal cancer (T1CRC) were expressed as immunoreactive scores. The total immunoreactive scores were independently arranged in ascending order to demonstrate the distributions across our cohort. CEA, carcinoembryonic antigen; c‐MET, c‐mesenchymal‐epithelial transition factor; CRC, colorectal cancer; EpCAM, epithelial cell adhesion molecule; FRα, folate receptor alpha; IRS, immunoreactive score.
FIGURE 3
FIGURE 3
Positive staining pattern of all targets in the high‐grade dysplasia (HGD) or T1 colorectal cancer (T1CRC) component. For each target, an illustrative case was selected with positive expression (i.e. staining score >1) in the HGD‐T1CRC component. The region enclosed by the rectangle with dashed line consists of HGD or T1CRC. An overview image (left) and enlargement of the HGD‐T1CRC region (right) are provided for each target. (a) CEA expression and (b) c‐MET expression. (c) EpCAM expression. (d) FRα expression. (e) αvβ6 expression. CEA, carcinoembryonic antigen; c‐MET, c‐mesenchymal‐epithelial transition factor; EpCAM, epithelial cell adhesion molecule; FRα, folate receptor.
FIGURE 4
FIGURE 4
Overall staining pattern of all targets in the same case of T1 colorectal cancer (T1CRC). The region enclosed by the rectangle with dashed line consists of HGD‐T1CRC. (a) Endoscopic images and resection specimen after endoscopic submucosal dissection. (b) HE slide. (c) CEA expression. (d) c‐MET expression. (e) EpCAM expression. (f) FRα expression. (g) αvβ6 expression. HE hematoxylin‐eosin. CEA, carcinoembryonic antigen; c‐MET, c‐mesenchymal‐epithelial transition factor; EpCAM, epithelial cell adhesion molecule; FRα, folate receptor.
FIGURE 5
FIGURE 5
Differential expression plots. Differential expression scores were calculated by subtracting the IRS of the normal or low‐grade dysplasia (LGD) component from the IRS of the HGD‐T1CRC component. Differential expression scores were independently arranged and connected in ascending order to demonstrate the distributions across the cohort. (a) shows the differential expression plot for HGD‐T1CRC components compared to surrounding normal colorectal tissue. (b) shows the differential expression plot for HGD‐T1CRC components compared to surrounding components of LGD. CEA, carcinoembryonic antigen; c‐MET, c‐mesenchymal‐epithelial transition factor; CRC, colorectal cancer; EpCAM, epithelial cell adhesion molecule; FRα, folate receptor alpha; IRS, immunoreactive score; LGD, low‐grade dysplasia.

References

    1. Dekker E, Tanis PJ, Vleugels JLA, Kasi PM, Wallace MB. Colorectal cancer. Lancet. 2019;394(10207):1467–80. 10.1016/s0140-6736(19)32319-0 - DOI - PubMed
    1. Dekkers N, Dang H, van der Kraan J, le Cessie S, Oldenburg PP, Schoones JW, et al. Risk of recurrence after local resection of T1 rectal cancer: a meta‐analysis with meta‐regression. Surg Endosc. 2022;36(12):9156–68. 10.1007/s00464-022-09396-3 - DOI - PMC - PubMed
    1. Dang H, Dekkers N, le Cessie S, van Hooft JE, van Leerdam ME, Oldenburg PP, et al. Risk and time pattern of recurrences after local endoscopic resection of T1 colorectal cancer: a meta‐analysis. Clin Gastroenterol Hepatol. 2022;20(2):e298–314. 10.1016/j.cgh.2020.11.032 - DOI - PubMed
    1. Hashiguchi Y, Muro K, Saito Y, Ito Y, Ajioka Y, Hamaguchi T, et al. Japanese Society for Cancer of the Colon and Rectum (JSCCR) guidelines 2019 for the treatment of colorectal cancer. Int J Clin Oncol. 2020;25(1):1–42. 10.1007/s10147-019-01485-z - DOI - PMC - PubMed
    1. Backes Y, Schwartz MP, ter Borg F, Wolfhagen FHJ, Groen JN, de Vos tot Nederveen Cappel WH, et al. Multicentre prospective evaluation of real‐time optical diagnosis of T1 colorectal cancer in large non‐pedunculated colorectal polyps using narrow band imaging (the OPTICAL study). Gut. 2019;68(2):271–9, 10.1136/gutjnl-2017-314723 - DOI - PubMed

Publication types

MeSH terms

Substances