. 2023 Mar 17;14(3):201.
doi: 10.1038/s41419-023-05720-4.

GEMC1 and MCIDAS interactions with SWI/SNF complexes regulate the multiciliated cell-specific transcriptional program

Affiliations

GEMC1 and MCIDAS interactions with SWI/SNF complexes regulate the multiciliated cell-specific transcriptional program

Michael Lewis et al. Cell Death Dis. .

Abstract

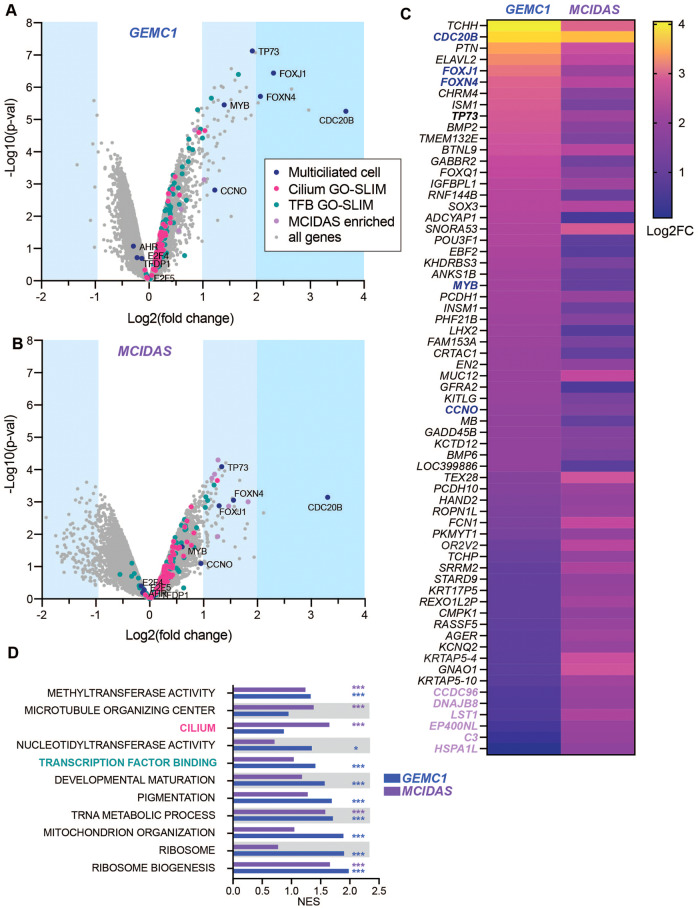
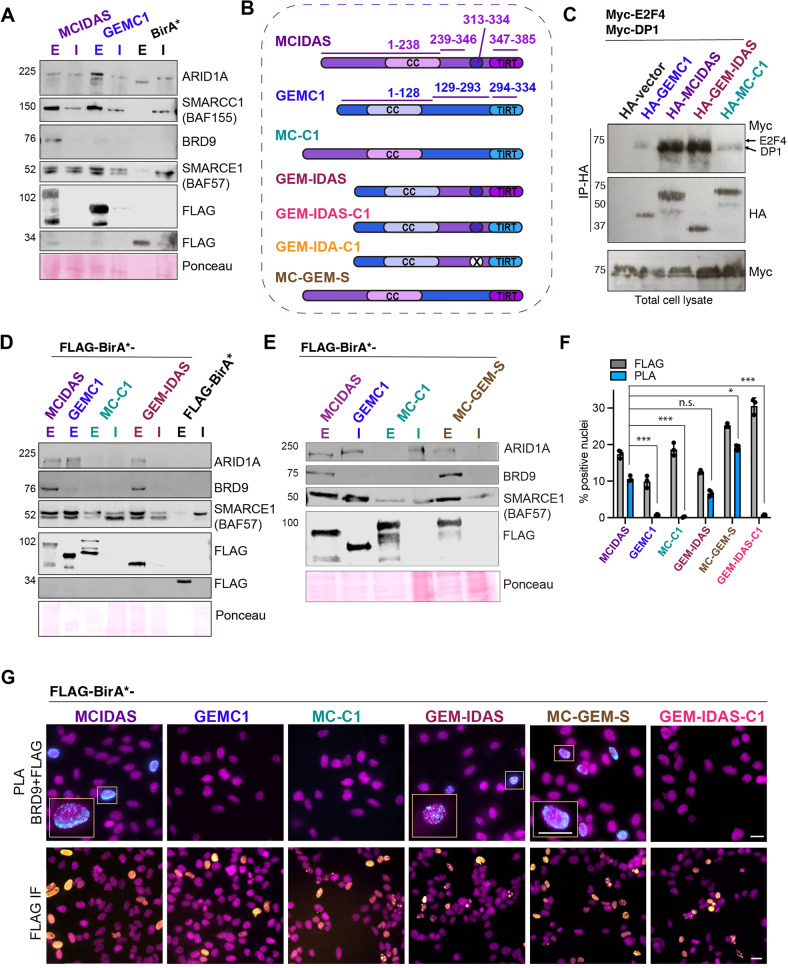
Multiciliated cells (MCCs) project dozens to hundreds of motile cilia from their apical surface to promote the movement of fluids or gametes in the mammalian brain, airway or reproductive organs. Differentiation of MCCs requires the sequential action of the Geminin family transcriptional activators, GEMC1 and MCIDAS, that both interact with E2F4/5-DP1. How these factors activate transcription and the extent to which they play redundant functions remains poorly understood. Here, we demonstrate that the transcriptional targets and proximal proteomes of GEMC1 and MCIDAS are highly similar. However, we identified distinct interactions with SWI/SNF subcomplexes; GEMC1 interacts primarily with the ARID1A containing BAF complex while MCIDAS interacts primarily with BRD9 containing ncBAF complexes. Treatment with a BRD9 inhibitor impaired MCIDAS-mediated activation of several target genes and compromised the MCC differentiation program in multiple cell based models. Our data suggest that the differential engagement of distinct SWI/SNF subcomplexes by GEMC1 and MCIDAS is required for MCC-specific transcriptional regulation and mediated by their distinct C-terminal domains.


Conflict of interest statement

XS is a founder and scientific advisor of Nuage Therapeutics. All other authors declare no conflicts of interest.

Figures

Fig. 1
Fig. 1. GEMC1 and MCIDAS overexpression activates overlapping and distinct target genes.
A Volcano plots (-Log10 p-value vs Log2 fold change) of microarray analysis of gene expression following transient transfection of GEMC1 and B MCIDAS in AD-293 cells (n = 2 biological replicates). Genes in the Cilium and Transcription Factor Binding GO-SLIM categories (TFB = Transcription factor binding), genes implicated specifically in multiciliated cells or genes enriched with MCIDAS over GEMC1 are indicated by color (legend in A, applies to A-D). Full details in Supplementary Tables S2 and S3. C Heatmap comparing expression (Log2 fold change = Log2FC) of most upregulated genes following either GEMC1 or MCIDAS expression. Color coding of gene categories is applied as in A. D Gene set enrichment analysis of the gene expression data using GO-SLIM categories. The nominal enrichment score (NES) for each category with either GEMC1 or MCIDAS is shown. Details in Supplementary Table S3.
Fig. 2
Fig. 2. The proximal interactomes of GEMC1 and MCIDAS.
A Western blots from lysates of AD-293 cells transfected with FLAG-BirA*, FLAG-BirA*-GEMC1 or FLAG-BirA*-MCIDAS. Expression of baits in cells with or without biotin supplementation is shown using the FLAG antibody (bottom panel) and labeling in biotin supplemented samples with Strep-HRP (top panel). B Graph of protein number unique or common to each sample using a cutoff >50 spectral counts (SC) with a BFDR score of <0.05 in either one of the samples (n = 3 biological replicates). C Scatter plot of peptides identified in GEMC1 or MCIDAS samples (Log2- spectral counts of 3 biological replicates). All peptides with BFDR < 0.05 in one of the samples from analysis with SAINTexpress are shown (Full list in Supplementary Table S4) [22]. Specific subsets are highlighted including key Transcription, components of the E2F/RB or DREAM complexes, SWI/SNF and Mediator related proteins. D Dot plot depicting relative abundance and spectral counts for selected proteins. B = BirA*, G = GEMC1, and M = MCIDAS. Proteins are grouped by those involved in E2F or MCC differentiation (top row), components of SW/SNF complexes (middle row) and components of the Mediator complex (bottom row).
Fig. 3
Fig. 3. Specific interactions with SWI/SNF subcomplexes.
A BioID-AP western blots for ARID1A, BRD9 and core SWI/SNF subunits SMARCE1 (BAF155) and SMARCC1 (BAF57) demonstrate the relative specificity for BAF and ncBAF complexes. All uncropped blots are shown in Supplementary Fig. S1. B Schematic illustration of the structure of GEMC1-MCIDAS hybrid proteins. C Co-immunoprecipitation experiments demonstrate enhanced E2F4-DP1 interactions with the MCIDAS C-terminus. HEK293T cells were transfected with HA-tagged vector, GEMC1, MCIDAS, GEM-IDAS and MC-C1, Myc-tagged DP1, and Myc-E2F4. Lysates were immunoprecipitated with anti-HA antibodies and westerns carried out for Myc and HA following transfer to PVDF. Total lysates are shown blotted for Myc. Data presented is representative of 2 biological replicates. D, E BioID-AP westerns blots for ARID1A, BRD9, and core SWI/SNF components following expression of hybrid proteins (see B for schematic). Ponceau staining shown for loading and transfer control. F Quantification of the percentage of transfected HeLa cells and PLA positive cells is shown in right panel. Mean (bar) with standard deviation and values of individual experiments (circles) are shown. For statistical analysis, a paired t-test on the PLA + cells normalized to transfection efficiency was performed from three independent experiments using a generalized linear model (see “Methods” section). MCIDAS vs GEMC1, p = <1e-06(***), MCIDAS vs MCI-C1, p = <1e-06(***), MCIDAS vs GEM-IDAS, p = .836(n.s), MCIDAS vs MC-GEM-S, p = 0.0074(*), MCIDAS vs GEM-IDAS-C1, p = <1e-06(***). G Representative immunofluorescence (IF) images of HeLa cells transfected with the indicated FLAG-BirA* tagged proteins (bottom panel, FLAG in yellow and DAPI (DNA) in magenta) and PLA-IF (top panels, PLA in cyan and DAPI (DNA) in magenta). Scale bar = 20 μM.
Fig. 4
Fig. 4. Transcriptional dependence on SWI/SNF subcomplexes.
A Validation of AD-293 ARID1A knock-out (KO) cells. Western blots for ARID1A and BRD9 are shown. Actin and Ponceau staining serve as loading and transfer controls. B Quantitative real-time PCR (qRT-PCR) analysis of CCNO and FOXJ1 expression in AD-293 cells following transfection with the indicated genes. WT vs ARID1A-KO p-values were 0.0287* and 0.045* for GEMC1 and 0.026* and 0.007** for MCIDAS. Transfected genes are color coded in the key to the right. C. qRT-PCR analysis of HSPAL1 and CCDC96 in parental or ARID1A-KO AD-293 cells. Statistical analysis as in B revealed no significant differences. D qRT-PCR analysis of HSPAL1 and CCDC96 in parental or ARID1A-KO AD-293 cells treated with 5 μM of I-BRD9. WT vs I-BRD9 p-values were 0.011* (HSPA1L), 0.006**(CCDC96), and E 0.0006***(FOXJ1) for MCIDAS. Color coding as shown in panel B. F qRT-PCR analysis of HSPAL1 and CCDC96 expression in AD-293 cells following transfection with the indicated genes. Transfected genes are color coded in the key to the right. For BF, results from three independent experiments are shown with the bars indicating the mean and the standard deviation shown. For statistical analysis a paired t-test was used, ***p ≤ 0.001, **p ≤ 0.01, and *p ≤ 0.05.
Fig. 5
Fig. 5. BRD9 depletion inhibits multiciliogenesis in a cell line model.
A Schematic demonstrating the time course of the inducible system used to generate MCCs in human DBTRG-05MG cells. For full details, see methods section. B Immunofluorescence using the indicated markers in cells expressing either G = pSLIK-FLAG-BirA*-GEMC1, M = pSLIK-FLAG-BirA*-MCIDAS or M + dBRD9 = pSLIK-FLAG-BirA*-MCIDAS + dBRD9 (20 μM). Images are taken at three different time points: Day 0, Day 3, and Day 7. Scale bar = 10 μM. C Quantification of Immunofluorescence shown in B. Centriole and cilia counts were generated in FLAG positive cells, using Centrin and acetylated tubulin (Ac-Tub) as markers. N = 3 or 4 independent experiments with a total of 150–200 cells scored. Averages of each experiment are shown (ovals) with mean (vertical bars) and standard deviation. D Quantification of FOXJ1 or DEUP1 positive cells in the FLAG positive population from 3D-SIM images. Example of Day 3 image for DEUP1 shown below. Additional images in Supplementary Figure S6A. Scale bar = 5 μM. E Proximity ligation assays (PLA) counter stained with Ac-Tub and DAPI, corresponding to the indicated conditions in. Scale bar = 10 μM. Quantification of PLA foci from n = 3 independent experiments are shown in adjacent right panel. 100 cells were scored per condition.
Fig. 6
Fig. 6. BRD9 inhibitors impair multiciliation in MTECs.
A Representative images of MTEC ALI cultures stained for Centrin and Deup1 to analyze centriole amplification, Foxj1 and p73 transcription factor targets of GEMC1/MCIDAS, or Acetylated tubulin (Ac-tubulin) to monitor ciliogenesis. Some images stained with ZO-1 to define cell boundaries or DAPI to define the nuclear DNA. ALI culture day and treatment with 20 μM I-BRD9 indicated. B Quantitative real-time PCR analysis of Gemc1, Mcidas, Trp73, and Foxj1 in ALI cultures. Results from three independent experiments are shown with bar indicating mean and standard deviation. Paired t-tests were used for statistical analysis: Control vs. I-BRD9: Foxj1 p = ≤0.013* (10 μM) and 0.0003*** (20 μM), Trp73 p = 0.009* (10 μM), = ≤0.009** (20 μM), Gemc1 p = 0.008** (20 μM), and Mcidas p = 0.02* (20 μM). C Fraction of cells committed to the MCC fate (p73+ or FoxJ1 + ) at ALI 12. Results are from 3 independent experiments. N (total cells) = control (2128), 5 μM (1665), 10 μM (1273), and 20 μM (1360). D Fraction of cells undergoing centriole amplification (centrin-positive cells) or E deuterosome formation (Deup1-positive cells) at ALI 4. Results are from three independent experiments. N (total cells) = control (1269), 5 μM (1062), 10 μM (1199), 20 μM (1170). F Fraction of ciliated cells at ALI 12. Results are from three independent experiments. N (total cells) = control (1814), 5 μM (1295), 10 μM (1113), 20 μM (1099). Statistical analyses for CF were done using one-way ANOVA. *p < 0.05.

References

    1. Fragkos M, Ganier O, Coulombe P, Méchali M. DNA replication origin activation in space and time. Nat Rev Mol Cell Biol. 2015;16:360–74. doi: 10.1038/nrm4002. - DOI - PubMed
    1. Pefani D-E, Dimaki M, Spella M, Karantzelis N, Mitsiki E, Kyrousi C, et al. Idas, a novel phylogenetically conserved geminin-related protein, binds to geminin and is required for cell cycle progression. J Biol Chem. 2011;286:23234–46. doi: 10.1074/jbc.M110.207688. - DOI - PMC - PubMed
    1. Caillat C, Pefani D-E, Gillespie PJ, Taraviras S, Blow JJ, Lygerou Z, et al. The Geminin and Idas coiled coils preferentially form a heterodimer that inhibits Geminin function in DNA replication licensing. J Biol Chem. 2013;288:31624–34. doi: 10.1074/jbc.M113.491928. - DOI - PMC - PubMed
    1. Piergiovanni G, Costanzo V. GEMC1 is a novel TopBP1-interacting protein involved in chromosomal DNA replication. Cell Cycle. 2010;9:3662–6. doi: 10.4161/cc.9.18.13060. - DOI - PMC - PubMed
    1. Terré B, Piergiovanni G, Segura-Bayona S, Gil-Gómez G, Youssef SA, Attolini CS-O, et al. GEMC1 is a critical regulator of multiciliated cell differentiation. EMBO J. 2016;35:942–60. doi: 10.15252/embj.201592821. - DOI - PMC - PubMed

Publication types

Substances