. 2023 Mar 17;14(1):1485.
doi: 10.1038/s41467-023-37151-2.

Data integration across conditions improves turnover number estimates and metabolic predictions

Affiliations

Data integration across conditions improves turnover number estimates and metabolic predictions

Philipp Wendering et al. Nat Commun. .

Abstract

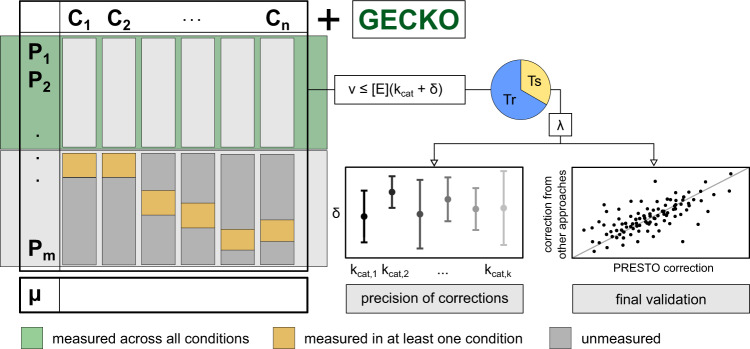
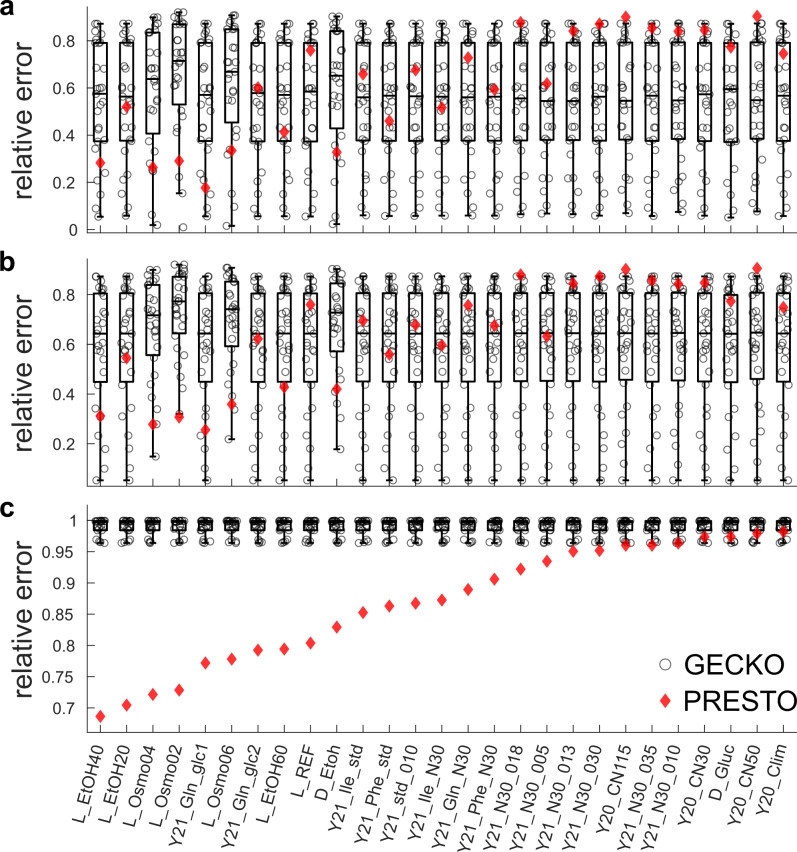
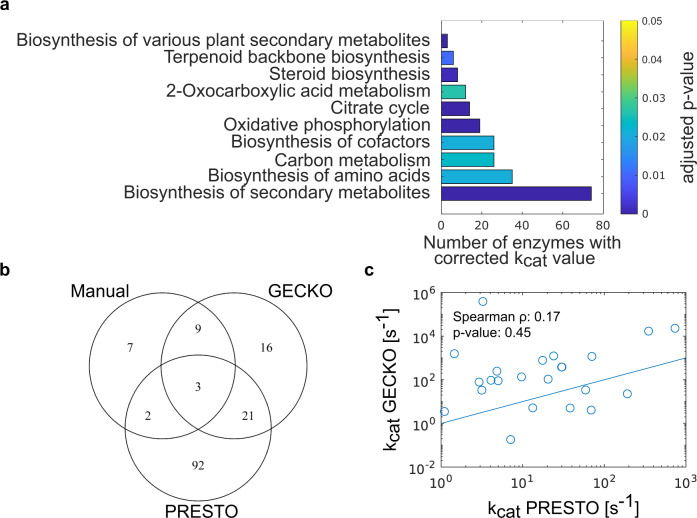
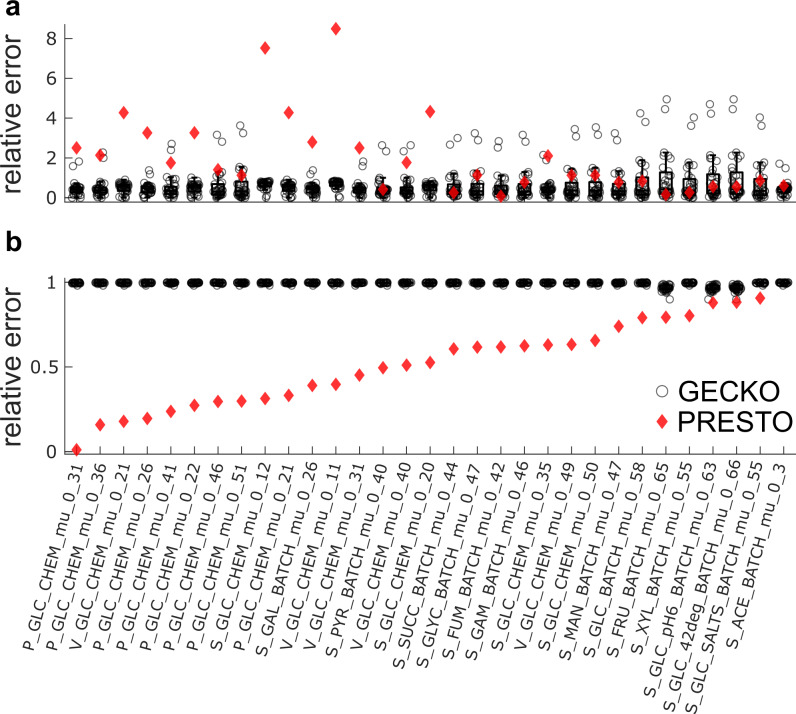
Turnover numbers characterize a key property of enzymes, and their usage in constraint-based metabolic modeling is expected to increase the prediction accuracy of diverse cellular phenotypes. In vivo turnover numbers can be obtained by integrating reaction rate and enzyme abundance measurements from individual experiments. Yet, their contribution to improving predictions of condition-specific cellular phenotypes remains elusive. Here, we show that available in vitro and in vivo turnover numbers lead to poor prediction of condition-specific growth rates with protein-constrained models of Escherichia coli and Saccharomyces cerevisiae, particularly when protein abundances are considered. We demonstrate that correction of turnover numbers by simultaneous consideration of proteomics and physiological data leads to improved predictions of condition-specific growth rates. Moreover, the obtained estimates are more precise than corresponding in vitro turnover numbers. Therefore, our approach provides the means to correct turnover numbers and paves the way towards cataloguing kcatomes of other organisms.


Conflict of interest statement

The authors declare no competing interests.

Figures

Fig. 1
Fig. 1. Schematic overview of the PRESTO approach for kcat correction.
The approach uses a GECKO-formatted pcGEM containing turnover numbers from BRENDA. Using available data from n experimental conditions, n condition-specific models are generated using nutrient uptake rates and protein contents. PRESTO then uses data on abundances for the enzymes measured across the n investigated conditions and solves a linear program that minimizes a weighted sum of two objectives, the relative error to measured specific growth rates and the sum of positive kcat corrections, δ. The optimal weighting factor, λ, which modulates the trade-off between the two objectives, is then determined by cross-validation (Tr: training set; Ts: test set), choosing the parameter, which is associated with the lowest average relative error. Using the optimal value for λ, PRESTO combines all models for the experimental conditions to find a kcat correction for each enzyme with measured abundance. Last, the precision of δ values is assessed by variability analysis as well as by sampling and corrected kcat values are validated by comparing them to values obtained from other approaches.
Fig. 2
Fig. 2. Comparison of predicted growth of S. cerevisiae from pcGEMs with kcat corrections from GECKO and PRESTO.
Condition-specific pcGEMs with corrected kcat values generated by the GECKO heuristic were used to predict the specific growth rate for each condition (n = 27, a, b). The boxplots indicate the distribution of the relative error resulting from each set of condition-specific corrected kcat values obtained from the GECKO heuristic. Relative prediction error from each set is indicated by a circle. The red diamonds show the relative error of the predicted specific growth rate from the PRESTO model (λ=107) by using the single set of corrected kcat values in the respective pcGEM. a Only the measured total protein pool was used to constrain the solution and condition-specific uptake rates were bounded by 1000 mmolhgDW; b measured uptake rates were also considered; c abundances of enzymes measured in all conditions were used as additional constraints. The compared pcGEMs in each condition (n = 19) used the same respective biomass reaction, GAM, σ, and Ptot values (see the “Methods” section). L: Lahtvee et al., D: Di Bartolomeo et al., Y20: Yu et al., Y21: Yu et al.. Middle line and boxes in the box charts in panels a–c indicate the median and 25th and 75th percentiles, respectively. Outlier values (circles outside the whisker range) are more than 1.5× the interquartile range away from the top or bottom of the box, and whiskers connect the lower or upper quartiles with the non-outlier minimum or maximum. Source data are provided as a Source Data file.
Fig. 3
Fig. 3. Comparison of enzymes with corrected kcat values by both GECKO and PRESTO.
a KEGG Pathway terms significantly enriched in the set of enzymes corrected by PRESTO (λ=107) in the S. cerevisiae pcGEM. The x-axis gives the number of corrected enzymes linked to the given term. The one-sided p-values were calculated using the hypergeometric density distribution and corrected for multiple hypothesis testing using the Benjamini–Hochberg procedure. b Venn diagram showing the overlap of enzymes whose kcat values were manually corrected (“Manual”), automatically corrected by the GECKO heuristic in any of the conditions (“GECKO”), or corrected by PRESTO (“PRESTO”). c Log-transformed kcat values corrected using both the GECKO heuristic and PRESTO are not associated (Spearman correlation coefficient of 0.166, p-value = 0.45). Source data are provided as a Source Data file.
Fig. 4
Fig. 4. Comparison of predicted growth of E. coli from pcGEMs with kcat corrections from GECKO and PRESTO.
Condition-specific pcGEMs with corrected kcat values generated by the GECKO heuristic were used to predict the specific growth rate for each condition (a: n = 31, b: n = 27). The boxplots indicate the distribution of the relative error resulting from each set of condition-specific corrected kcat values obtained from the GECKO heuristic. Relative prediction error from each set is indicated by a circle. The red diamonds show the relative errors of predicted specific growth rates from the PRESTO model (λ=105) by using the single set of corrected kcat values in the respective pcGEM. a Only the measured total protein pool was used to constrain the solution and condition-specific uptake rates were bounded by 1000 mmolhgDW; b abundances of enzymes measured in all conditions were used as additional constraints. Missing data points originate from the infeasibility of the respective models. The compared pcGEMs in each condition used the same respective biomass coefficients, GAM σ, and Ptot values (see the “Methods” section). P: Peebo et al., V: Valgepea et al., S: Schmidt et al.. Middle line and boxes in the box charts in panels a and b indicate the median and 25th and 75th percentiles, respectively. Outlier values (circles outside the whisker range) are more than 1.5× the interquartile range away from the top or bottom of the box, and whiskers connect the lower or upper quartiles with the non-outlier minimum or maximum. Source data are provided as a Source Data file.

References

    1. Goelzer A, et al. Quantitative prediction of genome-wide resource allocation in bacteria. Metab. Eng. 2015;32:232–243. doi: 10.1016/j.ymben.2015.10.003. - DOI - PubMed
    1. Lerman JA, et al. In silico method for modelling metabolism and gene product expression at genome scale. Nat. Commun. 2012;3:929. doi: 10.1038/ncomms1928. - DOI - PMC - PubMed
    1. O’Brien EJ, Lerman JA, Chang RL, Hyduke DR, Palsson BØ. Genome‐scale models of metabolism and gene expression extend and refine growth phenotype prediction. Mol. Syst. Biol. 2013;9:693. doi: 10.1038/msb.2013.52. - DOI - PMC - PubMed
    1. Chen Y, Nielsen J. Mathematical modeling of proteome constraints within metabolism. Curr. Opin. Syst. Biol. 2021;25:50–56. doi: 10.1016/j.coisb.2021.03.003. - DOI
    1. Adadi R, Volkmer B, Milo R, Heinemann M, Shlomi T. Prediction of microbial growth rate versus biomass yield by a metabolic network with kinetic parameters. PLoS Comput. Biol. 2012;8:e1002575. doi: 10.1371/journal.pcbi.1002575. - DOI - PMC - PubMed

Publication types

MeSH terms

LinkOut - more resources