. 2023 Mar 17;14(1):1508.
doi: 10.1038/s41467-023-36943-w.

The cerebellum regulates fear extinction through thalamo-prefrontal cortex interactions in male mice

Affiliations

The cerebellum regulates fear extinction through thalamo-prefrontal cortex interactions in male mice

Jimena L Frontera et al. Nat Commun. .

Abstract

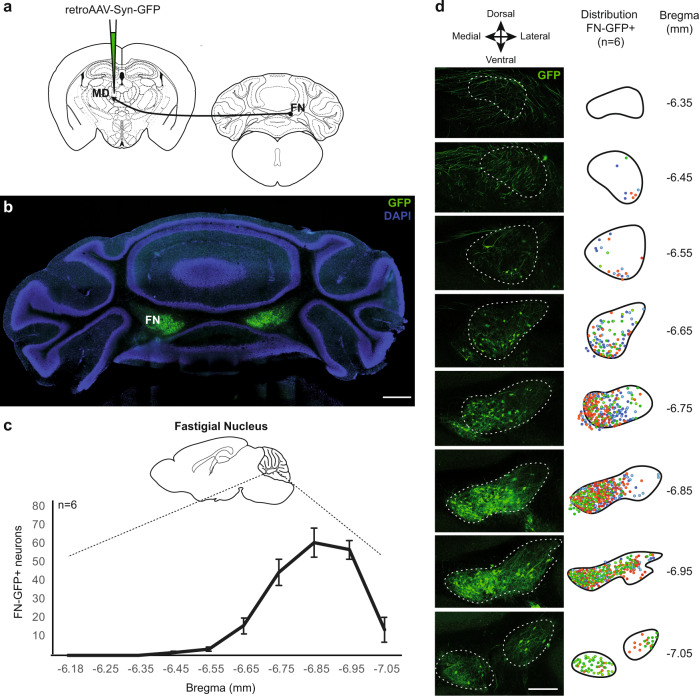
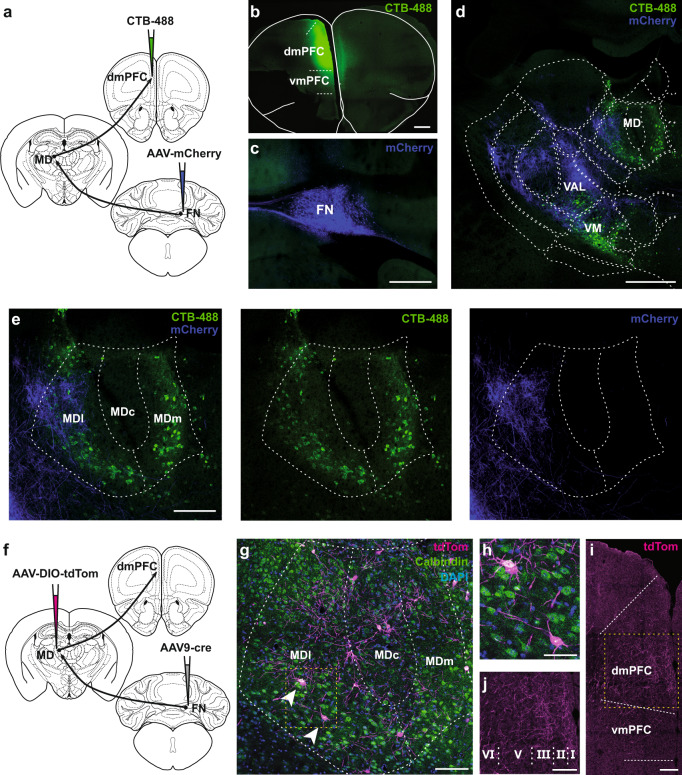
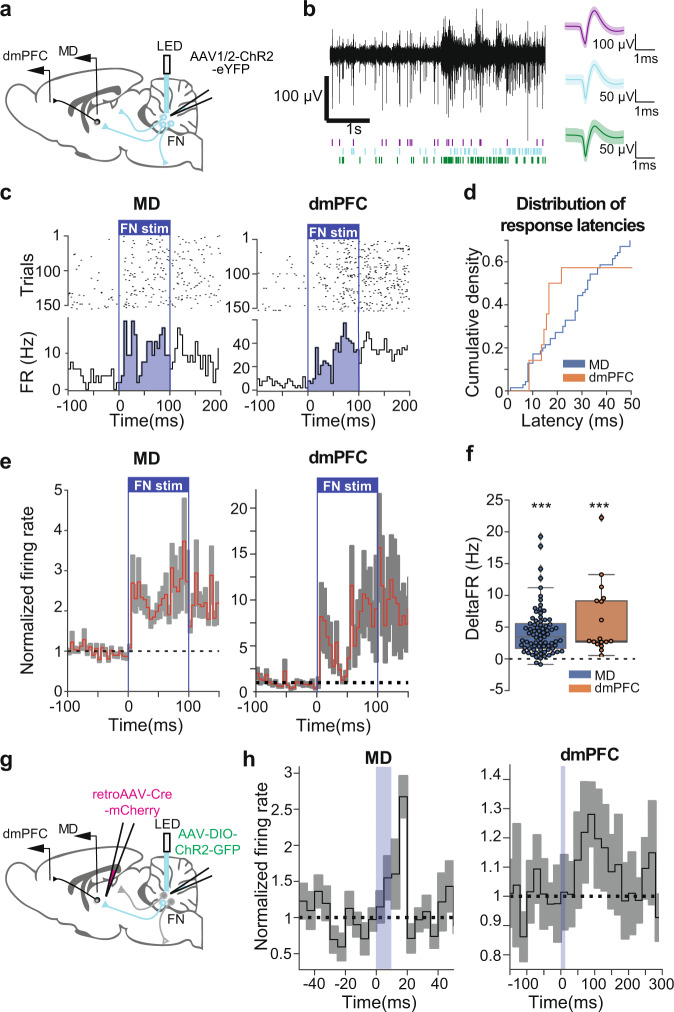
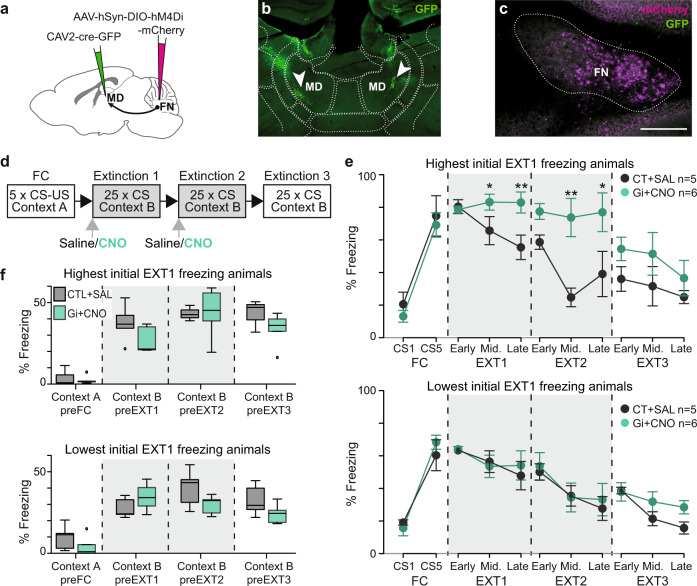
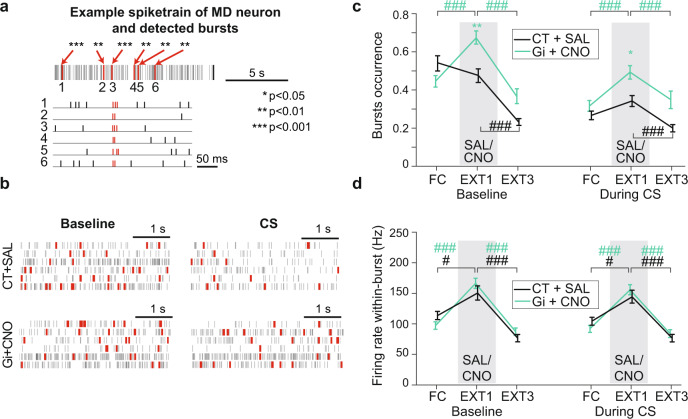
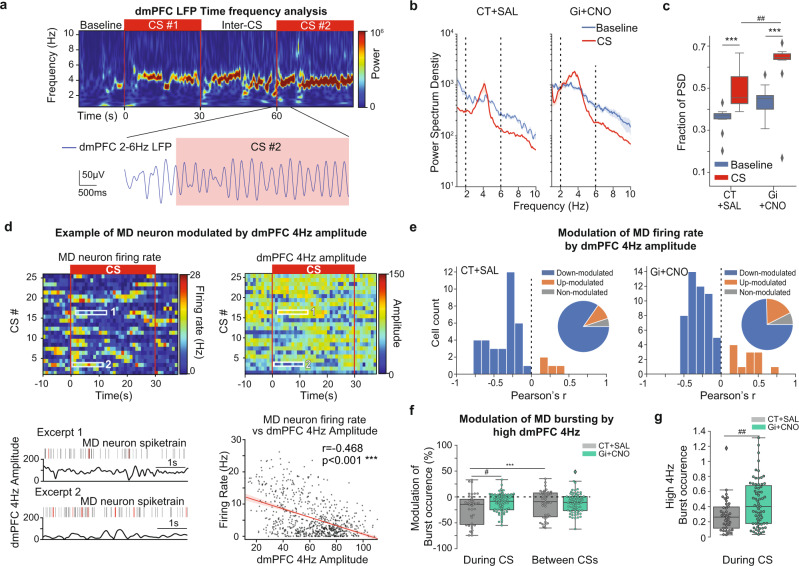
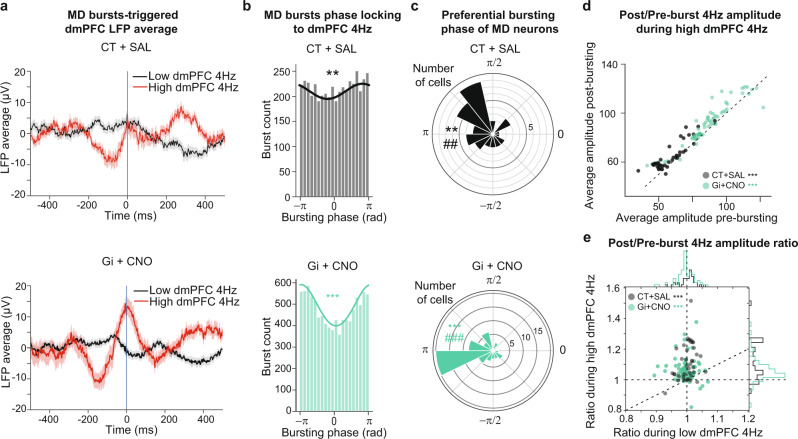
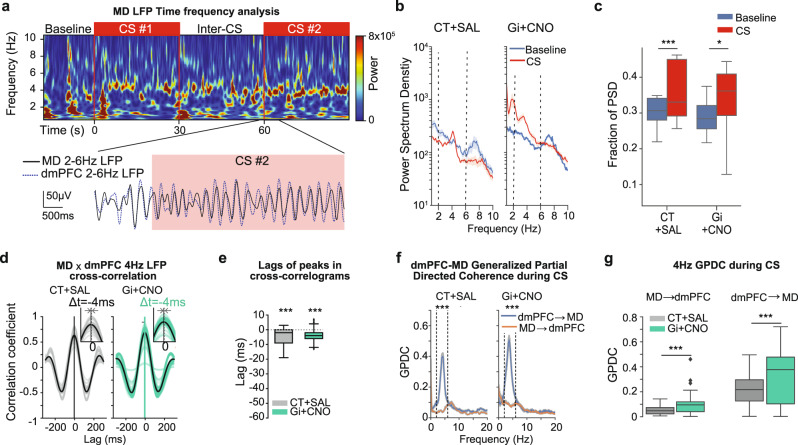
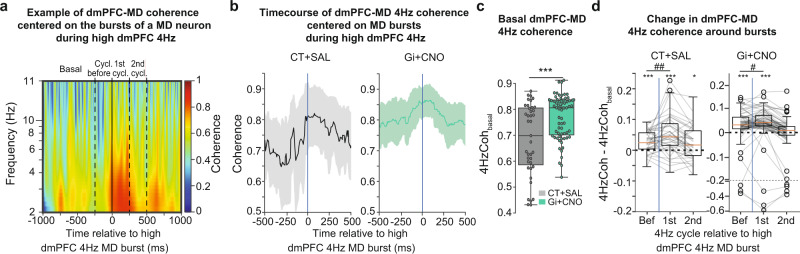
Fear extinction is a form of inhibitory learning that suppresses the expression of aversive memories and plays a key role in the recovery of anxiety and trauma-related disorders. Here, using male mice, we identify a cerebello-thalamo-cortical pathway regulating fear extinction. The cerebellar fastigial nucleus (FN) projects to the lateral subregion of the mediodorsal thalamic nucleus (MD), which is reciprocally connected with the dorsomedial prefrontal cortex (dmPFC). The inhibition of FN inputs to MD in male mice impairs fear extinction in animals with high fear responses and increases the bursting of MD neurons, a firing pattern known to prevent extinction learning. Indeed, this MD bursting is followed by high levels of the dmPFC 4 Hz oscillations causally associated with fear responses during fear extinction, and the inhibition of FN-MD neurons increases the coherence of MD bursts and oscillations with dmPFC 4 Hz oscillations. Overall, these findings reveal a regulation of fear-related thalamo-cortical dynamics by the cerebellum and its contribution to fear extinction.


Conflict of interest statement

The authors declare no competing interests.

Figures

Fig. 1
Fig. 1. Cerebellar fastigial nucleus (FN) sends projections to the mediodorsal thalamic nucleus (MD).
a Retrograde tracing strategy by injection of retrograde AAV-GFP in the MD. b Coronal cerebellar sections of FN with MD-projecting neurons expressing retrograde AAV-GFP (green), and cell nuclei labeled with DAPI (scale bar, 500 µm). c Quantification (mean +/− SEM) and antero-posterior distribution of retrograde GFP-labeled FN MD-projecting neurons (FN-GFP+) in coronal sections (data from 6 mice). AP position is reported relative to Bregma. d Distribution pattern of FN MD-projecting neurons (FN-GFP+) in coronal cerebellar sections across replicates (n = 6 mice, colors correspond to labeling from different animals). (scale bar, 250 µm). See also Supplementary Fig. 1. Brain schematic in panel a modified from the Allen Mouse Brain Atlas and Allen Reference Atlas – Mouse Brain, http://atlas.brain-map.org/atlas?atlas=1#atlas=1&plate=100960384, http://atlas.brain-map.org/atlas?atlas=1#atlas=1&plate=100960136, http://atlas.brain-map.org/atlas?atlas=1#atlas=1&plate=100960240.
Fig. 2
Fig. 2. MD as a high-order thalamic relay between the FN and the dmPFC.
a Strategy for neuroanatomical tracing by injections of anterograde AAV-mCherry in the FN and retrograde CTB-488 in the dmPFC (n = 3 replicates). b Example of CTB-488 injection site in the dmPFC (scale bar, 500 µm). c AAV-mCherry expression in the cerebellar FN (scale bar, 500 µm). d Thalamic section exhibiting contralateral FN projections (mCherry, blue) and thalamic dmPFC-projecting neurons (CTB-488, green) (scale bar, 500 µm). e Zoom-in from thalamus section in d (dotted line area), showing the FN projections to MD, preferentially into the lateral segment of the MD (MDl). MDc: central segment of MD, MDm: medial segment of MD. (scale bar, 100 µm). f Schematic representation of viral strategy to localize FN-post-synaptic neurons in MD. Anterograde trans-synaptic expression of cre by AAV9 and cre-dependent expression of td-Tomato in MD. (n = 3 replicates) g MD exhibiting FN-post-synaptic labeled neurons (arrow heads) with tdTom and co-localization of calbindin expression detected by immunostaining (green). Cell nuclei labeled with DAPI (blue). h Zoom-in from g (yellow dotted line area) exhibiting FN post-synaptic MD neurons. i dmPFC sections exhibiting FN-post-synaptic MD neuronal projections in different cortical layers (scale bar, 100 µm). j Zoom-in from dmPFC section in i (yellow dotted line area), cortical layers I-VI (scale bar, 100 µm). Brain schematics modified from the Allen Mouse Brain Atlas and Allen Reference Atlas – Mouse Brain, from http://atlas.brain-map.org/atlas?atlas=1#atlas=1&plate=100960136, http://atlas.brain-map.org/atlas?atlas=1#atlas=1&plate=100960240 in panels a, f, and from http://atlas.brain-map.org/atlas?atlas=1#atlas=1&plate=100960260 in panels d, e, g.
Fig. 3
Fig. 3. Optogenetic stimulation of FN input to MD induced responses in MD and dmPFC.
a Strategy used for the specific optogenetic stimulation of FN neurons, representing the local injection of anterograde AAV-ChR2-eYFP in the FN and the implantation of recording electrodes in MD and dmPFC. b Example of high-passed filtered trace of a recording channel in MD (left) and spike shapes of single units from MD (average ± SD), after spike sorting (right). c Example PSTH (5 ms bins, bottom) and rasterplot (top) of a MD cell (left) and dmPFC cell (right) during 100 ms optogenetic stimulation of the FN. The light stimulation is represented by a blue rectangle. d Cumulative histograms showing the latency of neuronal response of responsive cells in MD and dmPFC triggered by 100 ms optogenetic stimulation of the FN. e PSTH (5 ms bins) displaying the change in firing rate (average ± SEM) of responsive cells during 100 ms optogenetic stimulation of the FN in MD (left), and in dmPFC (right). The light stimulation is represented by a blue rectangle. f Average change in firing rate of responsive cells during 100 ms optogenetic stimulation of the FN. Wilcoxon test, (77 MD neurons from 10 mice, 17 dmPFC neurons from 7 mice) ***p < 0.001. Boxplots represent quartiles and whiskers correspond to range; points are singled as outliers if they deviate more than 1.5 x interquartile range from the nearest quartile. g Strategy used for the specific optogenetic stimulation of the FN inputs in MD, by injection of retrograde AAV-cre-mCherry in the MD and anterograde cre-dependent AAV-DIO-ChR2-GFP in the FN, and the implantation of recording electrodes in MD and dmPFC. h PSTH displaying the change in firing rate (average ± SEM) of responsive cells following 10 ms optogenetic stimulation of the FN in MD (left, 5 ms bin), and in dmPFC (right, dmPFC, 20 ms bin). Data available at doi:10.5061/dryad.9kd51c5ng. Detailed statistical results are available in the Supplementary Tables referenced by panel numbers.
Fig. 4
Fig. 4. FN input to MD modulates fear extinction.
a Chemogenetic strategy to inhibit specifically the activity of FN-MD input, bilateral retrograde expression of cre recombinase in MD by CAV2-cre-GFP infusion and anterograde cre-dependent expression of inhibitory DREADD (hM4Di (Gi)) in the cerebellar FN. b Injection site of CAV2-cre-GFP in the MD. c Cre-dependent expression of inhibitory DREADD reported by mCherry fluorescence in the FN (scale bar, 250 µm). d Classical fear conditioning and extinction protocol used. FN-MD projections were inhibited by CNO administration during extinction 1 and 2. e FN-MD input inhibition (Gi+CNO, n = 12) during extinction sessions 1 and 2 reduced extinction of fear response compared to the control group (CT + SAL, n = 10). The mice were separated in two groups of same size expressing respectively the highest and lowest freezing levels on the Early stage of EXT 1. Lines represent mean ± SEM. Post-hoc two-sided t-test Holm-Sidak corrected, *p < 0.05. f FN-MD chemogenetic inhibition of FN-MD input did not affect basal levels of freezing during habituation to the context of fear conditioning (Context A) or extinction (Context B), compared to the control mice; same groups and statistics as in panel e. Boxplots represent quartiles and whiskers correspond to range; points are singled as outliers if they deviate more than 1.5 x interquartile range from the nearest quartile, p > 0.05. Data available at doi:10.5061/dryad.9kd51c5ng. Detailed statistical results are available in the Supplementary Tables referenced by panel numbers.
Fig. 5
Fig. 5. Chemogenetic inhibition of FN-MD input during EXT1 increases burst occurrence in the MD.
a Example of burst detection in a spiketrain from a MD neuron, bursts are represented in red, and their associated p-values are reported. One sample t-test on ISI of burts compared to the local distribution of ISI. *p < 0.05, **p < 0.01, ***p < 0.001. b Example spiketrains of MD neurons during Baseline (left), and during CS (right), from a CT + SAL mouse (top), Gi + CNO mouse (bottom). Each line corresponds to a given neuron, bursts are represented in red. c Burst occurrence (number of bursts per second) during baseline (left), and during CS (right). d The average firing rate within a burst during baseline (left) and during CS (right). Comparisons between Gi + CNO (FC, EXT1, EXT3 n = 49, 67, 51 from 5 mice) and CT + SAL (n = 36, 39, 22 from 4 mice) for each phase are shown by colored stars on top of the corresponding phase Holm-Sidak corrected Mann–Whitney U test, *p < 0.05, **p < 0.01, ***p < 0.001. Comparisons between phases for each experimental group are shown by colored stars on top of line between two phases. Holm-Sidak corrected Mann–Whitney U test, #p < 0.05, ##p < 0.01, ###p < 0.001. Data available at doi:10.5061/dryad.9kd51c5ng. Data are ploted as mean +/− SEM. All tests are two-sided. Detailed statistical results are available in the Supplementary Tables referenced by panel numbers.
Fig. 6
Fig. 6. Neuronal activity in the MD is modulated by dmPFC 4 Hz LFP oscillations during EXT1.
a Representative spectrogram of dmPFC LFP during EXT1 (top), displaying a 4 Hz component induced by the CS. 2–6 Hz filtered LFP traces from dmPFC (blue), showing the apparition of 4 Hz oscillations after the onset of the CS (red rectangle). b A 4 Hz component (2–6 Hz) is visible in the Power Spectrum Density (PSD) dmPFC LFP during EXT1 for CT + SAL (left) and Gi+CNO (right), average ± SEM, dashed lines represent the 4 Hz range (2–6 Hz). c The fraction of the PSD representing 2–6 Hz oscillations is increased during Extinction compared to Baseline. Wilcoxon test, ***p < 0.001. The fraction of the PSD during CS is increased in Gi + CNO compared to CT + SAL, Mann–Whitney U test, ##p < 0.01 (CT + SAL = 14 recording sites from 4 mice, Gi + CNO = 15 recording sites from 5 mice). d Average firing rate of a MD neuron during EXT1, centered on the onsets of CSs (top left), binned average amplitude 4 Hz oscillations in the dmPFC (top right). Example raster and corresponding trace of amplitude 4 Hz oscillations in the dmPFC, bursts are displayed in red (bottom left). Scatterplot displaying the averaged firing rate (1 s bins) as a function of the corresponding average amplitude 4 Hz oscillations, Linear regression line and confidence interval are shown in red (bottom right). Pearson’s correlation coefficient, ***p < 0.001. e Distributions of Pearson’s correlation coefficient of MD neurons firing rate and dmPFC 4 Hz amplitude for CT + SAL (top) and Gi + CNO (bottom). f Modulation of burst occurrence of MD neurons firing during episodes of high dmPFC 4 Hz. Mann–Whitney U test, #p < 0.05. Wilcoxon test, ***p < 0.001. g Distributions of burst occurrence of MD neurons firing during episodes of high dmPFC 4 Hz during CS. Mann–Whitney U test, ###p < 0.001. (CT + SAL = 39 neurons recorded from 4 mice, Gi + CNO = 67 neurons recorded from 5 mice). Boxplots represent quartiles and whiskers correspond to range; points are singled as outliers if they deviate more than 1.5 x interquartile range from the nearest quartile. Data available at doi:10.5061/dryad.9kd51c5ng. All tests are two-sided. Detailed statistical results are available in the Supplementary Tables referenced by panel numbers.
Fig. 7
Fig. 7. Phase-locking of MD bursting to dmPFC 4 Hz LFP oscillations during EXT1 is increased by chemogenetic inhibition of FN-MD.
a Average of dmPFC LFP (average ± SEM), around MD bursts occurring during episodes of either high dmPFC 4 Hz (red) or low dmPFC 4 Hz) red, for CT + SAL (top) and Gi+CNO (bottom). b Phase histograms of MD bursting during episodes of high 4 Hz, for CT + SAL mice (top) and Gi + CNO mice (bottom). The solid line represents a Von Mises fit associated to the circular distribution. Rayleigh test **p < 0.01, ***p < 0.001. c Distributions of preferential bursting phases of MD neurons during episodes of high 4 Hz, for CT + SAL mice (top) and Gi+CNO mice (bottom). Rayleigh test **p < 0.01, ***p < 0.001. Circular V test, testing for a unimodal circular distribution centered on pi (which corresponds to positive peaks in dmPFC 4 Hz oscillations) ##p < 0.01, ###p < 0.001. d The average amplitude of dmPFC 4Hz oscillations during the 500 ms following MD bursting is increased compared to the 500 ms preceding the burst during high dmPFC 4 Hz episodes. e The ratios of the average 4 Hz amplitude during the 500 ms after and before MD bursting are higher during episodes of high dmPFC 4 Hz compared to episodes of low dmPFC 4 Hz, vertical and horizontal dotted lines are centered on 1, the diagonal dotted line corresponds to equal ratios in both conditions. Distributions of ratios in both conditions are displayed in the marginal histograms. Wilcoxon test, ***p < 0.001. (CT + SAL = 39 neurons recorded from 4 mice, Gi + CNO = 67 neurons recorded from 5 mice). Data available at doi:10.5061/dryad.9kd51c5ng. All tests are two-sided. Detailed statistical results are available in the Supplementary Tables referenced by panel numbers.
Fig. 8
Fig. 8. dmPFC-MD 4 Hz coherence is increased by chemogenetic inhibition of FN-MD.
a Representative spectrogram of MD LFP during EXT1 (top), displaying a 4 Hz component induced by the CS. 2–6 Hz filtered LFP traces from dmPFC (blue), showing the apparition of 4 Hz oscillations after the onset of the CS (red rectangle). b A 4 Hz component (2–6 Hz) is visible in the Power Spectrum Density (PSD) MD LFP during EXT1 for CT + SAL (left) and Gi + CNO (right), average ± SEM, dashed lines represent the 4 Hz range (2–6 Hz). c The fraction of the PSD representing 2–6 Hz oscillations is increased during Extinction compared to Baseline. Wilcoxon test, ***p < 0.001 (CT + SAL = 28 recording sites from 4 mice, Gi + CNO = 30 recording sites from 5 mice). d Cross-correlation of 2–6 Hz filtered LFP in MD and in dmPFC display maxima at negative lags. Colored lines represent pairwise cross-correlations. Black lines represent averages. e Lags of maximum peaks in cross-correlations, Wilcoxon test ***p < 0.001. f Generalized Partial Directed Coherence (GPDC) between dmPFC and MD LFP during CS, Average ± SEM, Wilcoxon test on the 4 Hz GPDC dmPFC->MD versus MD->dmPFC, *p < 0.05, **p < 0.01, ***p < 0.001. g, 4 Hz GPDC dmPFC -> MD. Mann–Whitney U test, *p < 0.05, **p < 0.01, ***p < 0.001 (CT + SAL = 28 recording sites in MD and 14 recording sites in MD from 4 mice, Gi+ CNO = 30 recording sites in MD and 15 recording sites in the dmPFC from 5 mice). Boxplots represent quartiles and whiskers correspond to range; points are singled as outliers if they deviate more than 1.5 x interquartile range from the nearest quartile. Data available at doi:10.5061/dryad.9kd51c5ng. All tests are two-sided. Detailed statistical results are available in the Supplementary Tables referenced by panel numbers.
Fig. 9
Fig. 9. MD bursting is followed by high 4 Hz MD-mPFC coherence.
a Example of time frequency coherence analysis between dmPFC and MD LFP, centered on the bursting of a MD neuron during episodes of high 4 Hz showing an increase of coherence in the 4 Hz range after the burst. b, Average 4 Hz coherence between dmPFC and MD LFP, centered on MD bursting during episode of high 4 Hz for CT + SAL mice (left) and Gi + CNO mice (right), showing an increase of coherence in the 4 Hz range after the burst. c, Distributions of basal coherence between dmPFC and MD LFP before MD bursting (−1000 ms to −250 ms) during episodes of high 4 Hz. Mann–Whitney U test, ***p < 0.001. d Distributions of increase in coherence between dmPFC and MD LFP during episodes of high 4 Hz, before MD bursting (−250 ms to 0 ms) and during the first and second 4 Hz cycle after bursting. One sample Wilcoxon test, *p < 0.05, ***p < 0.001. Two samples Wilcoxon test, #p < 0.05, ##p < 0.01 (CT + SAL = 39 neurons recorded from 4 mice, Gi + CNO = 67 neurons recorded from 5 mice). Boxplots represent quartiles and whiskers correspond to range; points are singled as outliers if they deviate more than 1.5 x interquartile range from the nearest quartile. Data available at doi:10.5061/dryad.9kd51c5ng. All tests are two-sided. Detailed statistical results are available in the Supplementary Tables referenced by panel numbers.

Similar articles

Cited by

References

    1. Milad MR, Quirk GJ. Fear extinction as a model for translational neuroscience: ten years of progress. Physiol. Behav. 2012;63:129–151. - PMC - PubMed
    1. Maren S, Holmes A. Stress and fear extinction. Neuropsychopharmacology. 2016;41:58–79. doi: 10.1038/npp.2015.180. - DOI - PMC - PubMed
    1. Frontera JL, et al. Bidirectional control of fear memories by cerebellar neurons projecting to the ventrolateral periaqueductal grey. Nat. Commun. 2020;11:5207. doi: 10.1038/s41467-020-18953-0. - DOI - PMC - PubMed
    1. Vaaga CE, Brown ST, Raman IM. Cerebellar modulation of synaptic input to freezing-related neurons in the periaqueductal grey. Elife. 2020;9:e54302. doi: 10.7554/eLife.54302. - DOI - PMC - PubMed
    1. Fujita H, Kodama T, du Lac S. Modular output circuits of the fastigial nucleus for diverse motor and nonmotor functions of the cerebellar vermis. Elife. 2020;9:e58613. doi: 10.7554/eLife.58613. - DOI - PMC - PubMed

Publication types