. 2023 Mar 17;14(1):1502.
doi: 10.1038/s41467-023-36941-y.

Constitutively active Lyn kinase causes a cutaneous small vessel vasculitis and liver fibrosis syndrome

Affiliations

Constitutively active Lyn kinase causes a cutaneous small vessel vasculitis and liver fibrosis syndrome

Adriana A de Jesus et al. Nat Commun. .

Abstract

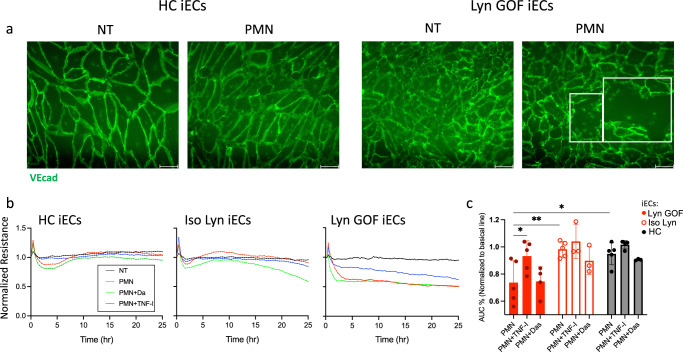
Neutrophilic inflammation is a hallmark of many monogenic autoinflammatory diseases; pathomechanisms that regulate extravasation of damaging immune cells into surrounding tissues are poorly understood. Here we identified three unrelated boys with perinatal-onset of neutrophilic cutaneous small vessel vasculitis and systemic inflammation. Two patients developed liver fibrosis in their first year of life. Next-generation sequencing identified two de novo truncating variants in the Src-family tyrosine kinase, LYN, p.Y508*, p.Q507* and a de novo missense variant, p.Y508F, that result in constitutive activation of Lyn kinase. Functional studies revealed increased expression of ICAM-1 on induced patient-derived endothelial cells (iECs) and of β2-integrins on patient neutrophils that increase neutrophil adhesion and vascular transendothelial migration (TEM). Treatment with TNF inhibition improved systemic inflammation; and liver fibrosis resolved on treatment with the Src kinase inhibitor dasatinib. Our findings reveal a critical role for Lyn kinase in modulating inflammatory signals, regulating microvascular permeability and neutrophil recruitment, and in promoting hepatic fibrosis.


Conflict of interest statement

The authors declare no competing interests.

Figures

Fig. 1
Fig. 1. Discovery of de novo GOF mutations in LYN as cause of cutaneous vasculitis and liver fibrosis syndrome.
a The pedigrees show a de novo variant in LYN in each of the three patients. Squares and circles represent male and female family members, respectively; solid symbols and open symbols indicate affected and unaffected family members, respectively. b In Patient 1 and Patient 3 the truncating mutations p.Y508* and p.Q507* result in the loss of the 5 or 6 terminal amino acids, respectively; and in Patient 2, the amino acid substitution from a tyrosine to a phenylalanine prevents phosphorylation in the C-terminal regulatory domain of Lyn kinase.
Fig. 2
Fig. 2. Clinical and histopathologic features of patients with LYN gain-of-function mutations.
a Periorbital edema and erythema in Pt.2 (left panel), non-blanching vascular rashes in Pt.1’s lower extremities (center panel), and left thigh MRI from Pt.1 (right panel) depicting fasciitis (green circle) and periostitis (red circle) are shown. b Hematoxylin & eosin (H&E) staining from lesional skin biopsies of Pt.1 (first column images) and Pt.2 (second column images) show destruction of a small vessel with surrounding inflammatory cells in Pt.1 (black arrow) and a perivascular infiltrate in Pt.2 (asterisk) (upper panels, scale bars, 100 μm). The endothelial cells and surrounding neutrophils are Lyn kinase (Lyn) positive in both patients (middle panels, scale bars, 100 μm). The lower panels show the localized accumulation of neutrophil extracellular traps (NETs) (pink) surrounding the small vessels in Pt.1 and Pt.2, respectively. cit-H4, citrulline histone H4, scale bars, 20 μm. c A Liver biopsy performed in Pt.1 at the age of 22 months illustrates a portal area lacking a bile duct on H&E (left upper panel) and early peri-sinusoidal fibrosis on Masson’s trichrome staining (right upper panel). Lyn staining of sinusoidal cells and endothelial cells in the portal areas is shown in Pt.1’s liver biopsy that was performed at the age of 4 years (lower panel). Scale bars, 20 μm. d Colon biopsy from Pt.2 shows apoptosis of multiple crypt epithelial cells (black arrows). Scale bar, 20 μm.
Fig. 3
Fig. 3. Constitutive Lyn kinase activation and evidence of systemic inflammation and endothelial activation.
a Phosphorylation-dependent active and inactive configuration of Lyn kinase. Disease-causing LYN variants lead to constitutive activation (left panel). Western blot of lysates from transiently transfected HEK293FT (wild-type (WT) or mutant LYN) demonstrate increased phosphorylation of p.Y397 and absent phosphorylation of p.Y508 in the mutant constructs (center panel). Data of 4 biologically independent experiments is graphed in a scatter plot with bar graphs depicting mean values ± SD. p.Y397 comparisons, WT versus: p.Q507*, p = 0.0082, p.Y508F, p = 0.0228; or p.Y508*, p = 0.0137. p.Y508 comparisons, WT versus: p.Q507*, p < 0.0001, p.Y508F, p < 0.0001 or p.Y508*, p < 0.0001. *p < 0.05, **p < 0.01, ****p < 0.0001 as determined by ordinary one-way ANOVA with Bonferroni’s multiple comparison post-test. b Phosphorylation of Lyn adaptor proteins, Scimp (left panel), and Skap2 (right panel) in transiently LYN construct co-transfected HEK293FT cells. Red arrow heads indicate phosphorylated Lyn kinase substrates. Depicted are representative images of n = 3 independent experiments for Scimp and Skap2. c Pre-treatment samples from the 3 patients (Pts.1-3) and from patients with the systemic autoinflammatory diseases, neonatal-onset multisystem inflammatory disease (NOMID), or STING-associated vasculopathy with onset in infancy (SAVI), were compared with healthy controls (HC). For the CRP comparisons: Pt.1 (n = 7, p = 0.0009), Pt.2 (n = 4, p < 0.0001), and Pt.3 (n = 18, p = 0.028), NOMID (n = 11, p < 0.0001) SAVI (n = 7, p = ns), HC (n = 5) (left upper panel). For IL-6: Pt.1 (n = 3, p = 0.0153), Pt.2 (n = 1, p = ns), Pt.3 (n = 1, p = ns), NOMID (n = 12, p < 0.0001) and SAVI (n = 6, p = 0.0019), HC (n = 26) (left lower panel). For neutrophil and endothelial markers, p-values for respective comparisons with HC are: for sL-selectin: Pt.1 (n = 2, p = 0.0186), Pt.3 (n = 1, p = ns), NOMID (n = 12, p < 0.0001) and SAVI (n = 6, p = 0.0003), HC (n = 105); for lipocalin: Pt.1 (n = 2, p = 0.0169), Pt.3 (n = 1, p = ns), NOMID (n = 12, p = ns) and SAVI (n = 7, p = ns), HC (n = 49); for ICAM-1: Pt.1 (n = 2, p = 0.0044), Pt.3 (n = 1, p = 0.0198), NOMID (n = 12, p = 0.0002) and SAVI (n = 7, p = 0.0001), HC (n = 26); for sE-selectin: Pt.1 (n = 2, p = 0.0260), Pt.3 (n = 1, p = ns), NOMID (n = 12, p < 0.0001) and SAVI (n = 6, p = 0.0105), HC (n = 105). Data are presented as median values ± interquartile ranges. *p < 0.05, **p < 0.01, ***p < 0.001, ****p < 0.0001 as determined by Kruskal–Wallis test. Exact significant p-values of patient vs. HC comparisons for each marker are stated above. Source data are provided as a Source data file.
Fig. 4
Fig. 4. Response to treatment in the three patients with gain-of-function mutations in LYN.
a Longitudinally obtained CRP levels are depicted for all patients stratified by treatment. C-reactive protein (CRP), liver function tests (LFTs), gamma-glutamyltransferase (GGT), and alanine aminotransferase (ALT). For Pt.3 comparisons between pre-treatment (pre-tt) and post etanercept treatment (etanercept) samples were depicted in scatter plots with bar graphs showing median and interquartile ranges. For CRP: pre-tt n = 28, etanercept n = 5, p = 0.0056; platelets, pre-tt n = 28, etanercept n = 6, p = 0.0005; GGT, pre-tt n = 15, etanercept n = 6, p = 0.9568; ALT, pre-tt n = 16, etanercept n = 6, p = 0.9591. **p < 0.01, ***p < 0.001 as determined by Mann–Whitney test with two-tailed p-value. ns, non-significant. b Pt.1 neutrophils were assessed at baseline and on dasatinib monotherapy or combination therapy with etanercept for expression of β2 integrins CD11a/LFA-1α, CD11b/Mac-1α, CD11c, and CD18/LFA-1β/Mac-1β. c Liver responses to various treatments for Pt.1 show improvement of bridging fibrosis in liver biopsies on dasatinib monotherapy (upper panels, scale bars, 100 μm), bile ductopenia (lower left panel) and the liver function markers, GGT and ALT (lower center and right panels). Scatter plot with bar graphs show median and interquartile ranges of pre-tt and variable post-treatment samples for GGT and ALT. For GGT and ALT, respectively: pre-tt (n = 8 and n = 15), dasatinib (n = 9 and n = 14), dasatinib stopped (n = 3 and n = 4), dasatinib 20 mg (n = 7 and n = 8, p = 0.0005), dasatinib 40 mg (n = 11, p = 0.0002 and n = 13, p = 0.0004), etanercept (n = 4, p = 0.0074 and n = 4, p = 0.0002), etanercept + dasatinib (eta+dasa) (n = 9, p < 0.0001 and n = 10, p = 0.0002). **p < 0.01, ***p < 0.001 as determined by Kruskal–Wallis test. d Heatmap depicts changes in serum cytokine and chemokine concentrations in longitudinally collected samples from Pt.1 compared to HC (n = 3). (*) sample obtained when dasatinib was temporarily stopped. e Heatmap of transcriptome analysis of 4 liver biopsies (Pt.1). A recovery of epithelial markers (e.g., cholangiocytes) and improvement of fibrosis and inflammation markers, of markers of liver sinusoidal endothelial cells (LSEC) activation, scar/fibrosis associated mesenchymal cells (SAMecs) and macrophages (SAMacs) on dasatinib treatment was observed. ECM extracellular matrix, HSC hepatic stellate cells, GC glucocorticosteroids, IVIG intravenous immunoglobulin. Source data are provided as a Source data file.
Fig. 5
Fig. 5. Co-culture of neutrophils and induced endothelial cells (iECs) increases neutrophil adhesion, and transendothelial migration (TEM).
a mRNA expression of the endothelial cell markers ICAM-1, E-selectin, and VE-cadherin (VEcad) in Pt.1’s iECs (Pt1 iECs), a genetically corrected isogenic iEC clone (Pt1 iso iEC) and a healthy control iEC (HC iEC) was quantified upon stimulation with IL-1β (10 ng/ml). The data were collected from n = 3 independently derived iEC cell lines for HC and Pt.1. One CRISPR/Cas9 edited Pt1 cell line was generated (iso iEC). Depicted are all biological and technical replicates for HC and Pt1 iEC, and technical replicates for Pt1 iso iEC. Data are presented as mean values ± SEM. b Schematic representation of neutrophil extravasation shows critical steps preceding diapedesis. Created with BioRender.com. c Co-cultures of HC neutrophils (Neut) with Pt.1 iECs (upper panels) or iso IECs (lower panels) for 48 h show neutrophil adhesion in mutant compared to iso iEC (p = 0.0058) and HC iEC (p = 0.0019) co-cultures, with the effect of treatment with dasatinib (Das, p = 0.0027), a TNF inhibitor (TNFi, p = 0.4089) or both (Das+TNFi, p = 0.0135) on neutrophil adhesion. Images are representative of 3 independent experiments. Scatter plot graph on y-axis indicates fold-change of the adhered neutrophil counts to HC iEC and HC neutrophil co-culture counts. Mean ± SEM of 3 technical replicates from 3 separate experiments are depicted. *p < 0.05, **p = 0.01, as determined by two-way ANOVA test. Scale bars, 50 μm. d Neutrophil transendothelial migration (TEM) is quantified after 24 h in an endothelial cell transwell migration assay. Data are presented as mean ± SEM from biological replicates of: HC iEC (n = 4), Pt1 iEC (n = 5), Pt1 iso iEC (n = 3), neutrophils only (n = 8). *p = 0.0179, **p = 0.0079, as determined by Mann–Whitney test with one-tailed p-value. Left panel was created with BioRender.com. e TEM of neutrophils is inhibited by dasatinib (p = 0.0158), or the TNF inhibitor (TNFi) (p = 0.0496); y-axis represents fold-change of the migrated neutrophil counts compared to Pt1 iEC and HC neutrophil co-culture counts. Mean ± SEM from 5 biological replicates from 3 separate experiments. *p < 0.05, as determined by paired t-test with one-tailed p-value. Source data are provided as a Source data file.
Fig. 6
Fig. 6. Co-culture of neutrophils decreases transendothelial electrical resistance by electric cell-substrate impedance sensing (ECIS) in mutant but not isogenic iECs.
a Co-culture of neutrophils with iECs leads to decreased VE-cadherin staining (green) in Pt.1 iECs (Lyn GOF iEC, white boxes) compared to healthy control (HC) iECs. Scale bars, 50 μm. b, c ECIS data presentation of baseline absolute resistance (ohm, Ω) in iECs from Lyn GOF and isogenic control (iso Lyn) as well as HC iECs. Real-time ECIS measurement of transendothelial electrical resistance (TEER) across the endothelial monolayer upon co-culture with HC neutrophils (= polymorphonuclear cells, PMN) shows a decrease in Lyn GOF iECs compared to HC (p = 0.0240) and iso Lyn iEC (p = 0.0099). Treatment with a TNF inhibitor (TNF-I, p = 0.0126) improved TEER in Lyn GOF iEC. Absolute values were normalized to the last reading before the additional treatment. Black line: iEC alone; red line: iEC and PMN added; blue line: PMN plus TNF-I; green line: PMN plus dasatinib. The changes and influence of resistance were analyzed as area under curve (AUC). Scatter plot with bar graph depicts mean values ± SEM of changes of resistance in iECs. The data were collected from n = 3 biologically independent samples for HC and Pt1 iEC and n = 1 biologically independent sample for Pt1 iso iEC. *p < 0.05, **p < 0.01 as determined by two-way ANOVA for comparison between Lyn GOF PMN and PMN + TNF-I, and ordinary one-way ANOVA for comparison between Lyn GOF PMN and HC or iso Lyn. Turkey multiple comparisons post-test was used in all analyses. Source data are provided as a Source data file.

References

    1. de Jesus AA, Canna SW, Liu Y, Goldbach-Mansky R. Molecular mechanisms in genetically defined autoinflammatory diseases: disorders of amplified danger signaling. Annu. Rev. Immunol. 2015;33:823–874. doi: 10.1146/annurev-immunol-032414-112227. - DOI - PMC - PubMed
    1. Lin B, Goldbach-Mansky R. Pathogenic insights from genetic causes of autoinflammatory inflammasomopathies and interferonopathies. J. Allergy Clin. Immunol. 2022;149:819–832. doi: 10.1016/j.jaci.2021.10.027. - DOI - PMC - PubMed
    1. Scapini P, Pereira S, Zhang H, Lowell CA. Multiple roles of Lyn kinase in myeloid cell signaling and function. Immunol. Rev. 2009;228:23–40. doi: 10.1111/j.1600-065X.2008.00758.x. - DOI - PMC - PubMed
    1. Lowell CA. Src-family and Syk kinases in activating and inhibitory pathways in innate immune cells: signaling cross talk. Cold Spring Harb. Perspect. Biol. 2011;3:a002352. doi: 10.1101/cshperspect.a002352. - DOI - PMC - PubMed
    1. Ingley E. Functions of the Lyn tyrosine kinase in health and disease. Cell Commun. Signal. 2012;10:21. doi: 10.1186/1478-811X-10-21. - DOI - PMC - PubMed

Publication types