. 2023 Mar 17;14(1):1477.
doi: 10.1038/s41467-023-37188-3.

Spatial profiling of microbial communities by sequential FISH with error-robust encoding

Affiliations

Spatial profiling of microbial communities by sequential FISH with error-robust encoding

Zhaohui Cao et al. Nat Commun. .

Abstract

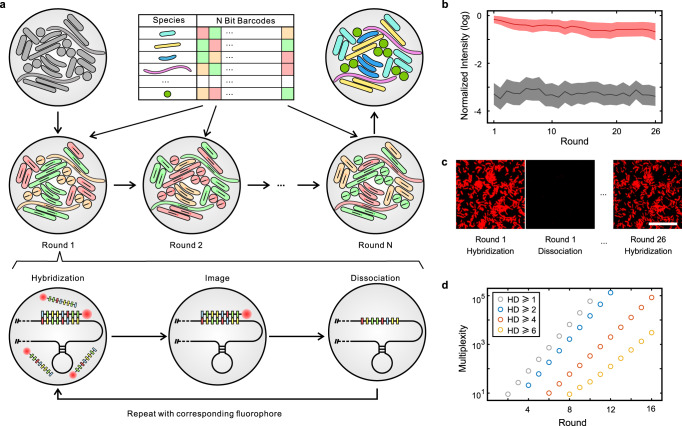
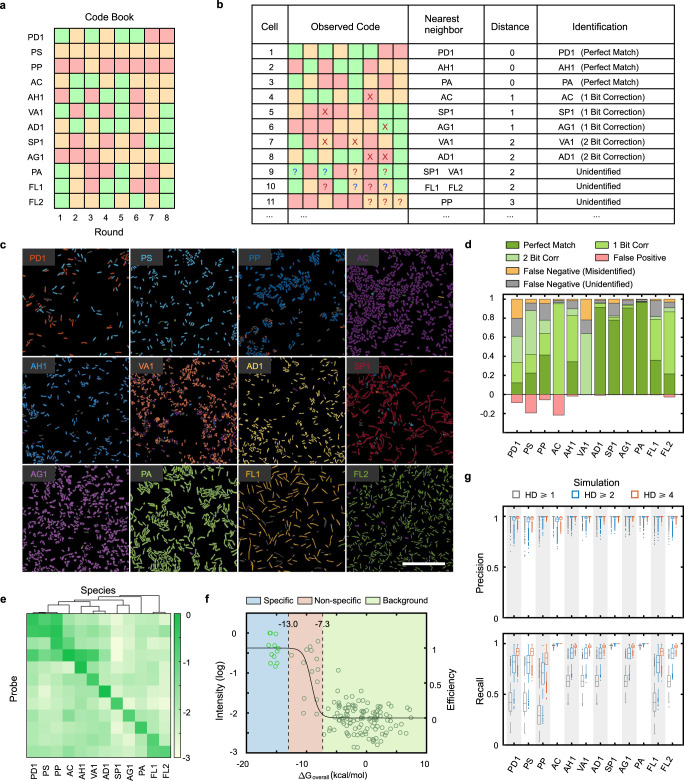
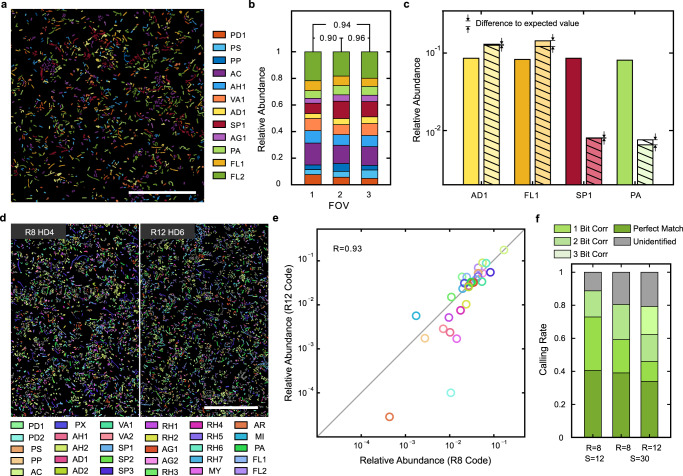
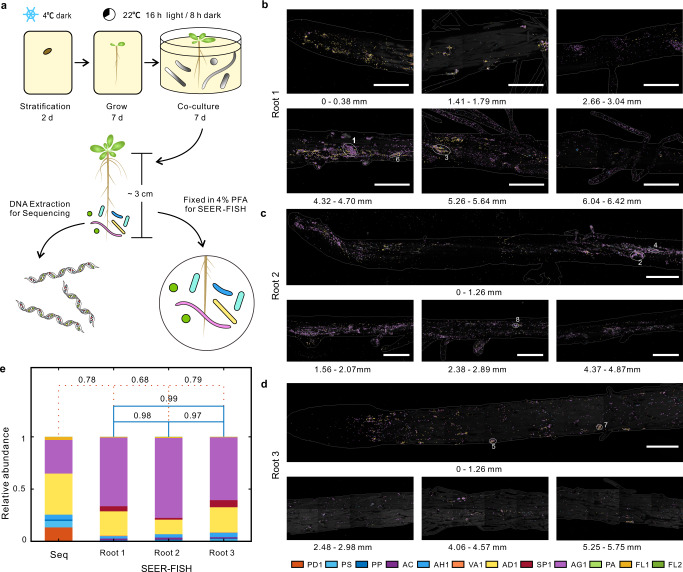
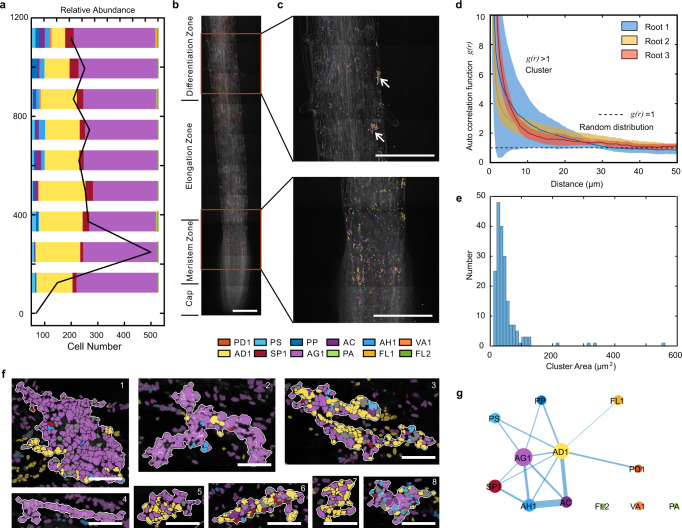
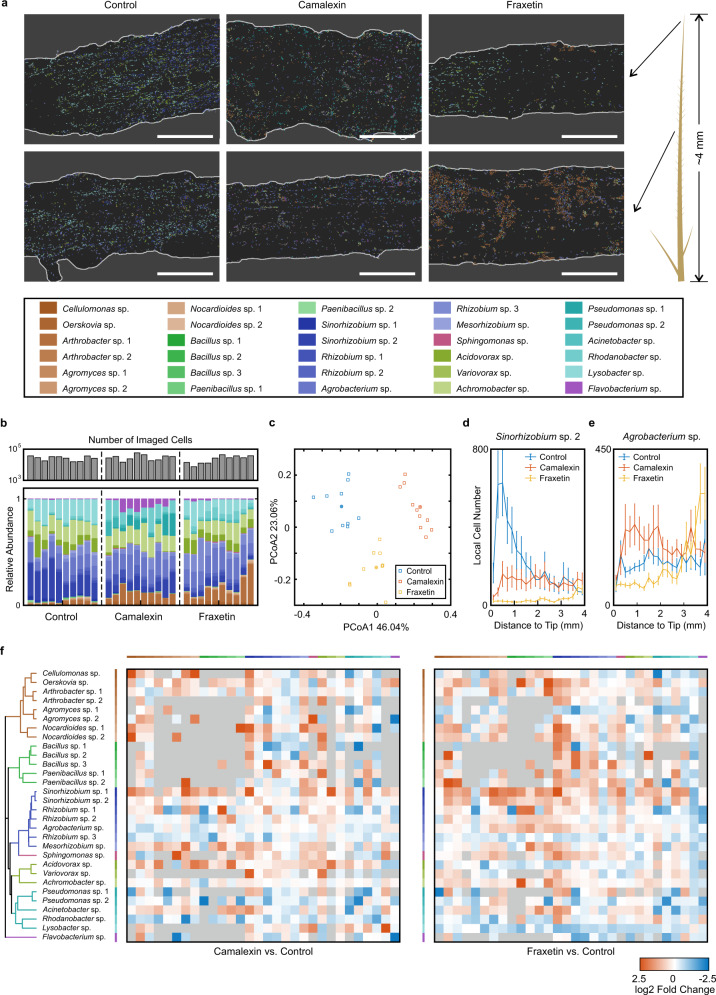
Spatial analysis of microbiomes at single cell resolution with high multiplexity and accuracy has remained challenging. Here we present spatial profiling of a microbiome using sequential error-robust fluorescence in situ hybridization (SEER-FISH), a highly multiplexed and accurate imaging method that allows mapping of microbial communities at micron-scale. We show that multiplexity of RNA profiling in microbiomes can be increased significantly by sequential rounds of probe hybridization and dissociation. Combined with error-correction strategies, we demonstrate that SEER-FISH enables accurate taxonomic identification in complex microbial communities. Using microbial communities composed of diverse bacterial taxa isolated from plant rhizospheres, we apply SEER-FISH to quantify the abundance of each taxon and map microbial biogeography on roots. At micron-scale, we identify clustering of microbial cells from multiple species on the rhizoplane. Under treatment of plant metabolites, we find spatial re-organization of microbial colonization along the root and alterations in spatial association among microbial taxa. Taken together, SEER-FISH provides a useful method for profiling the spatial ecology of complex microbial communities in situ.


Conflict of interest statement

The authors declare no competing interests.

Figures

Fig. 1
Fig. 1. SEER-FISH allows superior multiplexity in spatial profiling of microbiomes.
a Design of SEER-FISH. Each bacterial taxon is encoded by an F-color N-bit barcode. The spatial distribution of the microbial community can be obtained through R rounds of FISH. Each round of SEER-FISH includes probe hybridization, imaging, and probe dissociation (see Multi-round FISH imaging in Methods, Supplementary Fig. 1a). b, c Fluorescence intensity over 26 rounds of SEER-FISH. Lines indicate the mean fluorescence intensity (log-transformed and normalized by the maximum pixel value of CCD) of bacterial cells (n = 2257) after hybridization (red line) and dissociation (black line), respectively. The shadow of each line indicates the standard deviation. Fluorescence intensity at the 1st and 26th rounds of imaging is shown in panel c. Scale bar, 25 μm. d The multiplexity of SEER-FISH increases exponentially with the number of rounds. The colors of the circles indicate the minimal Hamming distance (HD) between barcodes. All codebooks are generated with three colors (F = 3). Source data are provided as a Source Data file.
Fig. 2
Fig. 2. SEER-FISH enables highly accurate taxonomic identification.
a The codebook used for the validation experiment on the synthetic community consisting of 12 bacterial species (Supplementary Table 5, R8HD4 codebook). b Illustration of the decoding scheme for the codebook shown in panel a. Crosses (or question marks) indicate errors that can (or cannot) be corrected by mapping to the nearest neighbor in the codebook. c Identification of bacterial species grown in pure culture by eight rounds of imaging (R8HD4 codebook). The pseudocolor of each bacterial species is indicated by its acronym. Scale bar, 25 μm. d Quantification of results in panel c. For each species, cells correctly identified (including perfect match, 1-bit correction, and 2-bit correction) are true positives (Green); cells incorrectly identified as other 11 species are marked as misidentified (Orange); cells that cannot be classified to any of the 12 species are marked as unidentified (Gray). Cells of other 11 species incorrectly identified as the corresponding species are false positives (Red). Ratios are normalized by the total cell number of each species. e Analysis of probe specificity. The measured fluorescence intensity of bacterial cells (pure culture, average of ~1000 cells) hybridized with probes designed to target individual species. The species are clustered by the phylogenetic distance between full 16 S sequences (Minimum-Evolution Tree, MEGA-X v10.1.8). Probes (y-axis) follow the same order as the targeted species (x-axis). f The relationship between the measured fluorescence intensity and the change in free energy (ΔG) of each probe-species pair. The light and dark green circles indicate the measured fluorescence intensity of diagonal and off-diagonal probe-species hybridization shown in panel e, respectively. The black line indicates the predicted hybridization efficiency E (see Probe design in Methods). g Simulations show that both precision and recall of taxonomic identification are improved by error-robust encoding. The colored boxplot indicates the predicted distribution of precision and recall of SEER-FISH with n = 5000 randomly generated codebooks (F = 3, R = 8, S = 12) with different minimal HD (HD ≥ 1, 2, 4). The height of the box indicates the first and third quartiles. Source data are provided as a Source Data file.
Fig. 3
Fig. 3. SEER-FISH gives robust estimates of the composition of complex microbial communities.
a Representative image, profiling of SynCom12 based on R8HD4 codebook. Scale bar, 50 μm. b Quantification of 12 species relative abundance in SynCom12 in three independent imaging experiments (n = 15818, 33365 and 24503 cells, respectively). Pearson correlation between different Fields of View (2 and 3) and between experimental replicates (1 and 2, 1 and 3) are indicated. c Bars of the same color indicate the relative abundance of a given species in SynCom12 (left) and SynCom12_unequal (right) quantified by SEER-FISH. The expected relative abundance after adjustment in SynCom12_unequal is labeled by the stripes. d Representative images, profiling of SynCom30 based on two different codebooks (R8HD4, n = 93,596 cells vs. R12HD6, n = 101,084 cells). Scale bar, 50 μm. e Correlation between the relative abundance profiles estimated by two imaging experiments using codebook 1 (R = 8, HD ≥ 4, S = 30) and codebook 2 (R = 12, HD ≥ 6, S = 30). f The ratios of identified and unidentified cells. Left bar: SynCom12 (a); middle and right bars: SynCom30 (d). Source data are provided as a Source Data file.
Fig. 4
Fig. 4. Spatial profiling of microbial communities colonized on Arabidopsis roots by SEER-FISH.
a The protocol of synthetic microbial community colonization on Arabidopsis roots. Arabidopsis seeds were germinated on an MS plate and then colonized by a synthetic community of 12 bacterial species for 7 days under hydroponic conditions. bd The colonization of 12-species synthetic community on different regions of 3 independent roots as identified by SEER-FISH. The edges of the root (white lines) are drawn manually based on the phase-contrast image. Scale bars, 100 μm. Numbers below each image indicate the distance to the root tip. Circles and numbers indicate the location of bacteria clusters shown in Fig. 5f. e The composition of the communities colonized on root measured by 16 S amplicon sequencing (mixture of 10 roots) and SEER-FISH (the Pearson correlation is indicated by orange dash lines). The Pearson correlation between the community compositions on 3 roots measured by SEER-FISH is indicated by blue lines. Source data are provided as a Source Data file.
Fig. 5
Fig. 5. Spatial patterns of the root-colonized microbial communities at single cell resolution.
a Relative abundance of each species (bars) and the number of cells (black line) by imaging along the root of Arabidopsis. Each bar indicates the relative abundance in an FOV of 125 μm (width) × 250 μm (length). b Representative images illustrate the spatial distribution near the root tip (~1 mm from the tip) labeled by the universal probe EUB338. Scale bar, 100 μm. c Bacterial colonization marked by the pseudo color of each species at different regions along the root. Species AG1 and AD1 are found in clusters (white arrows). Scale bar, 100 μm. d The spatial correlation of root-colonized bacterial cells is analyzed by linear dipole algorithm (see Contact frequency analysis in Methods). The solid lines indicate the mean auto correlation between bacterial cells, the shadows indicate the 95% confidence intervals estimated by sampling different regions on each root. The horizontal dash line (g(r) = 1) refers to the expected value of a randomized spatial distribution. e The distribution of cluster area. f Representative images of clusters. Scale bars, 10 μm. The clusters are surrounded by white lines and cells outside clusters are shown with a dimmer color. g Intertaxon spatial contacts observed for 12-species bacterial communities colonized on roots. Each edge shows non-random contact between two species (Supplementary Fig. 13, Methods). The width of edges is proportional to the fold increase in contact frequency compared to randomly distributed cells. The size of nodes is proportional to the relative abundance (log-transformed) of each species. Source data are provided as a Source Data file.
Fig. 6
Fig. 6. Perturbation on the spatial organization of root-colonized microbial communities by plant metabolites.
a Representative images of microbial communities in the meristem and elongation zone (~200 μm from the tip, top panels) and in the differentiation zone (~1.7 mm from the tip, bottom panels). Scalebar, 50 μm. b The number of imaged microbial cells and the community compositional profiles given by SEER-FISH. The number of cells imaged by SEER-FISH for a root sample in the control group, the camalexin-treated group and the fraxetin-treated group were 2.7 ± 0.8 × 104, 3.1 ± 1.3 × 104, and 2.5 ± 1.2 × 104, respectively. For each experimental group, 10 roots were imaged. For each root, ~80 FOVs were captured (within ~4 mm from the root tip). c Principal Coordinate Analysis (PCoA) based on Bray-Curtis dissimilarity of community compositional profiles given by imaging. Solid square indicates the compositional profile averaged over 10 root samples. d, e Spatial distribution of Sinorhizobium sp. 2 (d) and Agrobaterium sp. (e) along the root. Error bars are SEMs (n = 10 roots). f Differential spatial association analysis on root-colonized microbial taxa between camalexin-treated (or fraxetin-treated) plants and control plants (see Spatial association analysis in Methods). Fold change refers to log2[(association frequency on camalexin-treated (or fraxetin-treated) roots/simulated random frequency in treated roots)/(association frequency on control roots/simulated random frequency in control roots)]. Gray areas indicate that the analysis is not applicable. Source data are provided as a Source Data file.

Similar articles

Cited by

References

    1. Nadell CD, Drescher K, Foster KR. Spatial structure, cooperation and competition in biofilms. Nat. Rev. Microbiol. 2016;14:589–600. doi: 10.1038/nrmicro.2016.84. - DOI - PubMed
    1. Donaldson GP, Lee SM, Mazmanian SK. Gut biogeography of the bacterial microbiota. Nat. Rev. Microbiol. 2016;14:20–32. doi: 10.1038/nrmicro3552. - DOI - PMC - PubMed
    1. Mark Welch JL, Ramirez-Puebla ST, Borisy GG. Oral Microbiome Geography: Micron-Scale Habitat and Niche. Cell Host Microbe. 2020;28:160–168. doi: 10.1016/j.chom.2020.07.009. - DOI - PMC - PubMed
    1. Remus-Emsermann MN, et al. Spatial distribution analyses of natural phyllosphere-colonizing bacteria on Arabidopsis thaliana revealed by fluorescence in situ hybridization. Environ. Microbiol. 2014;16:2329–2340. doi: 10.1111/1462-2920.12482. - DOI - PubMed
    1. Richardson, A.E., Kawasaki, A., Condron, L.M., Ryan, P.R. & Gupta, V.V.S.R. In Rhizosphere Biology: Interactions Between Microbes and Plants. (eds. Gupta, V.V.S.R. & Sharma, A.K.) 109–128 (Springer Singapore, Singapore; 2021).

Publication types