. 2023 Mar 17;14(1):1488.
doi: 10.1038/s41467-023-37187-4.

Modeling of three-dimensional innervated epidermal like-layer in a microfluidic chip-based coculture system

Affiliations

Modeling of three-dimensional innervated epidermal like-layer in a microfluidic chip-based coculture system

Jinchul Ahn et al. Nat Commun. .

Abstract

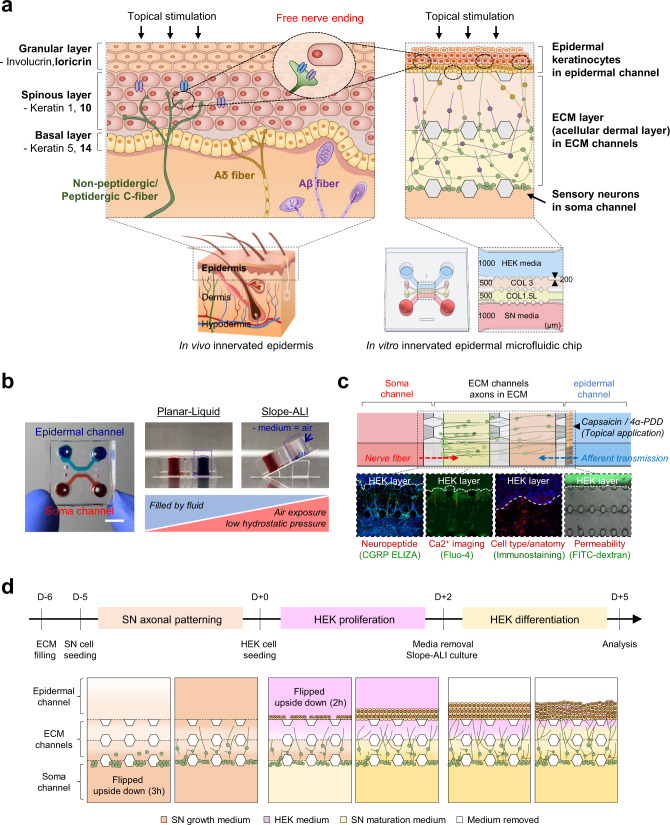
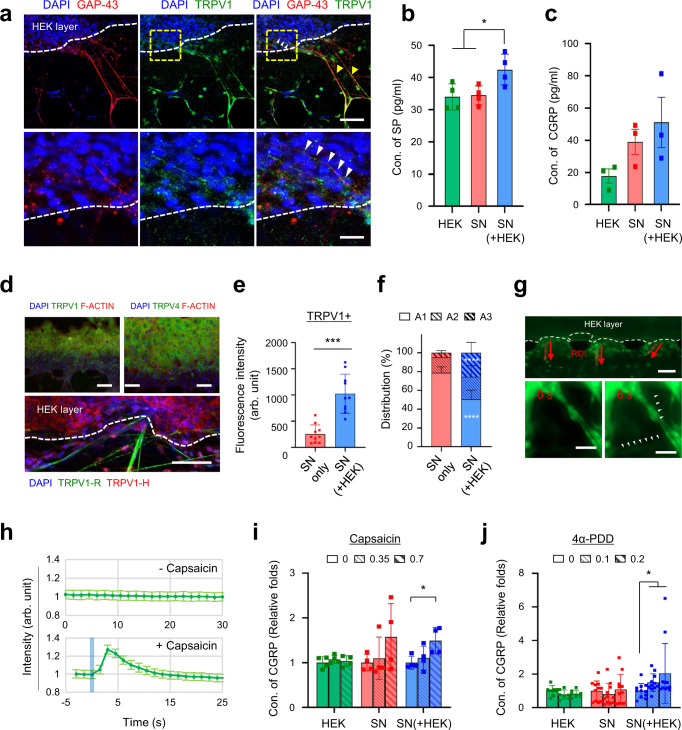
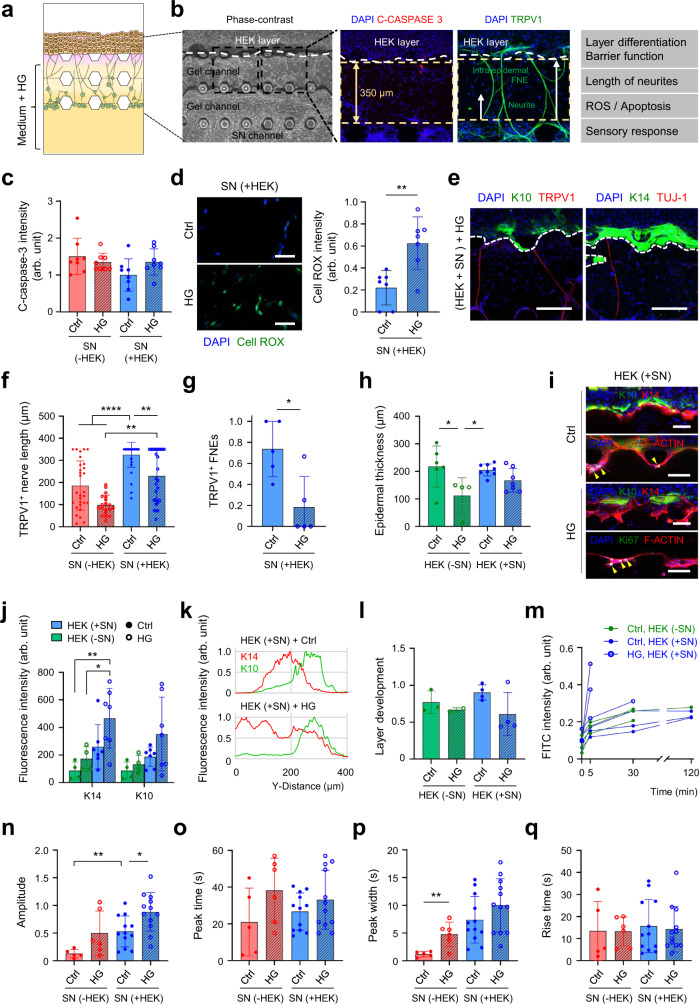
Reconstruction of skin equivalents with physiologically relevant cellular and matrix architecture is indispensable for basic research and industrial applications. As skin-nerve crosstalk is increasingly recognized as a major element of skin physiological pathology, the development of reliable in vitro models to evaluate the selective communication between epidermal keratinocytes and sensory neurons is being demanded. In this study, we present a three-dimensional innervated epidermal keratinocyte layer as a sensory neuron-epidermal keratinocyte co-culture model on a microfluidic chip using the slope-based air-liquid interfacing culture and spatial compartmentalization. Our co-culture model recapitulates a more organized basal-suprabasal stratification, enhanced barrier function, and physiologically relevant anatomical innervation and demonstrated the feasibility of in situ imaging and functional analysis in a cell-type-specific manner, thereby improving the structural and functional limitations of previous coculture models. This system has the potential as an improved surrogate model and platform for biomedical and pharmaceutical research.


Conflict of interest statement

The authors declare no competing interests.

Figures

Fig. 1
Fig. 1. Microfluidic platform and culture system for sensory neurons-keratinocytes co-culture.
a Schematic illustration and design of human skin anatomy (left) and the innervated epidermal chip to coculture sensory neurons and keratinocytes (right). Schematic design of the innervated epidermal chip compartments (right lower). HEK; human keratinocyte, SN; sensory neuron, COL 3; collagen I at 3 mg/ml concentration, COL 1.5 L; collagen I at 1.5 mg/mL with 10% laminin, Scale unit; μm. b Top view of the microfluidic chip (left) and experimental concept of slope-based air-liquid interface (ALI) method for epidermal development (right, longitudinal vertical section view). Each cell channel was marked with a different color dye. c Cell-type-specific assays for the innervated epidermal chip. d Experimental workflow of cell seeding and culture for generating the innervated epidermal chip.
Fig. 2
Fig. 2. Optimization of 3D extracellular matrix (ECM) hydrogels for axon patterning of sensory neurons in a microfluidic chip.
a Representative fluorescence images of elongated nerve fibers of sensory neurons in microchannels for each ECM condition. NF-M; neurofilament M, green, DAPI; nuclei, blue. COL 2; collagen I at 2 mg/ml concentration, COL 2 L; collagen I at 2 mg/mL with 10% laminin, COL 1.5 L; collagen I at 1.5 mg/mL with 10% laminin. 2D; conventional monolayer culture method. Scale bars; 100 μm. b–g Quantitative analysis of axonal changes according to ECM conditions of the chip. Maximum (b, d) and total neurite length (c, e) of sensory neurons at each time point after culture (n = 5–8 ROIs, at least 10 neurites were measured in each ROI, COL1.5 L(d4) vs COL2L(d4) **p = 0.0014, COL1.5 L(d6) vs COL2L(d6) p = 0.1211 for maximum neurite length, COL1.5 L(d4) vs COL2L(d4) *p = 0.0126, COL1.5 L(d6) vs COL2L(d6) ***p = 0.0006 for total neurite length, 2 independent replicates). Box plot of the neurite width (f) of a sensory neuron 6 days after culture (n = 19 ROIs, 2D vs COL2, COL2L, COL1.5 L ****p < 0.0001, COL2 vs COL2L **p = 0.0041, COL2 vs COL1.5 L *p = 0.0119, 2 independent replicates). Box plot of neurite angles (g) of sensory neurons 2 days and 6 days after culture (n = 36–40 ROIs, 2 independent replicates). One-way ANOVA, Bonferroni’s multiple comparisons test. Data are mean ± SD, *p < 0.05, **p < 0.01, ***p < 0.001, ****p < 0.0001. Box plot shows median and 75th and 25th percentiles, and whiskers show minimum and maximum values.
Fig. 3
Fig. 3. Advanced epidermal development on a slope-ALI microfluidic chip.
a Representative bright-field images of the epidermal layer 1 and 4 d after human keratinocytes culture using conventional planar liquid (planar-liquid) or slope-based ALI (slope-ALI) methods on a microfluidic chip (3 independent replicates). Scale bars; 100 μm. b Immunofluorescence images of the developed epidermal layers stained with F-ACTIN (red) 5 d after culture on a microfluidic chip. DAPI (blue). Scale bars; 100 μm. c Quantification of the epidermal thickness (n = 12 ROIs, 3 ROIs per device *p = 0.0105, 2 independent replicates). d Representative immunofluorescence images for keratin 14 (K14, red), keratin 10 (K10, green), and loricrin (green) in planar-liquid or slope-ALI cultured epidermal layer. DAPI (blue). Scale bars; 50 μm. e, f Quantification of fluorescence intensity (n = 4–7 devices, planar-liquid vs slope-ALI *p = 0.0229 for K14, **p = 0.0012 for K10, **p = 0.0032 for loricrin, 2 independent replicates) (e) and RNA level (n = 5 devices, planar-liquid vs slope-ALI *p = 0.0391 for K14, *p = 0.0494 for K10, **p = 0.0038 for loricrin, 2 independent replicates) (f) in the epidermal layers cultured with planar-liquid or slope-ALI on a microfluidic chip. g 3D confocal images of K14/K10 layer development of the keratinocyte layer (3 independent replicates). Scale bars; 50 μm. h–j Permeability of planar-liquid and slope-ALI culture epidermal layers. The distribution images (h), time-lapse intensity plot (j), and its normalized fluorescent intensity (i, at 120 min) of 3.984 kDa FITC–dextran at the interface region of the white dashed line between the ECM hydrogel and epidermal keratinocyte layer in the chip (n = 3 devices, **p = 0.0041, 2 independent replicates). Scale bars; 200 μm. k Immunoblotting of ERK phosphorylation. ERK1/2; anti-total ERK1/2, pERK; anti-phospho ERK1/2. l qPCR analysis of ki67 and MMP1 expression in epidermal keratinocytes 24 h after each culture (n = 5 devices, ****p < 0.0001 for Ki67, *p = 0.0181 for MMP1, 2 independent replicates). Data are mean ± SD, *p < 0.05, **p < 0.01, ***p < 0.001, ****p < 0.0001. Two-tailed t-test.
Fig. 4
Fig. 4. The structural complexity of the innervated epidermal-like layer in the microfluidic chip.
a, c 3D confocal images of innervated epidermal-like layer for K10, K14 (green) and TUJ1, NF-M (red) (2 independent replicates). Scale bars; 100 μm. b Immunofluorescence images for PGP 9.5 (green) and F-ACTIN (red) in SN only or in the SN + HEK group. Magnifications (bottom) of the region highlighted in the white dashed box (top) (2 independent replicates). Scale bars; 100 μm. d, e Morphological quantification of sensory neurons along the regions. The number of sensory neurites (n = 3 independent replicates, SN + HEK vs SN only *p = 0.0437 for A3, A2 vs A3 *p = 0.0301 and A3 vs A4 **p = 0.0097 for SN + HEK) (d) and the width of sensory neurite bundles (n = 8–39 ROIs, SN + HEK vs SN only *p = 0.0109 for A2, ****p < 0.0001 for A3 and A4, 3 independent replicates) (e) in SN only or in the SN + HEK group. f–i Comparison of sensory neuron types by quantifying the fluorescence intensity of NF200+, CGRP+, or IB4+ cells between SN only and SN + HEK groups. Quantitative analysis of the total amount (n = 5–10 ROIs, 2 ROIs per device, SN + HEK vs SN only *p = 0.0121 for total CGRP, *p = 0.0323 for total IB4, 2 independent replicates) (f) and spatial distribution (h, i) of neuron types along the regions (g) (n = 5–10 ROIs, CGRP ratio of SN + HEK vs SN only ***p = 0.0004 for A1, **p = 0.0018 for A3, IB4 ratio of SN + HEK vs SN only ****p < 0.0001 for A1 and A2, ***p = 0.0007 for A3, 2 independent replicates). A1 and A2; areas of the dermal ECM, A3; areas under and inside the epidermal layer, A4; area of the deep epidermal layer. j, k Image-based quantification of the epidermal layer differentiation in HEK only or in the HEK + SN group. Representative immunofluorescence images (j) of K14/K10 layer development. Y = 0 (μm): Interface of collagen gel channel and HEK channel, Y > 0: apical (ALI), and Y < 0: basal (gel) directions (k) (4 independent replicates). Scale bars; 50 μm. l, m Epidermal layer permeability of 376.27 Da FITC-sodium at 120 min (m) and a 3D confocal image (l) of K14 (red) and K10 (green) in the epidermal layer. Scale bars; 50 μm (n = 3 devices, 1 independent replicate). Data are mean ± SD, *p < 0.05, **p < 0.01, ***p < 0.001, ****p < 0.0001. Two-tailed t-test, two-tailed Mann–Whitney test or one-way ANOVA, Tukey’s multiple comparisons test.
Fig. 5
Fig. 5. Functional integrity of the innervated epidermal-like layer in the microfluidic chip.
a Representative immunofluorescence images of TRPV1 (green) and GAP-43 (red) expression in sensory neurons co-cultured with keratinocytes on a chip. Arrowheads indicate TRPV1+ cells co-stained with GAP-43 in either the outer epidermal and ECM layers (yellow) or the intraepidermal layer (white). White dashed line; the outer epidermal layer. Magnifications (bottom) of the region are highlighted in the yellow dashed box (top). Scale bars; 100 μm, 25 μm, respectively (1 independent replicate). b, c Quantification of neuropeptides released from HEK only, SN only, and SN + HEK group under unstimulated conditions. The concentration of substance P (n = 4 devices, SN + HEK vs HEK *p = 0.036, SN + HEK vs SN *p = 0.0248, 2 independent replicates) (b) or CGRP (n = 3 independent replicates, mean ± SEM) (c) is determined in culture supernatants. d–f TRPV1 and TRPV4 expression in the innervated epidermal chip. Representative immunofluorescence images (top of d) of epidermal keratinocytes TRPV1 or TRPV4 (green) and F-ACTIN (red) expression. TRPV1 expression (bottom of d) was confirmed with a human-specific antibody (TRPV1-H, red) or with a rat-specific antibody (TRPV1-R, green). Scale bars; 100 μm, 50 μm, respectively. Quantification of total TRPV1+ neurons (e) and spatial distribution (f) of TRPV1+ neurons along the regions (presented in Fig. 4g) (n = 10 ROIs, 2 ROIs per device, SN + HEK vs SN ****p < 0.0001 for A1 and A3, 2 independent replicates). g, h Capsaicin-evoked Ca2+ transients of innervating sensory neurons. Intracellular Ca2+ images (g) of neurons responding to topical application of capsaicin (0.1 mM) and the fluorescence intensity time course (h) of peak Ca2+ transients (calcium fluorescence intensities along the axon was indicated mean ± SD, 2 independent replicates). i, j The CGRP release from sensory neurons co-cultured with keratinocytes following topical application of capsaicin (i, agonist for TRPV1) (n = 4 devices, cap(0.7) vs cap(0) *p = 0.0286 for SN + HEK, 2 independent replicates) or 4α-PDD (j, agonist for TRPV4) (n = 7–11 devices, cap(0.1) vs cap(0) *p = 0.028, cap(0.2) vs cap(0) *p = 0.0192 for SN + HEK, 2 independent replicates) at indicated concentrations (unit: mM). Data are mean ± SD, *p < 0.05, ***p < 0.001, ****p < 0.0001. Two-tailed t-test or two-tailed Mann–Whitney test.
Fig. 6
Fig. 6. Acute hyperglycemia-induced pathological modeling using innervated epidermal-like layer chips.
a Modeling of hyperglycemia (HG)-induced innervated epidermis on a microfluidic chip, and analyzing in a cell-type-specific manner (b). c Quantification of fluorescence intensity of the cleaved caspase 3+ population in sensory neurons (n = 8 ROIs, 2 ROIs per device, Ctrl vs HG p = 0.8536 for SN-HEK and p = 0.2947 for SN + HEK, SN + HEK vs SN-HEK p = 0.0694 for Ctrl, 2 independent replicates). d Intracellular reactive oxygen species (ROS) levels in the innervating neurons (n = 7 ROIs, 2 ROIs per device **p = 0.0027, 1 independent replicates). Scale bars; 50 μm. e Immunofluorescence images of innervated epidermis for K14 or K10 (green) and TRPV1 or TUJ1 (red) after 3 d of high glucose exposure (2 independent replicates). Scale bars; 200 μm. f,g Hyperglycemia-induced changes in TRPV1+ neurons are determined by quantification of neurite length (f) of TRPV1+ neurons (n = 19–37 ROIs, SN + HEK (Ctrl) vs SN-HEK (Ctrl, HG) ****p < 0.0001, SN + HEK (Ctrl) vs SN + HEK (HG) **p = 0.0062, SN + HEK (HG) vs SN-HEK (HG) **p = 0.0018, 2 independent replicates, Kruskal–Wallis test) and free nerve endings (FNEs, g) of TRPV1+ neurons innervating the epidermal keratinocyte layer (n = 4–5 devices, *p = 0.0317, 2 independent replicates). h–l Hyperglycemia-induced changes of epidermal layer development. Quantification of the epidermal thickness (n = 4–8 devices, HEK-SN (Ctrl) vs HEK-SN (HG) *p = 0.0207, HEK + SN (Ctrl) vs HEK-SN (HG) *p = 0.0336, 2 independent replicates) (h) and K14+ and K10+ layers (j) between controls and HG groups. Immunofluorescence images (i) of K14, K10, and ki67-positive cells (yellow arrowheads) and fluorescence intensity plots (k) of K14 and K10 in epidermal layers. Scale bars; 200 μm. The relative ratio of K10 over the K14 layer along the Y-axis showing layer organization (l) (n = 2–4 devices, 2 independent replicates). m Hyperglycemia-induced changes in epidermal permeability of 376.27 Da FITC-sodium. n–q Capsaicin(0.1 mM)-evoked Ca2+ transients between controls and HG groups. Amplitude (SN + HEK (Ctrl) vs SN-HEK (Ctrl) **p = 0.0072, SN + HEK (Ctrl) vs SN + HEK (HG) *p = 0.0117) (n), peak time (o), peak width (p), and rise time (SN-HEK (Ctrl) vs SN-HEK (HG) **p = 0.0067) (q) (n = 5–6 ROIs for SN-HEK, 12 ROIs for SN + HEK, 2 ROIs per device, 2 independent replicates). Data are mean ± SD, *p < 0.05, **p < 0.01, ***p < 0.001, ****p < 0.0001. Two-tailed t-test, two-tailed Mann–Whitney test or one-way ANOVA, Tukey’s multiple comparisons test.

Similar articles

Cited by

References

    1. Dekoninck S, et al. Defining the design principles of skin epidermis postnatal growth. Cell. 2020;181:604–620 e622. doi: 10.1016/j.cell.2020.03.015. - DOI - PMC - PubMed
    1. Natsuga K. Epidermal barriers. Cold Spring Harb. Perspect. Med. 2014;4:a018218. doi: 10.1101/cshperspect.a018218. - DOI - PMC - PubMed
    1. Boulais N, Misery L. The epidermis: a sensory tissue. Eur. J. Dermatol. 2008;18:119–127. - PubMed
    1. Snider WD, McMahon SB. Tackling pain at the source: new ideas about nociceptors. Neuron. 1998;20:629–632. doi: 10.1016/S0896-6273(00)81003-X. - DOI - PubMed
    1. Lumpkin EA, Caterina MJ. Mechanisms of sensory transduction in the skin. Nature. 2007;445:858–865. doi: 10.1038/nature05662. - DOI - PubMed

Publication types