. 2023 Mar 17;14(1):1489.
doi: 10.1038/s41467-023-37193-6.

Telomere length associates with chronological age and mortality across racially diverse pulmonary fibrosis cohorts

Affiliations

Telomere length associates with chronological age and mortality across racially diverse pulmonary fibrosis cohorts

Ayodeji Adegunsoye et al. Nat Commun. .

Abstract

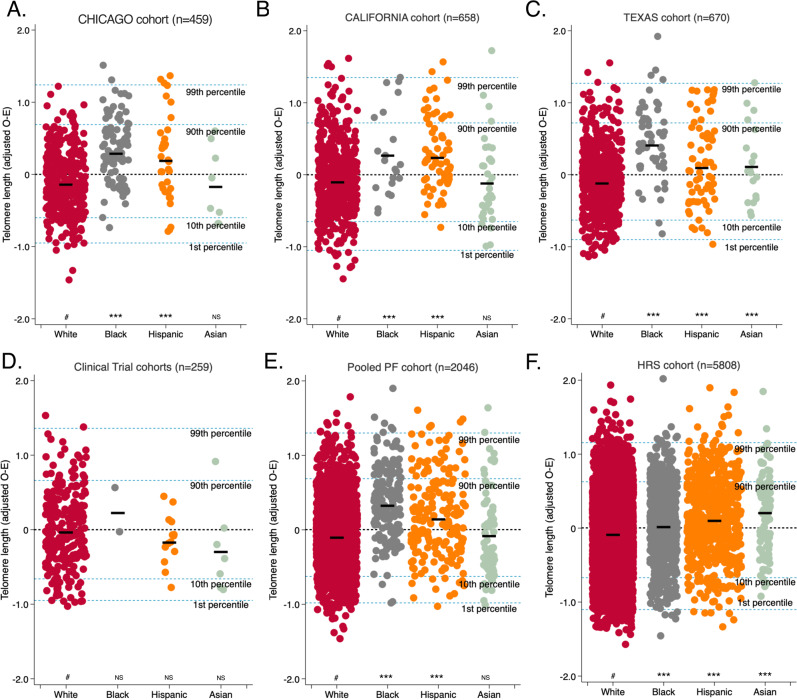
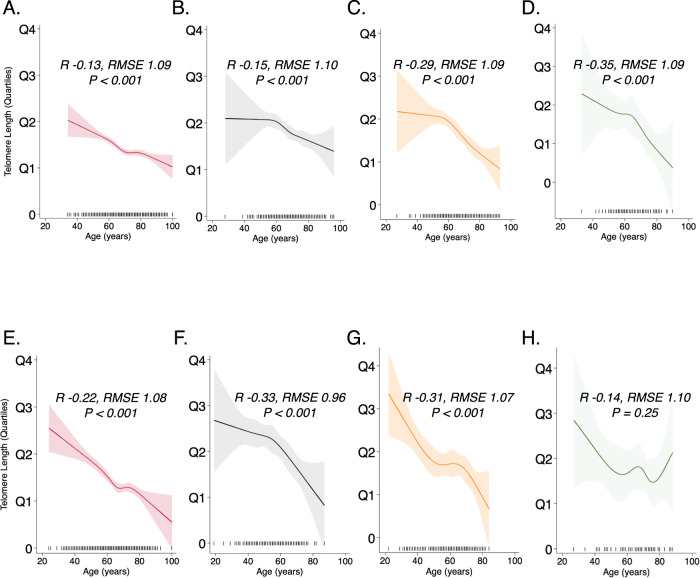
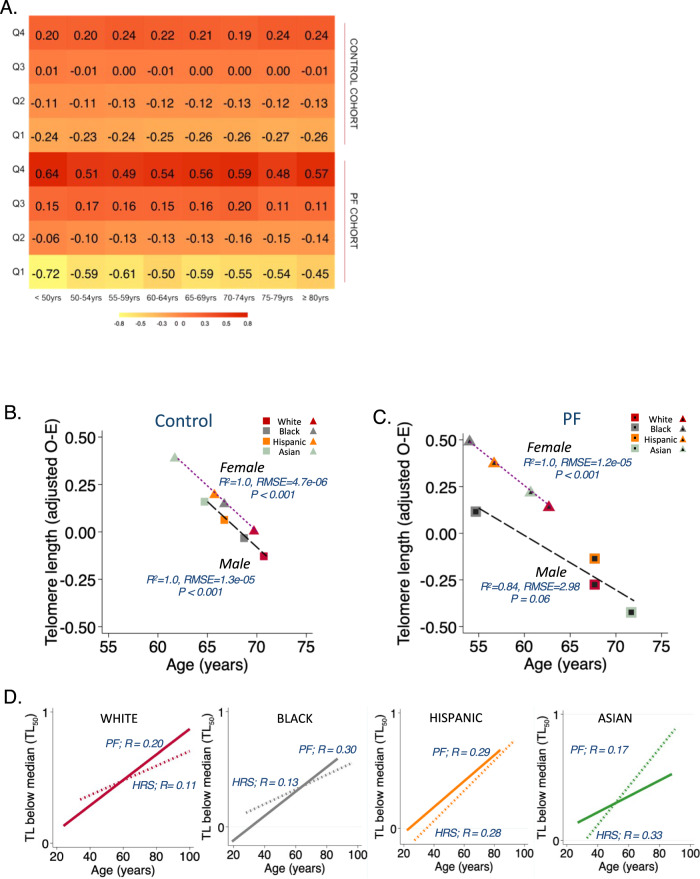
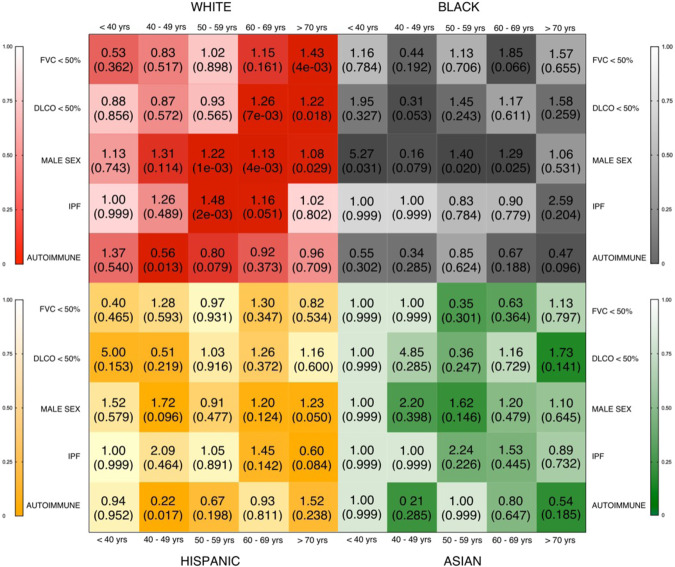
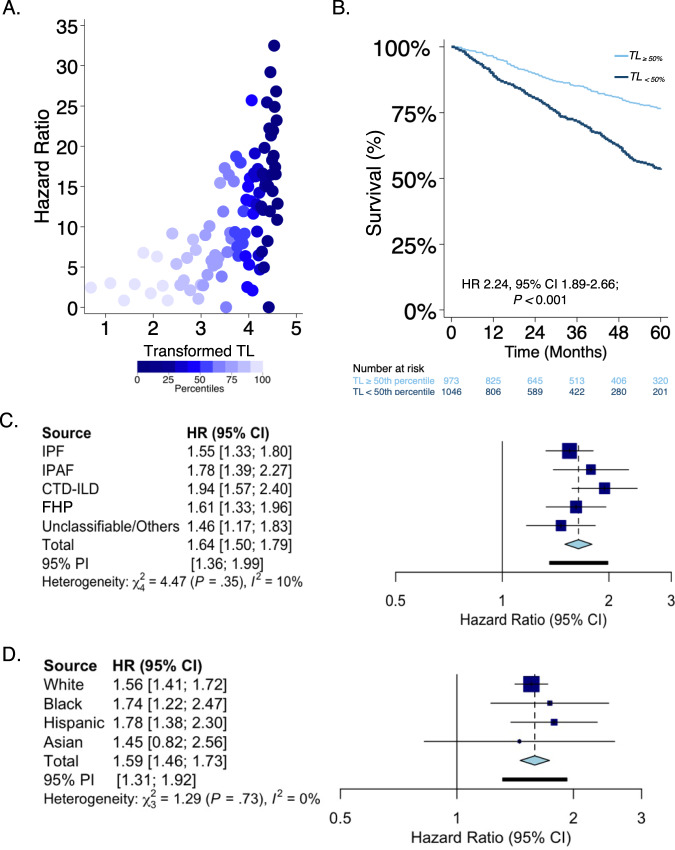
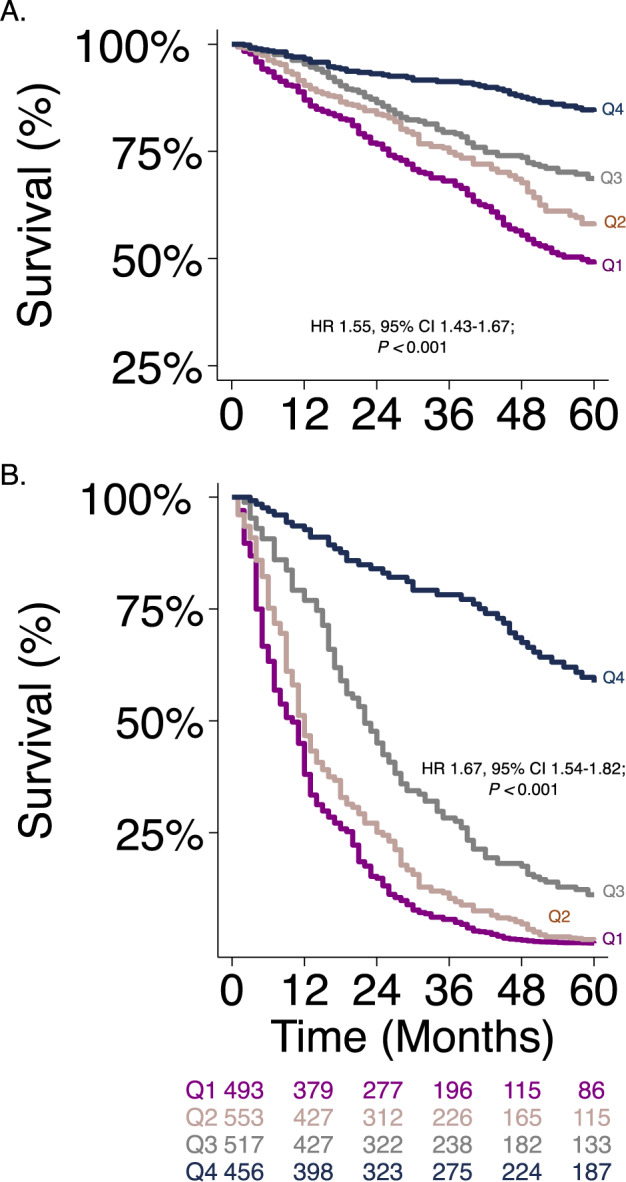
Pulmonary fibrosis (PF) is characterized by profound scarring and poor survival. We investigated the association of leukocyte telomere length (LTL) with chronological age and mortality across racially diverse PF cohorts. LTL measurements among participants with PF stratified by race/ethnicity were assessed in relation to age and all-cause mortality, and compared to controls. Generalized linear models were used to evaluate the age-LTL relationship, Cox proportional hazards models were used for hazard ratio estimation, and the Cochran-Armitage test was used to assess quartiles of LTL. Standardized LTL shortened with increasing chronological age; this association in controls was strengthened in PF (R = -0.28; P < 0.0001). In PF, age- and sex-adjusted LTL below the median consistently predicted worse mortality across all racial groups (White, HR = 2.21, 95% CI = 1.79-2.72; Black, HR = 2.22, 95% CI = 1.05-4.66; Hispanic, HR = 3.40, 95% CI = 1.88-6.14; and Asian, HR = 2.11, 95% CI = 0.55-8.23). LTL associates uniformly with chronological age and is a biomarker predictive of mortality in PF across racial groups.


Conflict of interest statement

A.A. declares speaking and advisory board fees from Genentech and Boehringer Ingelheim. C.A.N. declares consulting fees from Boehringer-Ingelheim. J.M.O. declares speaking and advisory board fees from Genentech and Boehringer Ingelheim. B.L. declares speaking fees from Genentech. P.J.W. declares personal fees from Blade therapeutics, Roche and Boehringer Ingelheim. F.J.M. declares personal fees from Copeval. I.N. declares honoraria for advisory boards with Boehringer Ingelheim, InterMune, and Anthera, speaking honoraria from GSK, and consulting fees for Immuneworks. M.E.S. declares honoraria from Genentech and editorial support from Boehringer Ingelheim. The remaining authors declare no competing interests.

Figures

Fig. 1
Fig. 1. Mean observed minus expected (O–E; age and gender-adjusted) leukocyte telomere length (TL) is longest in Black subjects with pulmonary fibrosis (PF).
Study cohort stratified according to White(W), Black(Bl), Hispanic(H), and Asian(As); A CHICAGO cohort, (W, n = 332; Bl, n = 84; H, n = 35; and As, n = 8); mean TL (relative T/S): W, Bl, H, and As = 1.38(SD 0.27), 1.62(SD 0.23), 1.51(SD 0.34), and 1.48(0.21), which correspond to mean age and gender-adjusted TL(O–E) of −0.09(0.43), 0.34(0.46), 0.24(0.59), and −0.13(0.53), respectively. B CALIFORNIA cohort, (W, n = 499; Bl, n = 21; H, n = 70; and As, n = 36); mean TL, base pairs(bp): W, Bl, H, and As = 6058bp(SD 650), 6267bp(SD 679), 6206bp(SD 662), and 6255bp(SD 682), which correspond to mean age and gender-adjusted TL(O–E) of −0.06(0.49), 0.32(0.56), 0.28(0.49), and −0.08(0.58), respectively. C TEXAS cohort, (W, n = 527; Bl, n = 55; H, n = 68; and As, n = 19); mean TL (relative T/S): W, Bl, H, and As = 1.29(SD 0.28), 1.50(SD 0.26), 1.41(SD 0.29) and 1.37(0.34), which correspond to mean age and gender-adjusted TL(O–E) of −0.07(0.46), 0.46(0.51), 0.14(0.57), and 0.16(0.55), respectively. D IPFNet cohort, (W, n = 236; Bl, n = 2; H, n = 14; and As, n = 7); mean TL(relative T/S): W, Bl, H, and As = 1.11(SD 0.21), 1.35(SD 0.43), 1.17(SD 0.23), and 1.19(0.18), which correspond to mean age and gender-adjusted TL(O–E) of 0.013(SD 0.50), 0.27(SD 0.41), −0.13(SD 0.33), and −0.25 (0.60), respectively. E Pooled PF cohort, (W, n = 1611; Bl, n = 162; H, n = 183; and As, n = 70); mean age and gender-adjusted TL(O–E) of −0.06(0.47), 0.37(0.49), 0.19(0.54), and −0.04(0.57), respectively. F HRS cohort, (W, n = 4319; Bl, n = 779; H, n = 614; and As, n = 96); mean TL(relative T/S) W, Bl, H, and As = 1.34(SD 0.65), 1.57(SD 1.11), 1.41 (SD 0.59), and 1.39(0.63), which correspond to mean age and gender-adjusted TL(O–E) of −0.04(0.49), 0.08(0.48), 0.16(0.51), and 0.19(0.53), respectively. Thick short black lines show the median for each subgroup. The black dotted line shows the median TL for each cohort group; the blue dotted lines show approximate age-adjusted prediction bands in percentiles for each cohort. Group comparisons between white subjects (#) and other racial subgroups were conducted using the student’s T-test; ***P < 0.0005; NS not significant (P ≥ 0.05).
Fig. 2
Fig. 2. Median standardized leukocyte telomere length is shortest in subjects with idiopathic PF and longest in subjects with connective tissue disease-related interstitial lung disease (CTD-ILD), and other ILDs.
Patients with pulmonary fibrosis (PF) stratified by diagnostic subgroup and median age of subgroup (gray); idiopathic pulmonary fibrosis (IPF, n = 735), unclassifiable (UNCLASS, n = 260), interstitial pneumonia with autoimmune features (IPAF, n = 207), fibrotic hypersensitivity pneumonitis (FHP, n = 422), CTD-ILD, n = 349, and other ILDs (Others, n = 73). All telomere lengths depicted are observed minus expected (O–E; age and gender-adjusted). The notched colored box shows the interquartile range (25th to 75th percentile), the horizontal thick black line indicates the median, the vertical upper and lower whiskers represent values outside the middle 50% (the upper 25% of values and the lower 25% of values, respectively), the whisker boundaries represent the maximum and minimum values, and the black dots represent outlier values. Boxplot notch displays the confidence interval around the median based on the median ± 1.58 × IQR/sqrt(n). Group comparisons between IPF (#) and other diagnostic subgroups were conducted using Mood’s median test; **P < 0.0005; NS not significant (P  ≥ 0.05).
Fig. 3
Fig. 3. Correlation of leukocyte telomere length (TL) with age.
TL demonstrates a nonlinear negative correlation with age across diverse racial groups in healthy subjects A Whites; B Blacks; C Hispanics; and D Asians; that is altered in subjects with pulmonary fibrosis E Whites; F Blacks; G Hispanics; and H Asians. Statistical test: Restricted cubic spline regression of TL on age across racial/ethnic groups. Model goodness of fit indicated by R (correlation coefficient), RMSE (root mean square error) of restricted cubic spline (solid line), and P value reported for the respective populations. Lighter colored band indicates 95% confidence intervals; vertical bars on the horizontal scale indicate individual observations.
Fig. 4
Fig. 4. Standardized leukocyte telomere length (TL) measured by qPCR demonstrates wider interquartile range variation in pulmonary fibrosis (PF) and decreases with increasing age.
A Age-stratified mean values of TL measurements increase within quartiles (Q) from the first quartile (Q1) to the fourth quartile (Q4) for 2046 subjects with PF and 5808 control subjects. Median TL for each race (White red, Black gray, Hispanic orange, and Asian green) stratified by sex (male = squares, female = triangles) among the B Control population (HRS); and C PF population); statistical test: generalized linear regression of sex-stratified median TL across racial/ethnic groups. R² (the coefficient of determination), RMSE (root mean squared error), and P value reported for each subgroup. D Shorter TL below the median (TL50) has greater prevalence with increasing age across all racial groups in the HRS control population (dashed lines), but this association was stronger in White and Black subjects with PF (solid lines). Subjects with PF (White n = 1613, Black, n = 162, Hispanic, n = 187, Asian, n = 70). Control subjects (White n = 4319, Black, n = 779, Hispanic, n = 614, Asian, n = 96). Other racial groups [n = 14] are not included in the graphs above. TL depicted are observed minus expected (O–E; age and gender-adjusted). Purple dotted line = fitted values for females and black dashed line = fitted values for males.
Fig. 5
Fig. 5. Racial differences in age-specific odds ratio (OR) for clinical predictors of respiratory impairment (y-axis) per quartile decrease in leukocyte telomere length (TL).
Data stratified by race/ethnicity (panels) and age group (x-axis) at diagnosis of pulmonary fibrosis. OR and P value (in parenthesis) depicted for White subjects—top left panel (red), Black subjects—top right panel (gray), Hispanic subjects—bottom left panel (orange), and Asian subjects—bottom right panel (green). Binomial logistic regression models were used to compute OR and to determine the significance of association (P < 0.05) of TL with clinical variables. OR displayed within the corresponding box (OR on top and P value in parentheses) and the adjacent bar scales the statistical significance of the odds likelihood. The color of each box represents the magnitude of the statistical significance (darker color = greater statistical significance; lighter color = lesser statistical significance). FVC forced vital capacity below 50% predicted; DLCO diffusing capacity of the lung for carbon monoxide below 50% predicted; MALE SEX male, IPF idiopathic pulmonary fibrosis, AUTOIMMUNE autoimmune-related interstitial lung disease.
Fig. 6
Fig. 6. Shorter leukocyte telomere length (TL) consistently predicts worse survival patterns in pulmonary fibrosis (PF).
A Scatter plot of mortality hazard ratios (HR)* in PF by transformed TL (negative log-transformed inverse of one minus percentile TL) comparing each centile of TL to the highest TL centile. The plot depicts increasing mortality hazard with shorter TL. B Survival stratified by age and gender-adjusted TL below the median (TL<50%) vs. above the median (TL≥50%) in the PF cohort. Unadjusted Cox proportional hazard ratio (HR) and 95% confidence interval of this estimate are depicted with its respective P value. Fixed effect mortality hazard estimates for quartiles of leukocyte telomere length (TLQ) adjusted for age, gender, FVC, DLCO, ILD subtype, and hospital center categorized by C PF subtype, and D race/ethnicity. HR depicted per quartile increase in TL. FVC forced vital capacity, DLCO diffusing capacity of the lungs, ILD interstitial lung disease, IPF idiopathic pulmonary fibrosis, n = 735; IPAF interstitial pneumonia with autoimmune features, n = 207; CTD-ILD connective tissue disease associated-ILD, n = 349; FHP fibrotic hypersensitivity pneumonitis, n = 422; unclassifiable/other ILD, n = 333. White n = 1613, Black n = 162, Hispanic n = 187, Asian n = 70, others n = 14, All patients n = 2046. The navy-blue boxes within the forest plot represent the point estimate for the mortality hazard ratio for each cohort, the thin horizontal line represents its 95% confidence interval, the vertical line is the line of no effect, and the diamond represents the overall effect estimate.
Fig. 7
Fig. 7. Shorter leukocyte telomere length consistently predicts worse survival.
A Kaplan–Meier survival curve according to age and gender-adjusted leukocyte telomere length in quartiles (TLQ). B Kaplan–Meier survival curves according to TLQ adjusted for age, gender, FVC, DLCO, ILD subtype, and hospital center. Cox proportional hazard ratio (HR) and 95% confidence interval of this estimate are depicted with its respective P value in each plot. FVC forced vital capacity, DLCO diffusing capacity of the lung for carbon monoxide, ILD interstitial lung disease.

Similar articles

Cited by

References

    1. Wijsenbeek M, Cottin V. Spectrum of fibrotic lung diseases. N. Engl. J. Med. 2020;383:958–968. doi: 10.1056/NEJMra2005230. - DOI - PubMed
    1. Krauss E, et al. Assessing the effectiveness of pirfenidone in idiopathic pulmonary fibrosis: long-term, real-world data from European IPF Registry (eurIPFreg) J. Clin. Med. 2020;9:3763. doi: 10.3390/jcm9113763. - DOI - PMC - PubMed
    1. Strongman H, Kausar I, Maher TM. Incidence, prevalence, and survival of patients with idiopathic pulmonary fibrosis in the UK. Adv. Ther. 2018;35:724–736. doi: 10.1007/s12325-018-0693-1. - DOI - PMC - PubMed
    1. Noth I, et al. Genetic variants associated with idiopathic pulmonary fibrosis susceptibility and mortality: a genome-wide association study. Lancet Respir. Med. 2013;1:309–317. doi: 10.1016/S2213-2600(13)70045-6. - DOI - PMC - PubMed
    1. Duckworth, A. et al. Telomere length and risk of idiopathic pulmonary fibrosis and chronic obstructive pulmonary disease: a mendelian randomisation study. Lancet Respir. Med. 9, 285–294 (2020). - PubMed

Publication types