. 2023 Mar;29(3):656-666.
doi: 10.1038/s41591-023-02221-x. Epub 2023 Mar 17.

Diagnostic classification of childhood cancer using multiscale transcriptomics

Affiliations

Diagnostic classification of childhood cancer using multiscale transcriptomics

Federico Comitani et al. Nat Med. 2023 Mar.

Abstract

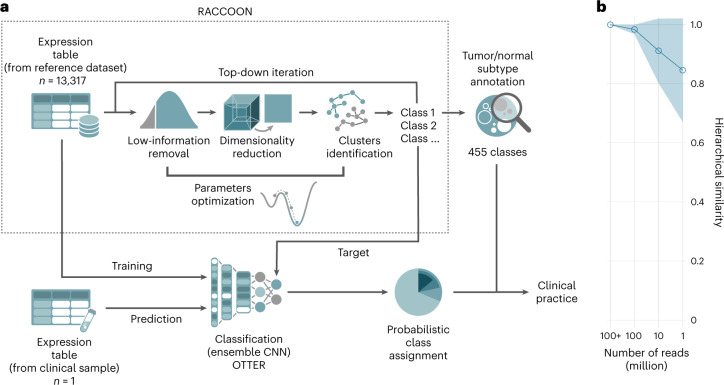
The causes of pediatric cancers' distinctiveness compared to adult-onset tumors of the same type are not completely clear and not fully explained by their genomes. In this study, we used an optimized multilevel RNA clustering approach to derive molecular definitions for most childhood cancers. Applying this method to 13,313 transcriptomes, we constructed a pediatric cancer atlas to explore age-associated changes. Tumor entities were sometimes unexpectedly grouped due to common lineages, drivers or stemness profiles. Some established entities were divided into subgroups that predicted outcome better than current diagnostic approaches. These definitions account for inter-tumoral and intra-tumoral heterogeneity and have the potential of enabling reproducible, quantifiable diagnostics. As a whole, childhood tumors had more transcriptional diversity than adult tumors, maintaining greater expression flexibility. To apply these insights, we designed an ensemble convolutional neural network classifier. We show that this tool was able to match or clarify the diagnosis for 85% of childhood tumors in a prospective cohort. If further validated, this framework could be extended to derive molecular definitions for all cancer types.


Conflict of interest statement

A.S. and F.C. report a filed patent application related to the use of transcriptional analysis to diagnose cancer and predict patient prognosis. The other authors declare no competing interests.

Figures

Fig. 1
Fig. 1. A platform for clustering and classification of RNA-seq data.
a, Schematic representation of the steps involved in our RNA-seq tumor subtype identification protocol. We first built an extensive reference hierarchy of tumor and normal subtypes using RACCOON, a novel scale-adaptive clustering framework. This hierarchy was then used as a target for OTTER, an ensemble of CNN classifiers, which can be employed to identify multiple tumor and normal tissue components in samples from clinical practice. b, OTTER performance as a function of the number of sequenced reads. This is quantified as the hierarchical similarity (Methods) between the prediction probabilities obtained on subsampled data and the original sample (>1 × 108 reads). Values are presented as mean and standard deviation of six tumor samples with reads randomly subsampled five times each. Expression counts were obtained with a STAR + RSEM pipeline.
Fig. 2
Fig. 2. Transcriptional atlas of cancer.
a, Two-dimensional UMAP projection of gene expression counts representative of the first level of hierarchy obtained with RACCOON on our reference tumor dataset, with classes drawn with different colors. For simplicity, only tumor subtypes are included in this representation. On the right is a legend including 27 transcriptional families identified at the first level of the hierarchy. For each class, full name, identification code, short name, number of member samples and number of subclasses are reported. b, PaWS scores measured on each of the main 27 transcriptional families. The marker size is proportional to the population of the cluster. This score quantifies the relative number of offspring for each class, adjusted by the population bias (see Methods for a formal definition). At the bottom are exemplary class hierarchical branches of three tumor types: neuroblastoma, ES and CNS tumors.
Fig. 3
Fig. 3. Expression entropy in childhood cancer.
a, Schematic representation of the steps involved in measuring transcriptional entropy. Given groups (g) of samples and their expression tables, entropy is first measured for each gene within each group. Entropies from all genes are then pooled to define a distribution. When needed, the median entropy across all genes is used as a single score. b, Median entropy (S, top) and MAD (bottom) distributions observed in healthy normal (in gray), adult tumor (in blue) and pediatric tumor (in orange) subtypes as identified by our multiscale clustering algorithm. Median values are reported as circles. The two-sided Mann–Whitney U-test P values between these distributions are also reported; pediatric tumors are overentropic (P = 3.12 × 10−17) and have significantly higher MAD (P = 4.32 × 10−9) than adult tumors. Labels point at the values for selected tumor classes of interest. c, Per-gene entropy distributions for each of the 26 main tumor classes. The genes are grouped by their DeepLIFT importance score, where the genes summing to the top 10% cumulative importance are shown in orange, and the rest are shown in blue. The separation between these distributions is significant (two-sided Mann–Whitney U-test P < 0.05) in all cases, except for lung, pancreas and squamous cell. d, Intra-class entropy differences between pediatric (left) and adult (right) samples, for a selected group of classes populated by samples with a mixed distribution of ages. The pediatric samples show significantly higher entropy across all cancer types (two-sided Mann–Whitney U-test P = 3.12 × 10−17), leukemias (P = 1.79 × 10−6) and sarcomas (P = 2.71 × 10−4). Significance is maintained after the removal of classes outside the population interquartile (P = 1.18 × 10−5).
Fig. 4
Fig. 4. Clusters of mesodermal tumors.
a, Two-dimensional UMAP projection of the mesodermal tumor classes by gene expression, highlighting the separation between high stemness (T003, in shades of orange) and low stemness (T002, in shades of green and blue) classes. b, The same map with samples colored by stemness score (left), immune activity score (center) and age (right). c, The same samples projected onto a set of single-cell datapoints from fetal bone tissue, showing how stem-high samples (T003) are more closely related to the embryonal tissue. d, Cosine distance of the centroids of mesodermal clusters from the fetal bone tissue obtained from a 50-dimensional (50-d) UMAP projection. e, Normalized stemness (top of each class, two-sided Mann–Whitney U-test P = 4.65 × 10−165) and immune activity (bottom of each class, two-sided Mann–Whitney U-test P = 3.28 × 10−102) score distributions for a subset of mesodermal tumor classes. f, Composition of T080, a class of sarcomas with high expression of immune markers, by diagnosis.
Fig. 5
Fig. 5. Subtyping of neuroblastoma and osteosarcoma.
Summary of the findings relating to neuroblastoma and osteosarcoma tumors. a, Two-dimensional UMAP projection of neuroblastoma subtypes by gene expression. b, Overall survival curves for the neuroblastoma subtypes, showing significant prognostic stratification (log-rank test P = 2.89 × 10−2). ce, The same projection but with samples colored as a function of immune infiltration (c), lineage (d) and normalized enrichment score (NES) of the expression pathway downstream to MYCN amplification (e). f, Distribution plots for the stemness (top of each class, Kruskal–Wallis test P = 8.10 × 10−13) and immune activity (bottom of each class, Kruskal–Wallis test P = 6.40 × 10−11) across neuroblastoma transcriptional subtypes. g, Cell lineage distributions grouped by neuroblastoma subtype (Kruskal–Wallis test P = 2.37 × 10−2). h, Normalized gene set enrichment score of genes expressed downstream to MYCN amplification, across neuroblastoma subtypes (top, GSEA one-sided hypergeometric test adjusted P = 2.26 × 10−13) and between samples in T064 clinically marked as MYCN amplified or not (GSEA adjusted P = 1.43 × 10−4). i, Two-dimensional UMAP projection of osteosarcoma subtypes. j, Overall survival time (OST) curves for the neuroblastoma subtypes, showing significant prognostic stratification (log-rank test (lrt); P = 5.56 × 10−5). k,l, Distributions of normalized gene set enrichment scores describing cartilage (k) and bone (l) development across the identified osteosarcoma subtypes. m, SP7 transcription factor expression distributions across osteosarcoma transcriptional subtypes.
Fig. 6
Fig. 6. Diagnostic classification of childhood tumours.
a,b, Classification scores obtained on the test set, broken down by hierarchy level (a) and by a subset of representative pediatric tumor classes (b). These include accuracy (dark blue), AUCPR (orange), precision (blue), recall (green) and hierarchical similarity H (dashed gray). All averaged scores were calculated as micro (m) averages. The total reference population of each class is also shown as shaded bars (blue). c, Classification results obtained with the KiCS validation dataset. In blue is the fraction of confirmed diagnoses in the absence of reference samples; in cyan are confirmed diagnoses; in orange are samples that led to an update in diagnosis; and in gray are inconclusive cases. The internal circle fractions indicate samples with normal tissue contamination (empty circles) or low quality (dotted circles). d, Majority class assignment for patients with samples taken at multiple timepoints. Each sample is shown as a dot, with size proportional to the class probability. The full circle represents the majority class at the first hierarchical level; bottom half circles in transparency show further subtypes. On the right, the name of the transcriptional family assigned to the first sample is shown in short form, except for those where normal contamination was dominant, in which case the next available sample is used. Samples with multiple separate primaries are not shown (Supplementary Fig. 11). e, Classification probabilities for neuroblastoma samples, grouped by their majority assignment. Larger bars represent the assignment to classes to the first level of the hierarchy; thinner bars represent the confidence scores of neuroblastoma subtypes. Samples for which MYCN amplification was clinically identified in a pre-therapy sample are marked with a red star. Pre-therapy samples are marked with a gray caret. The lineage score for each sample and their reference group median are shown at the bottom as dots and dashed line, respectively. f, Class assignment probabilities for osteosarcoma samples, grouped by their majority assignment. Larger bars represent the assignment to the osteosarcoma or alternative classes; thinner bars represent the confidence scores of osteosarcoma subtypes. Pre-therapy samples are marked with a gray caret.
Extended Data Fig. 1
Extended Data Fig. 1. Classifier scores by model, level, and transcriptional family.
Validation scores obtained by the randomized 5 × 5-fold validation. These include accuracy (dark blue), area under the curve precision-recall (AUCPR, orange), precision (blue) recall (green) and hierarchical similarity H (dashed grey). All averaged scores are calculated as micro (m) averages. The total reference population of each class is also shown as shaded bars (blue). These scores are shown per model in the ensemble (a), where the best model for each score is marked by a circle, per level (b), and per class, including only classes at the first level of the hierarchy (c). The ensemble reaches 0.955 5 × 5-fold validation median MAUCPR and 0.997 MF1 after calibration. In the per-level breakdown, MAUCPR goes from 0.998 for major tumor type classes, to 0.845 at its minimum for classes at the deepest level. The accuracy scores improve around level 7, due to the asymmetrical structure of the classes’ hierarchy. Only CNS and leukemias have subtypes extending beyond that level.
Extended Data Fig. 2
Extended Data Fig. 2. Pan-cancer hierarchy.
Hierarchical list of the clusters obtained with RACCOON on the reference tumor dataset. For each class, sex ratio, age distribution, code, population, and short name are shown. These clusters have been then used as target classes for the CNN classifier.
Extended Data Fig. 3
Extended Data Fig. 3. Hierarchy of all normal tissue classes.
Hierarchical list of the clusters obtained with RACCOON on the reference normal dataset. For each class, sex ratio, age distribution, code, population, and short name are shown. These clusters have been then used as target classes for the CNN classifier.
Extended Data Fig. 4
Extended Data Fig. 4. UMAP projection of normal tissue samples.
(a) 2d UMAP representation of the hierarchical branch of healthy normal tissue samples included in our study. Different families are shown with different colors. (b) Dendrogram representing the same hierarchy, showing the connection among different normal tissue subtypes. As for the neoplastic hierarchy, samples are first grouped by tissue with exceptions. For example, breast tissue samples with a majority population of adipose cells by histology are grouped with other adipose-rich samples (N030), while those with most mammary gland tissue are found with other glands (N008).
Extended Data Fig. 5
Extended Data Fig. 5. Entropy distribution Ewing and BCOR-rearranged sarcoma.
Comparison of gene entropy distributions for Ewing (top) and BCOR-rearranged (bottom) sarcoma clusters. genes summing to the bottom 99% of cumulative DeepLIFT importance score are shown in blue, while in orange are a selected subset of tumor-defining genes (EWSR1-FL1 targets as defined by Zhang et al. Cancer Res. 2005, and BCOR respectively). P values from the two-tailed Mann–Whitney U-test are shown.
Extended Data Fig. 6
Extended Data Fig. 6. Comparison between high stemness and high immune activity mesodermal tumors.
(a) stemness (top of each class) and immune activity (bottom of each class) scores distributions for the two main mesodermal tumor classes, T002 and T003. P values are from two-tailed Mann–Whitney U-tests. (b) Median normalized enrichment score for the top differentially regulated sets between T002 and T003 (GSEA one-sided hypergeometric test fdr < 0.001). (c) Tumor purity as a function of the stemness score across TCGA samples in T002 (in blue) and T003 (in orange). No correlation was found between the two values (Pearson’s correlation 0.15, two-tailed t-distribution p-val 8.64e-04). (d) Fractional immune cell type composition breakdown for tumor subtypes along the mesodermal hierarchy branches. These results were obtained with CIBERSORT and show a diversity of cell type abundances between the two groups.
Extended Data Fig. 7
Extended Data Fig. 7. BCOR- and CIC-mutated tumors.
Summary of the findings relating to BCOR-mutated and CIC-mutated tumors. (a) Two-dimensional UMAP projection of CNS tumors by gene expression, where a few representative classes are shown with shades of blue and green. The BCOR-mutated class is highlighted in orange (T031). (b) Diagram representing canonical BCOR-ITD and BCOR-CCNB3 rearrangements. (c) BCOR expression distribution across representative CNS classes, showing a clear overexpression in BCOR-mutated samples (T031). (d) The idiosyncratic transcriptional profile of BCOR mutations is sufficient to overcome the cell-of-origin attraction during the clustering process. The ratio of tumor types within T031, shows that while it is mostly composed of CNS tumors, sarcomas are also found in this class. (e) Two-dimensional UMAP projection of MESODM STEMhigh tumors by gene expression, where a few representative subtypes are shown with shades of blue and green. The CIC-mutated class is highlighted in orange (T104). (f) Diagram representing the archetypical CIC-DUX4 fusion. (g) MYC expression distribution across representative mesodermal classes, showing overexpression in T104. (h) As for BCOR-mutated samples, the ratio of tumor types within T104 shows a mixture of sarcomas and CNS tumors.
Extended Data Fig. 8
Extended Data Fig. 8. Neuroblastoma COX regression and clinical information.
(a) Cox survival regression hazard coefficients calculated on neuroblastoma samples for three main covariates: the transcriptional neuroblastoma subtypes, INSS stage and COG risk group. Log-likelihood ratio test P values are shown for each covariate. Stratification by MYCN status was also included in the regression but failed the proportional hazard assumption test (P value = 6.8e-3). All covariates influence positively the hazard ratio, both the COG risk group and the transcriptional subtypes (T063, T062, T065, T064) terms are significant COG risk group has the most impact on survival with a coefficient of 0.73, while the transcriptional subtype hazard ratio is 0.29. Our stratification maintains significance in the hazard regression after accounting for the most powerful prognostic factors, suggesting it can capture otherwise unexplained contributions to the survival behavior and supporting its novelty in prognostics. (b) Clinical information from neuroblastoma patient data and its stratification by transcriptional subtypes. Shown are the proportion of patients with the following characteristics (from top to bottom), COG risk group, ploidy number, diagnosis (neuroblastoma or ganglioneuroma), stage and MYCN status.
Extended Data Fig. 9
Extended Data Fig. 9. DNA repair pathways.
(a) Significantly enriched DNA repair pathways in pediatric cancers when compared to adult malignancies. The normalized enrichment scores were obtained with TMM-normalized expression pre-ranked GSEA. Only sets with one-sided hypergeometric test adjusted P value of less than 0.001 are shown. (b) Scatter plot showing values of median class entropy as a function of the DNA repair score (See Supplemental Methods for a definition). Adult classes are shown in blue, pediatric classes are shown in cyan. In red is the result of a linear regression, Pearson’s correlation coefficients and one-sided t-test P value are reported. The distributions of the DNA repair score for adult and pediatric samples are shown at the top, together with the two-sided Mann–Whitney U-test P value giving significance to their separation.

References

    1. Lam CG, Howard SC, Bouffet E, Pritchard-Jones K. Science and health for all children with cancer. Science. 2019;363:1182–1186. doi: 10.1126/science.aaw4892. - DOI - PubMed
    1. Miller RW, Young JL, Novakovic B. Childhood cancer. Cancer. 1995;75:395–405. doi: 10.1002/1097-0142(19950101)75:1+<395::AID-CNCR2820751321>3.0.CO;2-W. - DOI - PubMed
    1. Kattner P, et al. Compare and contrast: pediatric cancer versus adult malignancies. Cancer Metastasis Rev. 2019;38:673–682. doi: 10.1007/s10555-019-09836-y. - DOI - PubMed
    1. Janeway KA, Place AE, Kieran MW, Harris MH. Future of clinical genomics in pediatric oncology. J. Clin. Oncol. 2013;31:1893–1903. doi: 10.1200/JCO.2012.46.8470. - DOI - PubMed
    1. Filbin M, Monje M. Developmental origins and emerging therapeutic opportunities for childhood cancer. Nat. Med. 2019;25:367–376. doi: 10.1038/s41591-019-0383-9. - DOI - PMC - PubMed

Publication types

Grants and funding