. 2023 Mar 17;23(1):77.
doi: 10.1186/s12876-023-02717-3.

CT-based Hounsfield unit values reflect the degree of steatohepatitis in patients with low-grade fatty liver disease

Affiliations

CT-based Hounsfield unit values reflect the degree of steatohepatitis in patients with low-grade fatty liver disease

Ha Neul Kim et al. BMC Gastroenterol. .

Abstract

Background/aims: Nonalcoholic fatty liver disease (NAFLD) is the most common liver disease worldwide. Ultrasound, the most used tool for diagnosing NAFLD, is operator-dependent and shows suboptimal performance in patients with mild steatosis. However, few studies have been conducted on whether alternative noninvasive methods are useful for diagnosing mild hepatic steatosis. Also, little is known about whether noninvasive tests are useful for grading the severity of hepatic steatosis or the degree of intrahepatic inflammation. Therefore, we aimed to evaluate whether the HSI, the FLI and HU values in CT could be used to discriminate mild hepatic steatosis and to evaluate the severity of hepatic steatosis or the degree of intrahepatic inflammation in patients with low-grade fatty liver disease using liver biopsy as a reference standard.

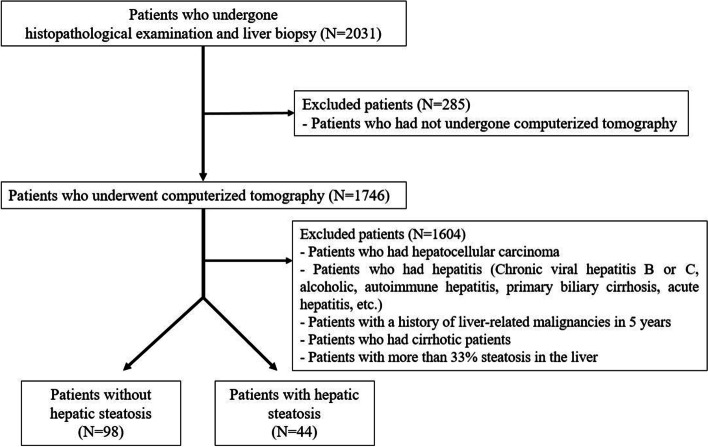
Methods: Demographic, laboratory, CT imaging, and histological data of patients who underwent liver resection or biopsy were analyzed. The performance of the HSI, HU values and the FLI for diagnosing mild hepatic steatosis was evaluated by calculating the area under the receiver operating characteristic curve. Whether the degree of hepatic steatosis and intrahepatic inflammation could be predicted using the HSI, HU values or the FLI was also analyzed. Moreover, we validate the results using magnetic resonance imaging proton density fat fraction as an another reference standard.

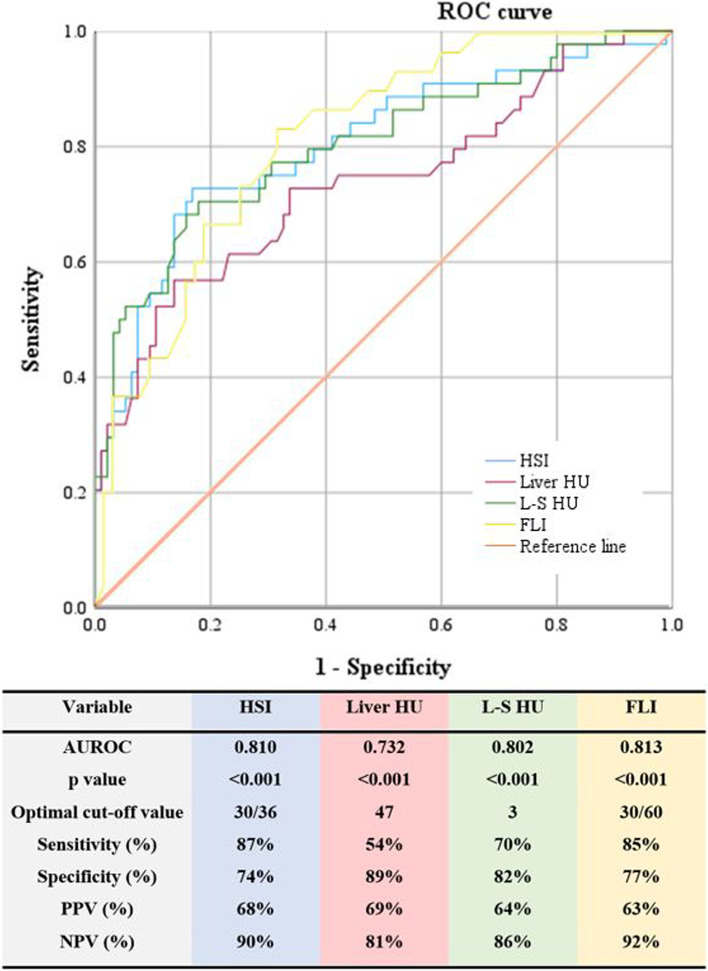
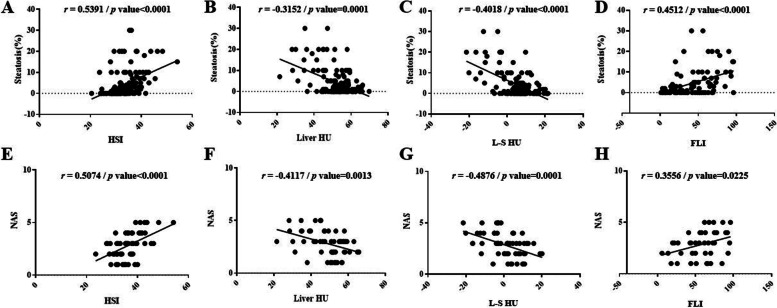
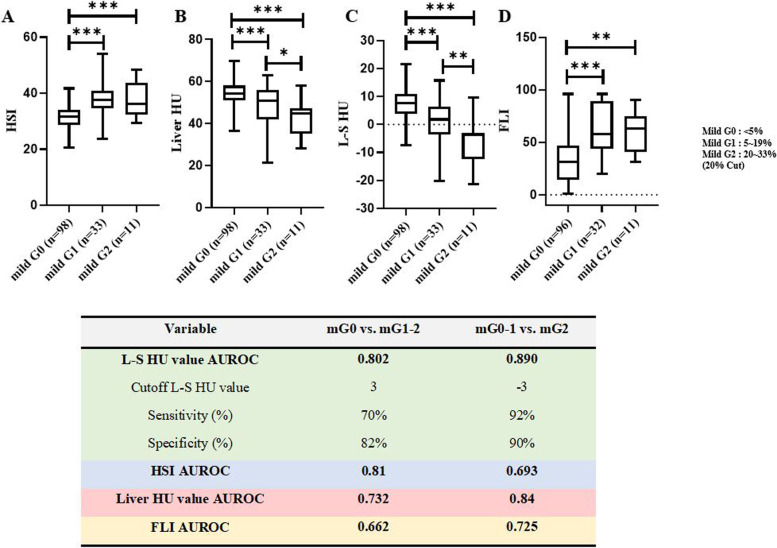
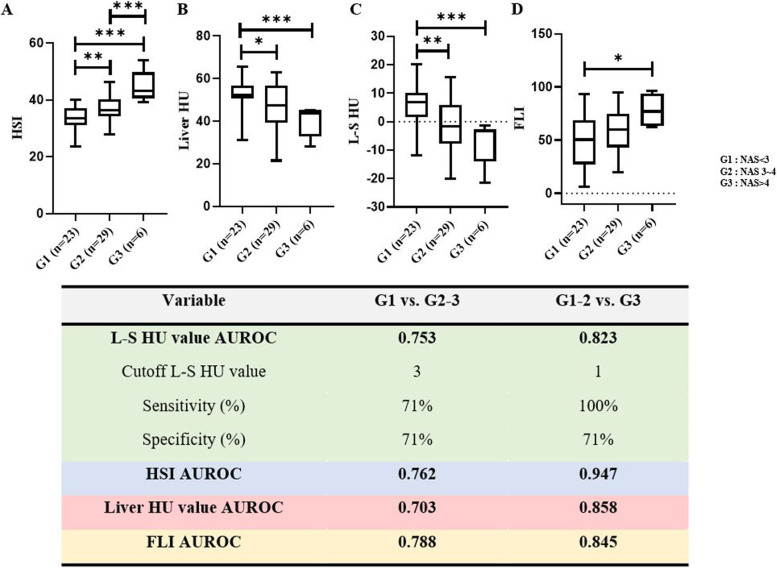
Results: The AUROC for diagnosing mild hepatic steatosis was 0.810 (p < 0.001) for the HSI, 0.732 (p < 0.001) for liver HU value, 0.802 (p < 0.001) for the difference between liver and spleen HU value (L-S HU value) and 0.813 (p < 0.001) for the FLI. Liver HU and L-S HU values were negatively correlated with the percentage of hepatic steatosis and NAFLD activity score (NAS) and significantly different between steatosis grades and between NAS grades. The L-S HU value was demonstrated the good performance for grading the severity of hepatic steatosis and the degree of intrahepatic inflammation.

Conclusions: The HU values on CT are feasible for stratifying hepatic fat content and evaluating the degree of intrahepatic inflammation, and the HSI and the FLI demonstrated good performance with high sensitivity and specificity in diagnosing mild hepatic steatosis.

Keywords: Hepatic steatosis; Hounsfield unit; Liver biopsy; Nonalcoholic fatty liver disease; Nonalcoholic steatohepatitis.


Conflict of interest statement

The authors declare that they have no competing interests.

Figures

Fig. 1
Fig. 1
Flow chart showing enrollment of patients who underwent liver biopsy or liver resection
Fig. 2
Fig. 2
ROC curves and diagnostic performance of hepatic steatosis index, liver HU value, liver HU value-spleen HU value and fatty liver index for diagnosing mild hepatic steatosis
Fig. 3
Fig. 3
The correlation between each index and the percentage of hepatic steatosis. A Scatter plots showing the positive correlation between the hepatic steatosis index and the percentage of hepatic steatosis (B) Scatter plots showing the negative correlation between liver HU value and the percentage of hepatic steatosis (C) Scatter plots showing the negative correlation between liver HU value-spleen HU value and the percentage of hepatic steatosis (D) Scatter plots showing the positive correlation between the fatty liver index and the percentage of hepatic steatosis (E) Scatter plots showing the positive correlation between the hepatic steatosis index and the NAFLD activity score (F) Scatter plots showing the negative correlation between liver HU value and the NAFLD activity score (G) Scatter plots showing the negative correlation between liver HU value-spleen HU value and the NAFLD activity score (H) Scatter plots showing the positive correlation between the fatty liver index the NAFLD activity score
Fig. 4
Fig. 4
The comparison of each index according to steatosis grade group and performance of each index in grading the severity of hepatic steatosis. A The comparison of hepatic steatosis index according to mild steatosis grade group. B The comparison of liver HU value according to mild steatosis grade group. C The comparison of liver HU value-spleen HU value according to mild steatosis grade group. D The comparison of fatty liver index according to mild steatosis grade group. Performance of hepatic steatosis index, liver HU value, liver HU value-spleen HU value and fatty liver index in grading the severity of hepatic steatosis was also shown. Mild G0 = Group consisting of patients with the percentage of hepatic steatosis < 5%; mild G1 = Group consisting of patients with the percentage of hepatic steatosis of ≥ 5% and < 20%; mild G2 = Group consisting of patients with the percentage of hepatic steatosis ≥ 20% and < 33%
Fig. 5
Fig. 5
The comparison of each index according to NAFLD activity score group and performance of each index in grading the severity of steatohepatitis. A The comparison of hepatic steatosis index according to NAFLD activity score group. B The comparison of liver HU value according to NAFLD activity score group. C The comparison of liver HU value-spleen HU value according to NAFLD activity score group. D The comparison of fatty liver index according to NAFLD activity score group. Performance of hepatic steatosis index, liver HU value, liver HU value-spleen HU value and fatty liver index in grading the severity of steatohepatitis was also shown. G1 = Group consisting of patients with the NAFLD activity score < 3; G2 = Group consisting of patients with the NAFLD activity score 3–4; G3 = Group consisting of patients with the NAFLD activity score > 4

Similar articles

Cited by

References

    1. Puri P, Sanyal AJ. Nonalcoholic fatty liver disease: Definitions, risk factors, and workup. Clin Liver Dis (Hoboken) 2012;1(4):99–103. doi: 10.1002/cld.81. - DOI - PMC - PubMed
    1. Chalasani N, Younossi Z, Lavine JE, Charlton M, Cusi K, Rinella M, Harrison SA, Brunt EM, Sanyal AJ. The diagnosis and management of nonalcoholic fatty liver disease: Practice guidance from the American Association for the Study of Liver Diseases. Hepatology. 2018;67(1):328–357. doi: 10.1002/hep.29367. - DOI - PubMed
    1. Younossi ZM, Koenig AB, Abdelatif D, Fazel Y, Henry L, Wymer M. Global epidemiology of nonalcoholic fatty liver disease-Meta-analytic assessment of prevalence, incidence, and outcomes. Hepatology. 2016;64(1):73–84. doi: 10.1002/hep.28431. - DOI - PubMed
    1. Williams VF, Taubman SB, Stahlman S. Non-alcoholic fatty liver disease (NAFLD), active component, U.S. Armed Forces, 2000–2017. Msmr. 2019;26(1):2–11. - PubMed
    1. Ekstedt M, Hagstrom H, Nasr P, Fredrikson M, Stal P, Kechagias S, Hultcrantz R. Fibrosis stage is the strongest predictor for disease-specific mortality in NAFLD after up to 33 years of follow-up. Hepatology. 2015;61(5):1547–1554. doi: 10.1002/hep.27368. - DOI - PubMed

MeSH terms