. 2023 Mar 17;22(1):52.
doi: 10.1186/s12943-023-01734-w.

SOX2 dosage sustains tumor-promoting inflammation to drive disease aggressiveness by modulating the FOSL2/IL6 axis

Affiliations

SOX2 dosage sustains tumor-promoting inflammation to drive disease aggressiveness by modulating the FOSL2/IL6 axis

Abdel Jelil Njouendou et al. Mol Cancer. .

Abstract

Background: Inflammation is undoubtedly a hallmark of cancer development. Its maintenance within tumors and the consequences on disease aggressiveness are insufficiently understood.

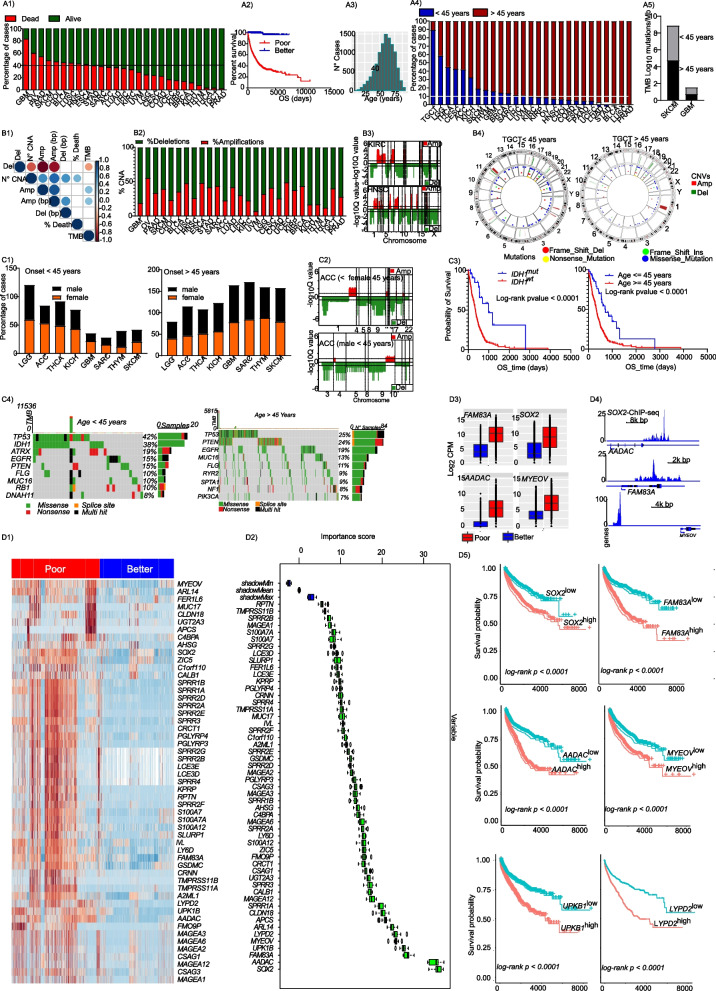
Methods: Data of 27 tumor entities (about 5000 samples) were downloaded from the TCGA and GEO databases. Multi-omic analyses were performed on these and in-house data to investigate molecular determinants of tumor aggressiveness. Using molecular loss-of-function data, the mechanistic underpinnings of inflammation-induced tumor aggressiveness were addressed. Patient specimens and in vivo disease models were subsequently used to validate findings.

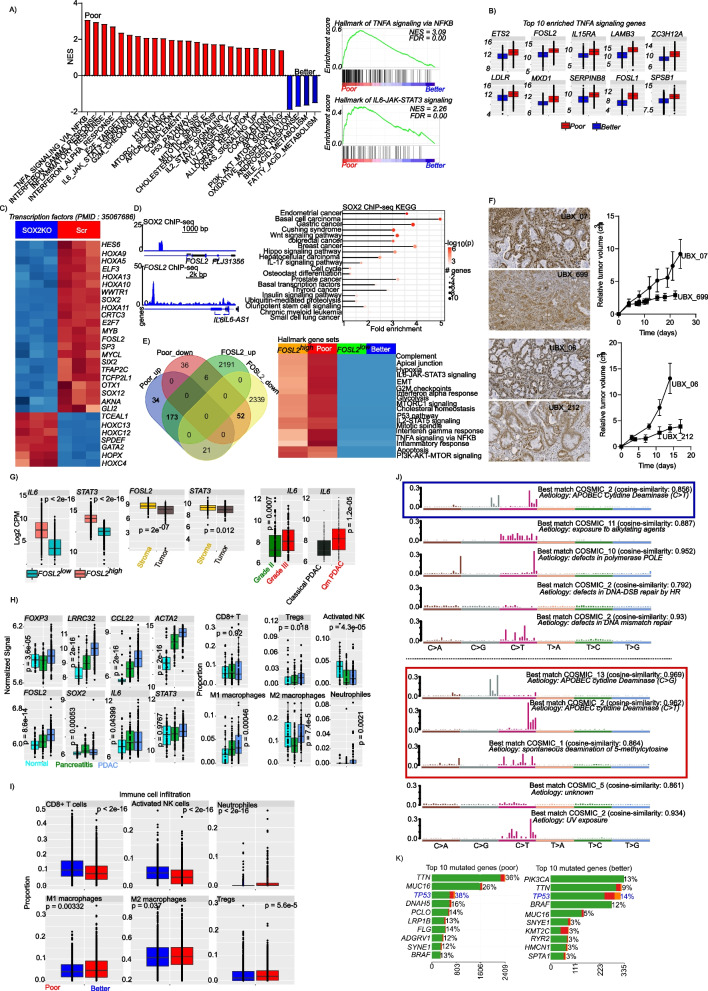
Results: There was significant association between somatic copy number alterations (sCNAs) and tumor aggressiveness. SOX2 amplification was the most important feature among novel and known aggressiveness-associated alterations. Mechanistically, SOX2 regulates a group of genes, in particular the AP1 transcription factor FOSL2, to sustain pro-inflammatory signaling pathways, such as IL6-JAK-STAT3, TNFA and IL17. FOSL2 was found overexpressed in tumor sections of specifically aggressive cancers. In consequence, prolonged inflammation induces immunosuppression and activates cytidine deamination and thus DNA damage as evidenced by related mutational signatures in aggressive tumors. The DNA damage affects tumor suppressor genes such as TP53, which is the most mutated gene in aggressive tumors compared to less aggressive ones (38% vs 14%), thereby releasing cell cycle control. These results were confirmed by analyzing tissues from various tumor types and in vivo studies.

Conclusion: Our data demonstrate the implication of SOX2 in promoting DNA damage and genome instability by sustaining inflammation via FOSL2/IL6, resulting in tumor aggressiveness.

Keywords: FOSL2; Gene expression; IL6; Inflammation; Mutational signatures; SOX2; Somatic copy number alterations; Tumor aggressiveness.


Conflict of interest statement

The authors declare that they have no competing interests.

Figures

Fig. 1
Fig. 1
Somatic copy number alterations are associated with cancer aggressiveness. (A1) A bar plot presenting the percentage of cancer-related casualties in 27 cancer entities from the TCGA. Each bar represent a cancer entity and the green color represent the percentage of all patients who were reported alive at the last follow-up, while the red bars represent the percentage of patients who were confirmed dead at the last follow-up. (A2) A Kaplan–Meier overall survival curve for patients from the first 10 poor outcome cancer entities (red) and the last 5 better outcome entities (blue) (from Fig. 1a1). The survival time represent the time from first diagnosis to last follow-up. (A3) A histogram showing age distribution across all analyzed 27 cancer entities from the TCGA. The average age at first diagnosis for all cancer entities analyzed was ~ 58 years with a standard deviation of ~ 13 years. (A4) A bar plot presenting the fraction of patients who were diagnosed with cancer before or after 45 years. The cut-off of 45 years represents the mean age at diagnosis minus one standard deviation around the mean. (A5) A bar plot showing the tumor mutational burden in two of the most aggressive entities, where more than 10% of cases were diagnosed before 45 years of age. (B1) A correlation plot showing the correlation between the percentage of dead cases per entity and copy number alterations (CNA) as well as tumor mutational burden (TMB). The number of identified CNA (N° CNA) as well as the number of deletions (Del) or amplifications (Amp) and the number of amplified (Amp bp) or deleted base pairs (Amp bp) are presented. (B2) A bar plot showing the percentage of amplifications or deletion in each of the 27 cancer entities. (B3) representative CNV plots demonstrating higher copy number deletion. (B4) A circus plot showing the copy number alterations and mutations in TGCT for patients diagnosed before (left panel) and after (right panel) 45 years of age. TGCT is the entity with the highest number of patients diagnosed before 45 years of age. (C1) Bar plots showing the percentage of male and female cases diagnosed before the age of 45 years, for all cancer entities with more than 10% of cases diagnosed before 45 years of age. Gender-specific entities are not included here. (C2) Gaia CNV plots for ACC in females and males diagnosed before the age of 45 years, respectively. ACC is one of the entities with higher incidence in females before 45 years of age. (C3) A Kaplan–Meier overall survival curve for glioblastoma patients with and without IDH1 mutation (left) and A Kaplan–Meier overall survival curve for glioblastoma patients diagnosed before and after the age of 45 years (right). (C4) An oncoprint showing the top 20 most mutated genes in glioblastoma in patients diagnosed before the age of 45 years and an oncoprint showing the top 20 most mutated genes in glioblastoma in patients diagnosed after the age of 45 years. (D1) A heat map showing all genes with copy number amplifications and concomitant upregulation (log fold change ≥ 0.9, FDR < 0.05) in the top 10 most aggressive tumors. (D2) A variable of importance box plot for all gene with copy number amplifications and concomitant upregulation in the top 10 most aggressive tumors. (D3) Boxplots showing the transcript expression of SOX2-regulated genes. These genes are copy number amplified in poor outcome cancer and show concomitant upregulation. (D4) Accumulation of SOX2 peaks around its targets genes amplified and upregulated in poor outcome cancers. (D5) Kaplan–Meier overall survival plots for the top most significant genes in the multivariate model
Fig. 2
Fig. 2
SOX2 promotes disease aggressiveness by enhancing inflammatory and oncogenic signaling via FOSL2. (A; left panel) A bar plot showing enriched hallmark gene sets in poor and better outcome cancers. Gene sets are considered to be enriched, if the show a false discovery rate of < 0.05. (A; right panel) Representative enrichment plot for pro-inflammatory hallmarks gene sets that are enriched in poor outcome cancers. (B) Boxplots showing the 10 most enriched gene from the hallmarks of TNFA signaling via NFKB. The hallmarks of TNFA signaling via NFKB was the most significantly enriched hallmark gene set in poor outcome cancers. (C) A heatmap showing the expression of significantly differentially expressed transcription factors upon SOX2 knockdown. (D; (left panel) SOX2 ChIP-sep peak profile showing enrichment around the FOSL2 gene (upper left panel) and FOSL2 ChIP-seq peaks around the IL6 gene (lower left panel) (IL6-JAK-STAT3 signaling is one of the top enriched hallmark gene sets in poor outcome cancers). (D; right panel) A pathway plot showing significantly enriched pathways in SOX2 ChIP-seq data. The ChIP-seq data was derived from the wildtype of the prostate cancer cell lines CWR-R1 and WA01. (E; left panel) A Venn diagram showing the intersection between upregulated and downregulated genes in poor out come and better outcome samples and between FOSL2high and FOSL2low samples. (E; right panel) A heatmap comparing enriched hallmark pathways in poor and better outcome cancers and FOSL2high and FOSL2low samples. FOSL2high and FOSL2low samples are samples with less than 1000 copies or more than 10,000 copies, respectively. This approach was used investigate if high expression of FOSL2 is related to the enriched hallmark gene sets seen in the poor outcome cancers. (F) FOSL2 staining of PAAD xenografts for fast and slow growing tumors (left panel) and tumor growth curves for the corresponding tumors (right panel). (G; left panel) Boxplots showing the expression of the proinflammatory cytokine IL6 and its downstream effector STAT3 in FOSL2 high and low tumors. FOSL2 high and low groups are the same as described above. (G; middle panel) Expression of FOSL2 and the proinflammatory mediator STAT3 in different compartments of PAAD tumors. Data is derived from laser microdissected (Maurer et al., 2019) PAAD tumors. The expression of IL6 was very low in majority of the cases and is not presented. (G; right panel) IL6 gene expression in grade II and grade III PAAD tumors (left panel) and in Qm and classical PAAD subtypes (right panel). Data was generated from resected PAAD samples. (H; left panel) Expression of inflammatory mediators and tumor microenvironment marker genes in normal pancreas (n = 41), chronic pancreatitis tissue (n = 59) and PAAD tissues n = 195). (H; right panel) Immune cell proportions derived from deconvolution of gene expression data from normal pancreas tissue, chronic pancreatitis tissue and PAAD tissue. Immune cell proportions were determined with CIBERSORT as implemented in TIMER. (I) Boxplots showing immune cell proportions in poor outcome vs better outcome cancers. (J) Top five mutational signatures in cancer entities with better outcome (upper panel) and poor outcome (lower panel). (K) Top ten most mutated genes in poor outcome cancers (left panel) and better outcome cancers (right panel)

References

    1. Kalimutho M, Nones K, Srihari S, Duijf PHG, Waddell N, Khanna KK. Patterns of genomic instability in breast cancer. Trends Pharmacol Sci. 2019;40(3):198–211. doi: 10.1016/j.tips.2019.01.005. - DOI - PubMed
    1. Negrini S, Gorgoulis VG, Halazonetis TD. Genomic instability–an evolving hallmark of cancer. Nat Rev Mol Cell Biol. 2010;11(3):220–228. doi: 10.1038/nrm2858. - DOI - PubMed
    1. Kornauth C, Pemovska T, Vladimer GI, Bayer G, Bergmann M, Eder S, et al. Functional precision medicine provides clinical benefit in advanced aggressive hematologic cancers and identifies exceptional responders. Cancer Discov. 2022;12(2):372–387. doi: 10.1158/2159-8290.CD-21-0538. - DOI - PMC - PubMed
    1. Marques C, Unterkircher T, Kroon P, Oldrini B, Izzo A, Dramaretska Y, et al. NF1 regulates mesenchymal glioblastoma plasticity and aggressiveness through the AP-1 transcription factor FOSL1. eLife. 2021;10. - PMC - PubMed
    1. Mueller S, Engleitner T, Maresch R, Zukowska M, Lange S, Kaltenbacher T, et al. Evolutionary routes and KRAS dosage define pancreatic cancer phenotypes. Nature. 2018;554(7690):62–68. doi: 10.1038/nature25459. - DOI - PMC - PubMed

Publication types