. 2023 Mar 18;22(1):55.
doi: 10.1186/s12943-023-01759-1.

Exosome-derived circCCAR1 promotes CD8 + T-cell dysfunction and anti-PD1 resistance in hepatocellular carcinoma

Affiliations

Exosome-derived circCCAR1 promotes CD8 + T-cell dysfunction and anti-PD1 resistance in hepatocellular carcinoma

Zongqiang Hu et al. Mol Cancer. .

Abstract

Background: Circular RNAs (circRNAs) can be encapsulated into exosomes to participate in intercellular communication, affecting the malignant progression of a variety of tumors. Dysfunction of CD8 + T cells is the main factor in immune escape from hepatocellular carcinoma (HCC). Nevertheless, the effect of exosome-derived circRNAs on CD8 + T-cell dysfunction needs further exploration.

Methods: The effect of circCCAR1 on the tumorigenesis and metastasis of HCC was assessed by in vitro and in vivo functional experiments. The function of circCCAR1 in CD8 + T-cell dysfunction was measured by enzyme-linked immunosorbent assay (ELISA), western blotting and flow cytometry. Chromatin immunoprecipitation, biotinylated RNA pull-down, RNA immunoprecipitation, and MS2 pull-down assays were used to the exploration of mechanism. A mouse model with reconstituted human immune system components (huNSG mice) was constructed to explore the role of exosomal circCCAR1 in the resistance to anti-PD1 therapy in HCC.

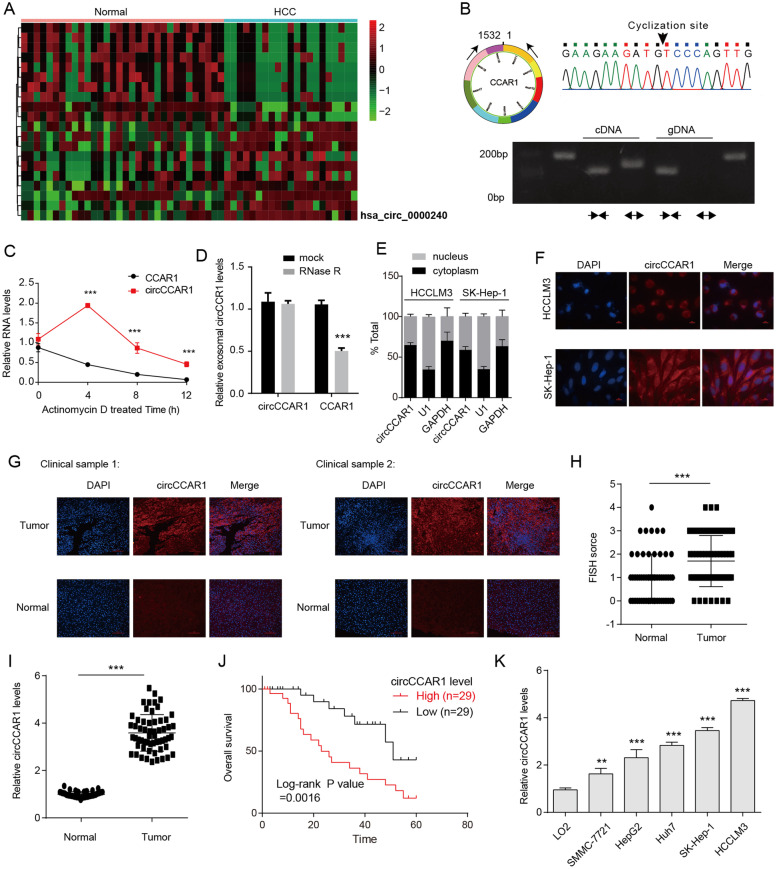
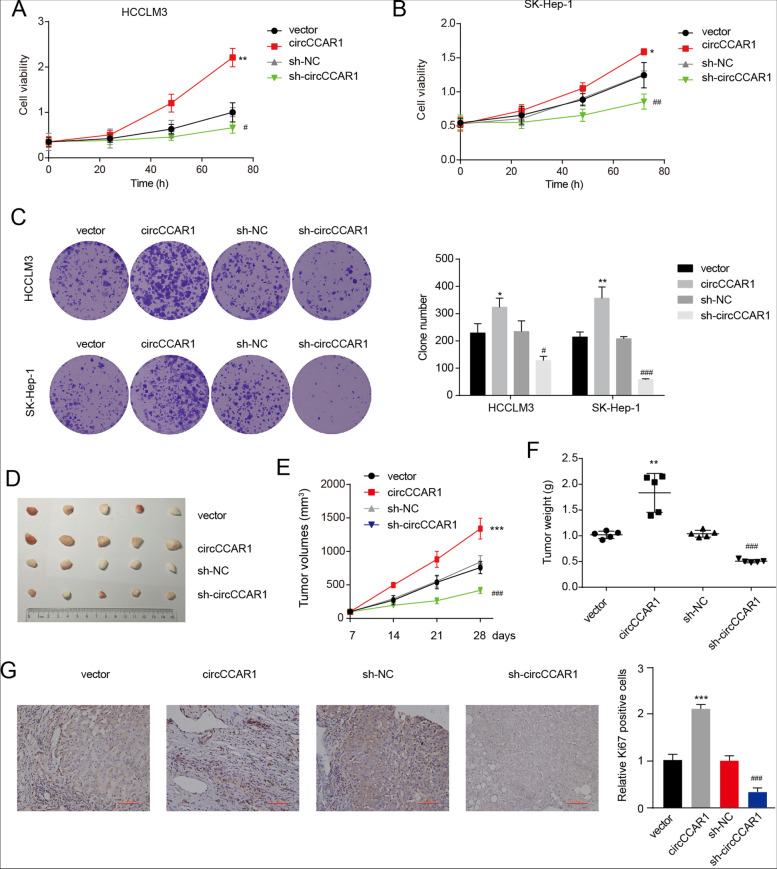
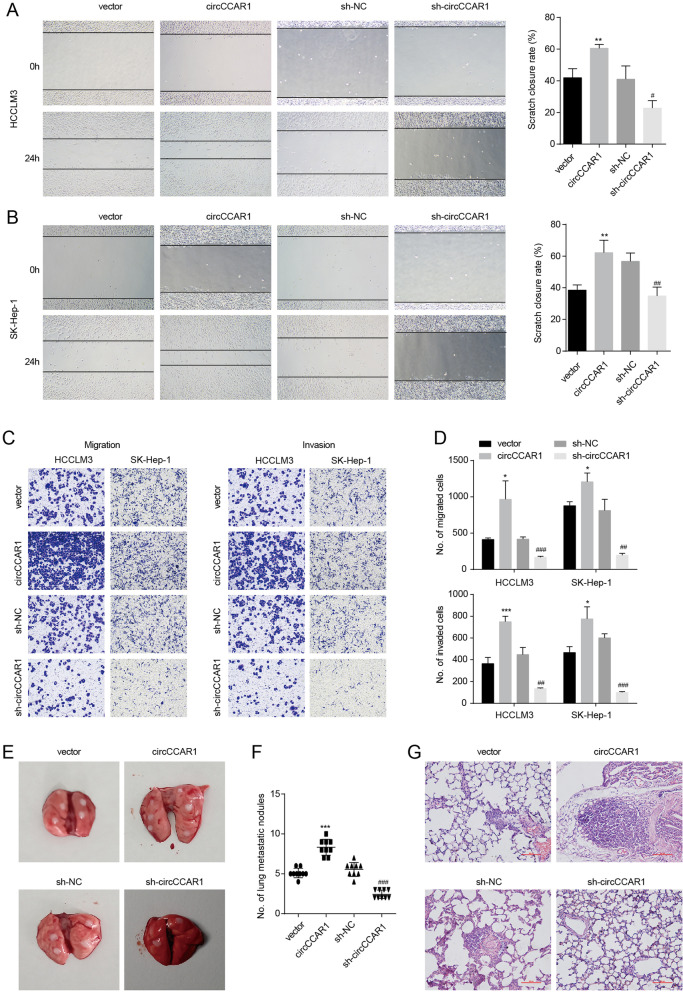
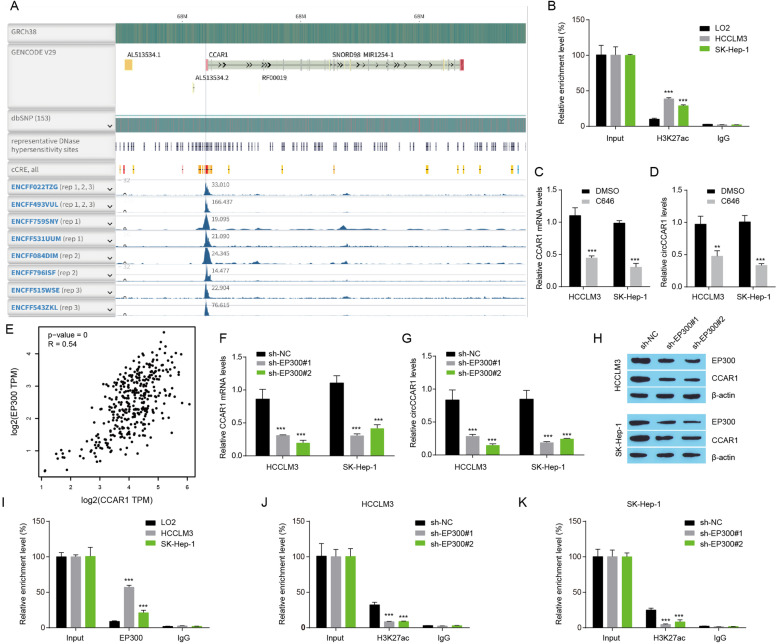
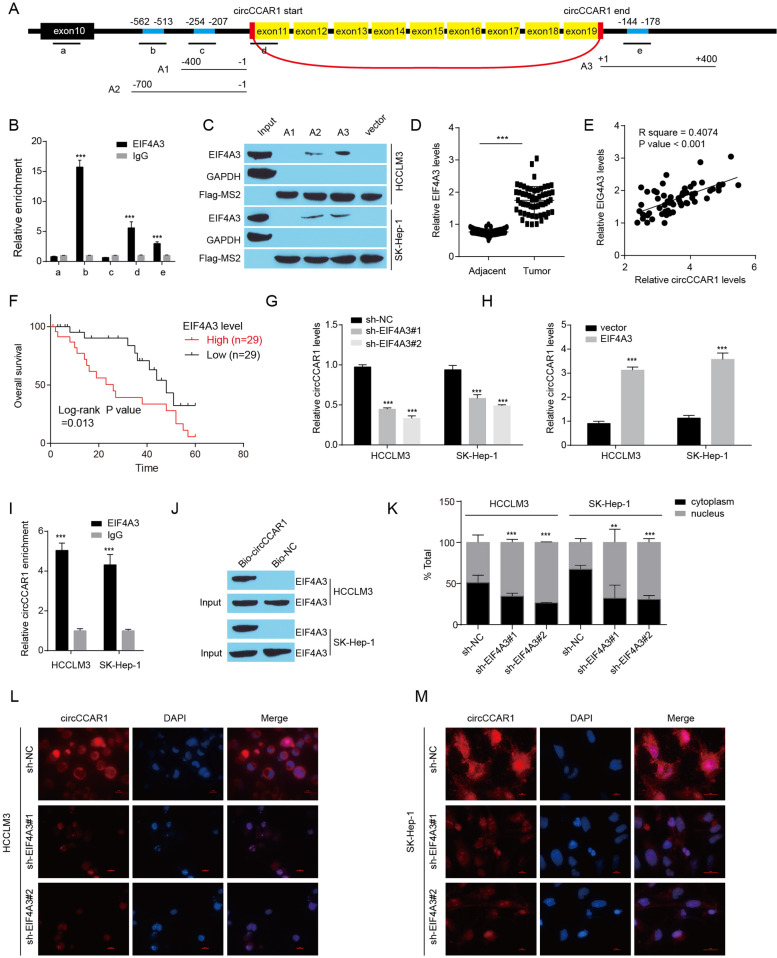
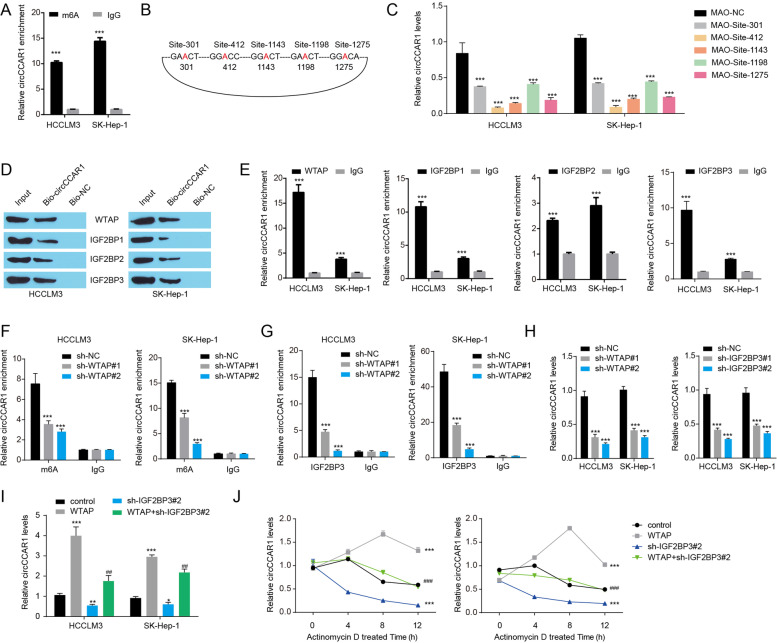
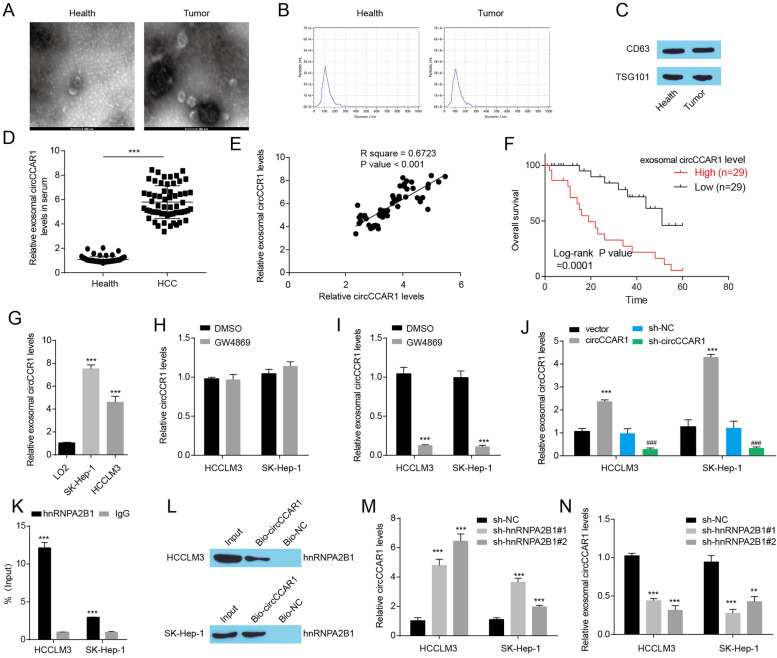
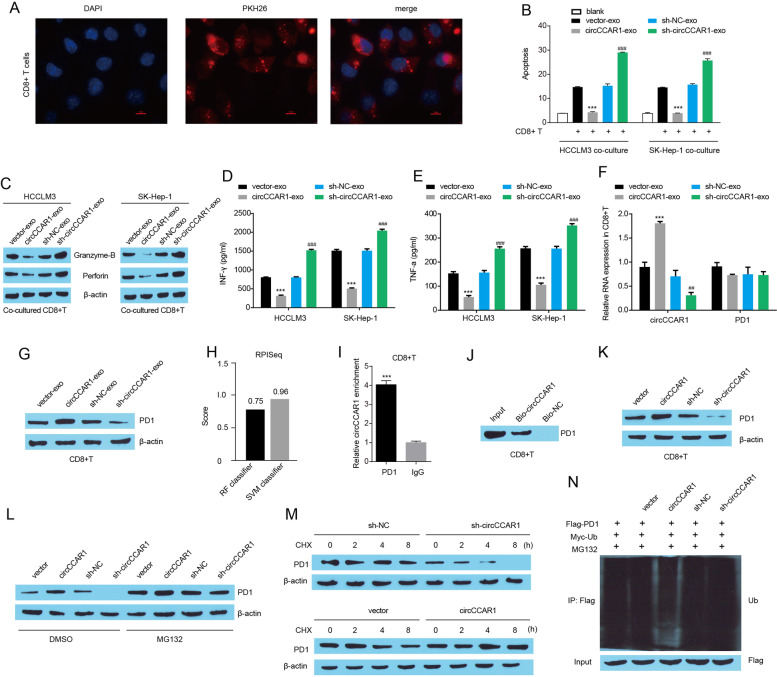
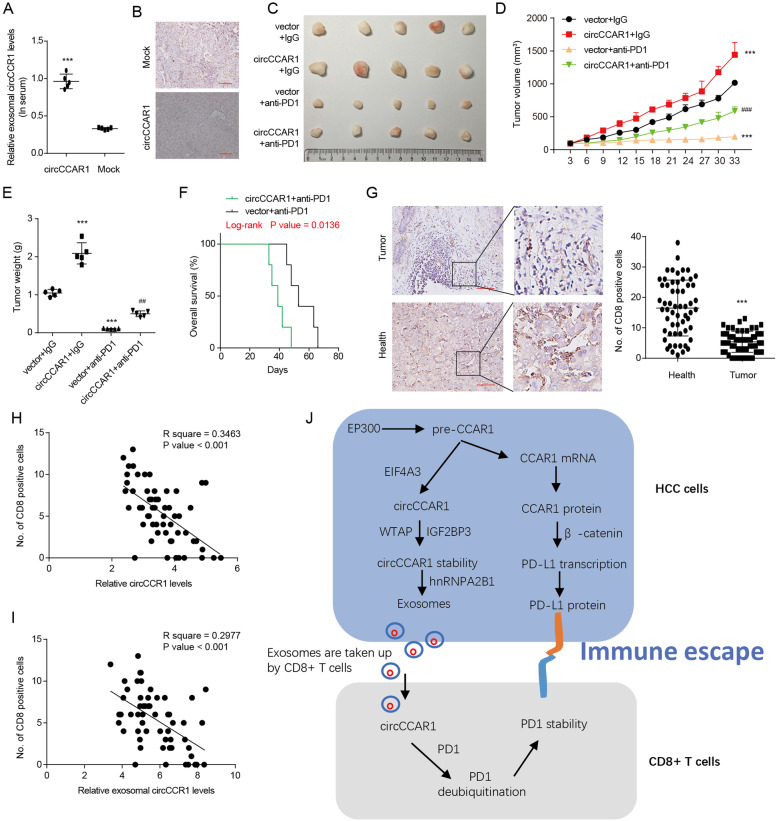
Results: Increased circCCAR1 levels existed in tumor tissues and exosomes in the plasma of HCC patients, in the culture supernatant and HCC cells. CircCCAR1 accelerated the growth and metastasis of HCC in vitro and in vivo. E1A binding protein p300 (EP300) and eukaryotic translation initiation factor 4A3 (EIF4A3) promoted the biogenesis of circCCAR1, and Wilms tumor 1-associated protein (WTAP)-mediated m6A modification enhanced circCCAR1 stability by binding insulin-like growth factor 2 mRNA-binding protein 3 (IGF2BP3). CircCCAR1 acted as a sponge for miR-127-5p to upregulate its target WTAP and a feedback loop comprising circCCAR1/miR-127-5p/WTAP axis was formed. CircCCAR1 is secreted by HCC cells in a heterogeneous nuclear ribonucleoprotein A2/B1 (hnRNPA2B1)-dependent manner. Exosomal circCCAR1 was taken in by CD8 + T cells and caused dysfunction of CD8 + T cells by stabilizing the PD-1 protein. CircCCAR1 promoted resistance to anti-PD1 immunotherapy. Furthermore, increased cell division cycle and apoptosis regulator 1 (CCAR1) induced by EP300 promoted the binding of CCAR1 and β-catenin protein, which further enhanced the transcription of PD-L1.

Conclusions: The circCCAR1/miR-127-5p/WTAP feedback loop enhances the growth and metastasis of HCC. Exosomal circCCAR1 released by HCC cells contributes to immunosuppression by facilitating CD8 + T-cell dysfunction in HCC. CircCCAR1 induces resistance to anti-PD1 immunotherapy, providing a potential therapeutic strategy for HCC patients.

Keywords: Anti-PD1; CCAR1; Exosome; Hepatocellular carcinoma; circRNA.


Conflict of interest statement

The authors declare no competing interests.

Figures

Fig. 1
Fig. 1
Screening and characterization of circCCAR1 in HCC. A The cluster heatmap shows the abnormal circRNAs in serum exosomes of healthy subjects and HCC patients. B A PCR assay with divergent primers was used to show the amplification of circCCAR1 from cDNA or genomic DNA (gDNA) of HCCLM3 cells. The back-splice junction sequences were verified by Sanger sequencing. C The stability of circCCAR1 and CCAR1 mRNA in HCCLM3 cells after actinomycin D treatment. ***p < 0.001 vs. CCAR1. D CCAR1 mRNA and circCCAR1 levels in HCCLM3 cells after RNase R digestion. ***p < 0.001 vs. mock. E The intracellular location of circCCAR1 in HCC cells was evaluated by a nuclear–cytoplasmic fractionation assay. F The intracellular location of circCCAR1 in HCC cells was evaluated by FISH. G Representative fluorescence images of circCCAR1 in HCC tissues and adjacent normal tissues were obtained by FISH. H The statistics for FISH. ***p < 0.001. I The level of circCCAR1 in HCC tissues and normal tissues was evaluated by qRT‒PCR assay. ***p < 0.001. J The association of circCCAR1 expression and overall survival in HCC patients. K The level of circCCAR1 in LO2 cells and HCC cell lines was measured. **p < 0.01, ***p < 0.001 vs. LO2
Fig. 2
Fig. 2
CircCCAR1 promotes HCC growth in vitro and in vivo. A-B A CCK-8 assay was conducted in HCC cells after circCCAR1 overexpression or depletion. *p < 0.05, **p < 0.01 vs. vector; #p < 0.05, ##p < 0.01 vs. sh-NC. C A colony formation assay was conducted in HCC cells after circCCAR1 overexpression or depletion. *p < 0.05, **p < 0.01 vs. vector; #p < 0.05, ###p < 0.001 vs. sh-NC. D Photograph of xenograft tumors (n = 5). E Growth curves of xenograft tumors. F Tumor weight was determined. G Ki67 staining of xenograft tumors. **p < 0.01, ***p < 0.001 vs. vector; ###p < 0.001 vs. sh-NC
Fig. 3
Fig. 3
CircCCAR1 promotes HCC metastasis in vitro and in vivo. A-B The migration capacity of HCC cells was evaluated by wound‐healing assays. C-D The migration and invasion abilities of HCC cells were evaluated using Transwell assays. E Gross observation of lung metastases in mice (n = 9). F The number of metastatic nodules was counted. G Lung sections were stained with H&E. *p < 0.05, **p < 0.01, ***p < 0.001 vs. vector; #p < 0.05, ##p < 0.01, ###p < 0.001 vs. sh-NC
Fig. 4
Fig. 4
EP300 knockdown inhibits circCCAR1 expression. A The H3K27ac signals in the CCAR1 promoter region in HepG2 cells were analyzed using ENCODE. B The H3K27ac signals in the CCAR1 promoter were measured using ChIP‒qPCR assay in LO2, HCCLM3 and SK-Hep-1 cells. ***p < 0.001 vs. LO2. C-D CCAR1 mRNA and circCCAR1 expression were measured by qRT‒PCR in HCC cells treated with C646 (10 μM) or DMSO for 48 h. **p < 0.01, ***p < 0.001 vs. DMSO. E Correlation analysis between EP300 and CCAR1 in TCGA liver hepatocellular carcinoma samples. F-G CCAR1 mRNA and circCCAR1 expression were detected after EP300 depletion. ***p < 0.001 vs. sh-NC. H EP300 and CCAR1 protein levels in HCC cells after EP300 depletion. I The EP300 signals in the CCAR1 promoter were measured using ChIP‒qPCR assays in LO2, HCCLM3 and SK-Hep-1 cells. ***p < 0.001 vs. LO2. J-K The H3K27ac signals in the CCAR1 promoter were measured using ChIP‒qPCR assays in HCC cells with EP300 silencing. ***p < 0.001 vs. sh-NC
Fig. 5
Fig. 5
EIF4A3 promotes the cyclization and cytoplasmic export of circCCAR1. A Five positions (a-e) in circCCAR1 pre-mRNA were selected to design qPCR primers, and three plasmids (A1-A3) containing EIF4A3 binding sites were constructed to pull down the EIF4A3 protein. B The interaction between EIF4A3 and circCCAR1 pre-mRNA was confirmed by RIP assay. ***p < 0.001 vs. IgG. C EIF4A3 protein was measured in the MS2-RNA pulldown complex. D EIF4A3 levels in HCC tissues and their paracancerous tissues were measured. ***p < 0.001. E The relationship between EIF4A3 and circCCAR1 levels in HCC samples was calculated. F The association of EIF4A3 expression and overall survival in HCC patients. G-H The expression of circCCAR1 in HCCLM3 and SK-Hep-1 cells with EIF4A3 depletion or overexpression. ***p < 0.001 vs. sh-NC or vector. I The binding of EIF4A3 and circCCAR1 was confirmed by RIP assay. ***p < 0.001 vs. IgG. J EIF4A3 protein level in pulldown assays using biotinylated antisense oligomer. K-M Nuclear–cytoplasmic fractionation and FISH-IF assays were used to assess the cytoplasmic export of circCCAR1 in HCC cells after EIF4A3 depletion. **p < 0.01, ***p < 0.001 vs. sh-NC
Fig. 6
Fig. 6
WTAP-mediated m6A modification enhanced circCCAR1 stability via IGF2BP3. A m6A enrichment in circCCAR1. ***p < 0.001 vs. IgG. B Diagram showing the position of m6A motifs with a high combined score within circCCAR1. C CircCCAR1 levels in HCC cells after treatment with MAO-circCCAR1 or MAO-NC. ***p < 0.001 vs. MAO-NC. D WTAP and IGFBPs levels in pulldown assays using a biotinylated antisense oligomer targeting the junction of circCCAR1. E The binding of IGF2BPs and circCCAR1 was confirmed by RIP assay. ***p < 0.001 vs. IgG. F The m6A enrichment in circCCAR1 in HCC cells after WTAP knockdown. ***p < 0.001 vs. sh-NC. G IGF2BP3 enrichment in circCCAR1 in HCC cells after WTAP knockdown. ***p < 0.001 vs. sh-NC. H CircCCAR1 levels in HCC cells after WTAP knockdown or IGF2BP3 knockdown. ***p < 0.001 vs. sh-NC. I CircCCAR1 levels in HCC cells after WTAP overexpression or IGF2BP3 knockdown. *p < 0.05, **p < 0.01, ***p < 0.001 vs. control; ##p < 0.01, ###p < 0.001 vs. sh-IGF2BP3#2. J Stability of circCCAR1 in HCC cells after WTAP overexpression or IGF2BP3 knockdown with actinomycin D treatment. ***p < 0.001 vs. control; ###p < 0.001 vs. sh-IGF2BP3#2
Fig. 7
Fig. 7
Exosomal circCCAR1 is increased in HCC patients. A Transmission electron microscopy detected the exosomes. B NanoSight particle tracking analysis of the size distributions and number of exosomes. C The levels of exosome markers (CD63 and TSG101) in purified exosomes. D The level of circCCAR1 in exosomes from the serum of HCC patients and healthy donors. ***p < 0.001. E The correlation between exosomal circCCAR1 in serum and circCCAR1 in tumor samples was assessed by Spearman correlation analysis. F The association of exosomal circCCAR1 levels and overall survival in HCC patients. G The level of circCCAR1 in exosomes in culture medium from LO2 cells and HCC cells. ***p < 0.001 vs. LO2. H-I The level of circCCAR1 in HCC cells or exosomes isolated from the supernatants of HCC cells treated with GW4869. ***p < 0.001 vs. DMSO. J The level of circCCAR1 in exosomes in HCC cells after circCCAR1 overexpression or depletion. ***p < 0.001 vs. vector; ###p < 0.001 vs. sh-NC. K The binding of circCCAR1 and hnRNPA2B1 was confirmed by RIP assay. ***p < 0.001 vs. IgG. L The binding of circCCAR1 and hnRNPA2B1 was confirmed by RNA pulldown assay. M The relative circCCAR1 expression in HCC cells after hnRNPA2B1 knockdown. N The relative circCCAR1 expression in exosomes after hnRNPA2B1 knockdown. ***p < 0.001 vs. sh-NC
Fig. 8
Fig. 8
Exosomal circCCAR1 protects HCC cells from CD8+ T cells by stabilizing PD-1. A Representative images of the internalization of PKH67-labeled HCCLM3 exosomes (red) by CD8 + T cells. B CD8 + T-cell-pretreated exosomes were cocultured with HCC cells, and then CD8 + T-cell-mediated elimination of HCC cells was determined by FACS analysis. ***p < 0.001 vs. vector-exo; ###p < 0.001 vs. sh-NC-exo. C Perforin and granzyme-B levels in CD8 + T cells. D-E Secreted IFN-γ and TNF-α by CD8 + T cells were measured by ELISA. ***p < 0.001 vs. vector-exo; ###p < 0.001 vs. sh-NC-exo. F circCCAR1 and PD1 mRNA expression in CD8 + T cells. ***p < 0.001 vs. vector-exo; ##p < 0.01 vs. sh-NC-exo. G PD1 protein expression in CD8 + T cells. H The interaction strength between circCCAR1 and PD1 was determined using the RPISeq program. I The binding of circCCAR1 and PD1 was confirmed by RIP assay. ***p < 0.001. J PD1 levels in pulldown assays using a biotinylated antisense oligomer targeting the junction of circCCAR1 in CD8 + T cells. K PD1 expression in CD8 + T cells after circCCAR1 depletion or overexpression. L PD1 protein levels in CD8 + T cells treated with MG132 after circCCAR1 depletion or overexpression. M Stability analysis of PD1 protein in CD8 + T cells treated with CHX after circCCAR1 depletion or overexpression. N Ubiquitination assay of PD1 in CD8 + T cells
Fig. 9
Fig. 9
CircCCAR1 promotes the resistance of HCC to anti-PD1 therapy. A Exosomal circCCAR1 levels in the serum from HuNSG mice. ***p < 0.001. B CD8-positive cells in HCCLM3-circCCAR1 or HCCLM3-mock cell-derived xenografts were detected by CD8 staining. C-E The tumor volume and weight. F The survival curves for mice with xenografts. G CD8 in tissues from HCC patients was analyzed by CD8 staining. ***p < 0.001. H The relationship between circCCAR1 and infiltrated CD8-positive cells in the HCC tissues was calculated. I The relationship between exosomal circCCAR1 in serum and CD8-positive cell numbers in HCC tissues was also calculated. J Model of the circCCAR1-mediated immunosuppressive effect in HCC

Similar articles

Cited by

References

    1. Singal AG, Lampertico P, Nahon P. Epidemiology and surveillance for hepatocellular carcinoma: New trends. J Hepatol. 2020;72:250–261. doi: 10.1016/j.jhep.2019.08.025. - DOI - PMC - PubMed
    1. Akinyemiju T, Abera S, Ahmed M, Alam N, Alemayohu MA, Allen C, Al-Raddadi R, Alvis-Guzman N, Amoako Y, Global Burden of Disease Liver Cancer C et al. The Burden of Primary Liver Cancer and Underlying Etiologies From 1990 to 2015 at the Global, Regional, and National Level: Results From the Global Burden of Disease Study 2015. JAMA Oncol. 2017;3:1683–1691. doi: 10.1001/jamaoncol.2017.3055. - DOI - PMC - PubMed
    1. Sharma P, Allison JP. Immune checkpoint targeting in cancer therapy: toward combination strategies with curative potential. Cell. 2015;161:205–214. doi: 10.1016/j.cell.2015.03.030. - DOI - PMC - PubMed
    1. El-Khoueiry AB, Sangro B, Yau T, Crocenzi TS, Kudo M, Hsu C, Kim TY, Choo SP, Trojan J, Welling THR, et al. Nivolumab in patients with advanced hepatocellular carcinoma (CheckMate 040): an open-label, non-comparative, phase 1/2 dose escalation and expansion trial. Lancet. 2017;389:2492–2502. doi: 10.1016/S0140-6736(17)31046-2. - DOI - PMC - PubMed
    1. Zhu AX, Finn RS, Edeline J, Cattan S, Ogasawara S, Palmer D, Verslype C, Zagonel V, Fartoux L, Vogel A, et al. Pembrolizumab in patients with advanced hepatocellular carcinoma previously treated with sorafenib (KEYNOTE-224): a non-randomised, open-label phase 2 trial. Lancet Oncol. 2018;19:940–952. doi: 10.1016/S1470-2045(18)30351-6. - DOI - PubMed

Publication types