. 2023 Apr 13;14(3):180-201.
doi: 10.1093/procel/pwac058.

Single-cell transcriptomic atlas of mouse cochlear aging

Affiliations

Single-cell transcriptomic atlas of mouse cochlear aging

Guoqiang Sun et al. Protein Cell. .

Abstract

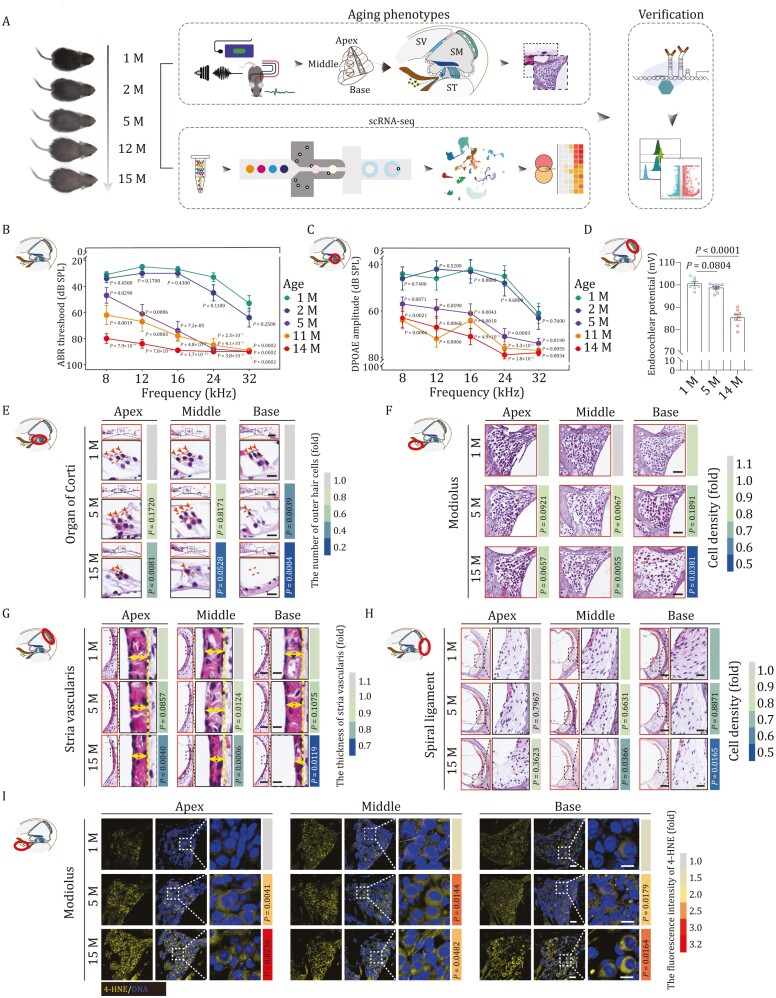
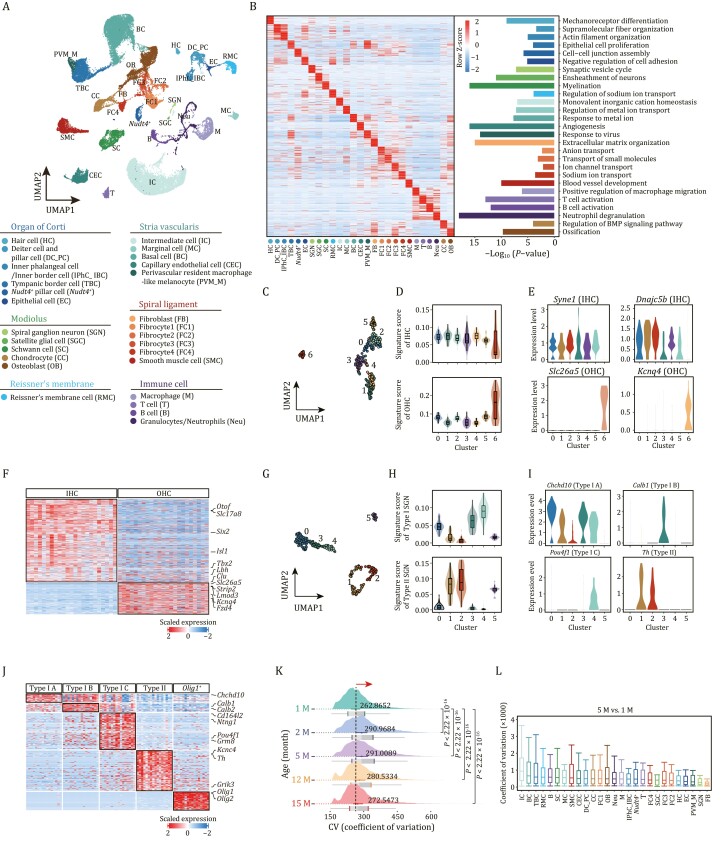
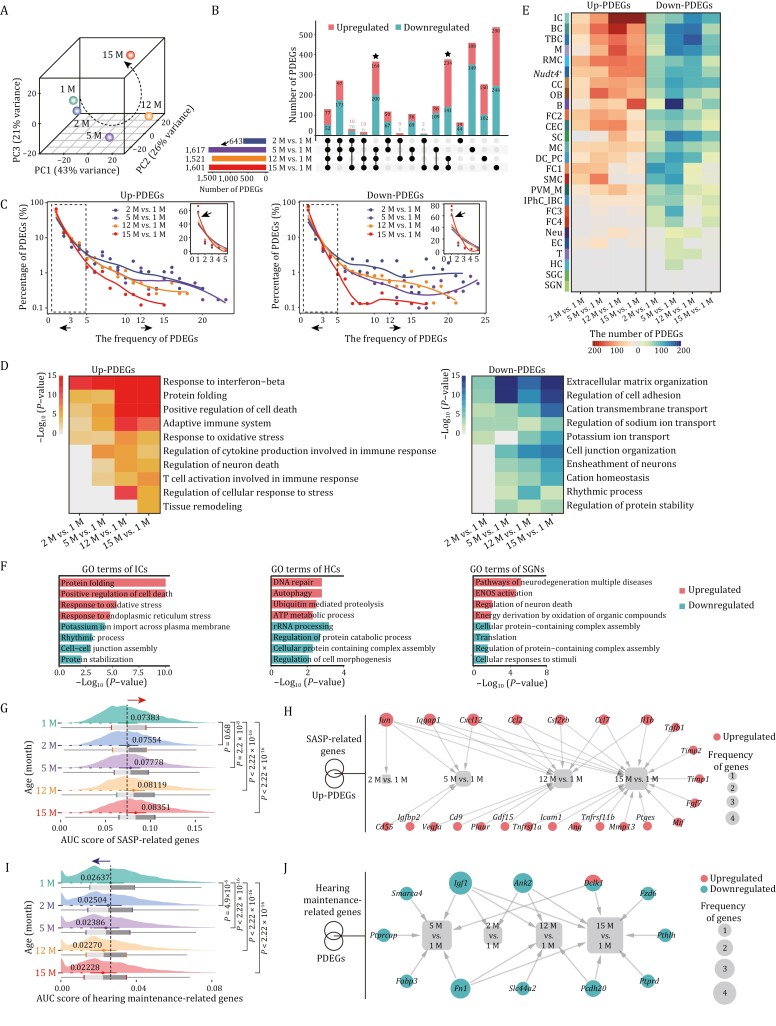
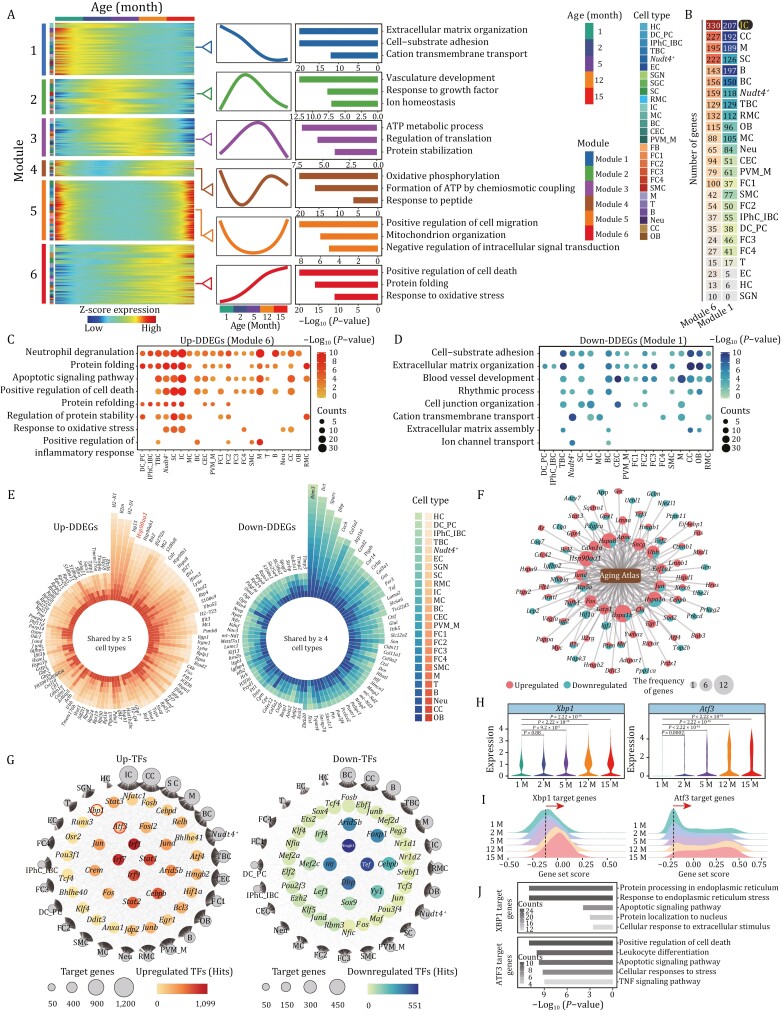
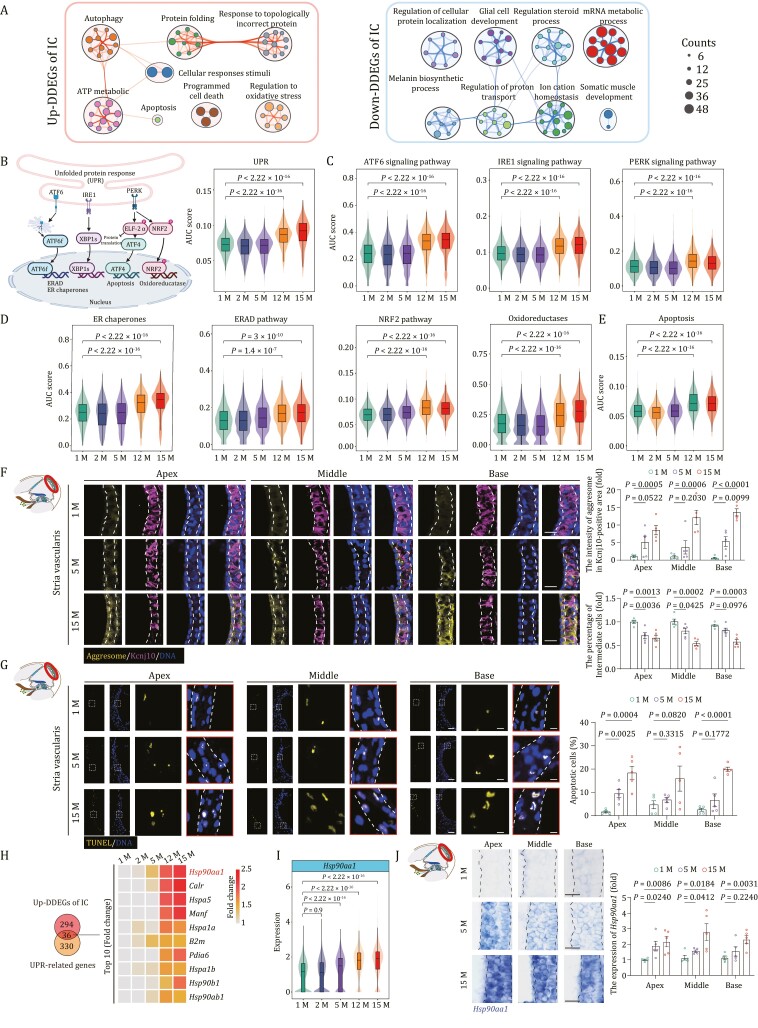
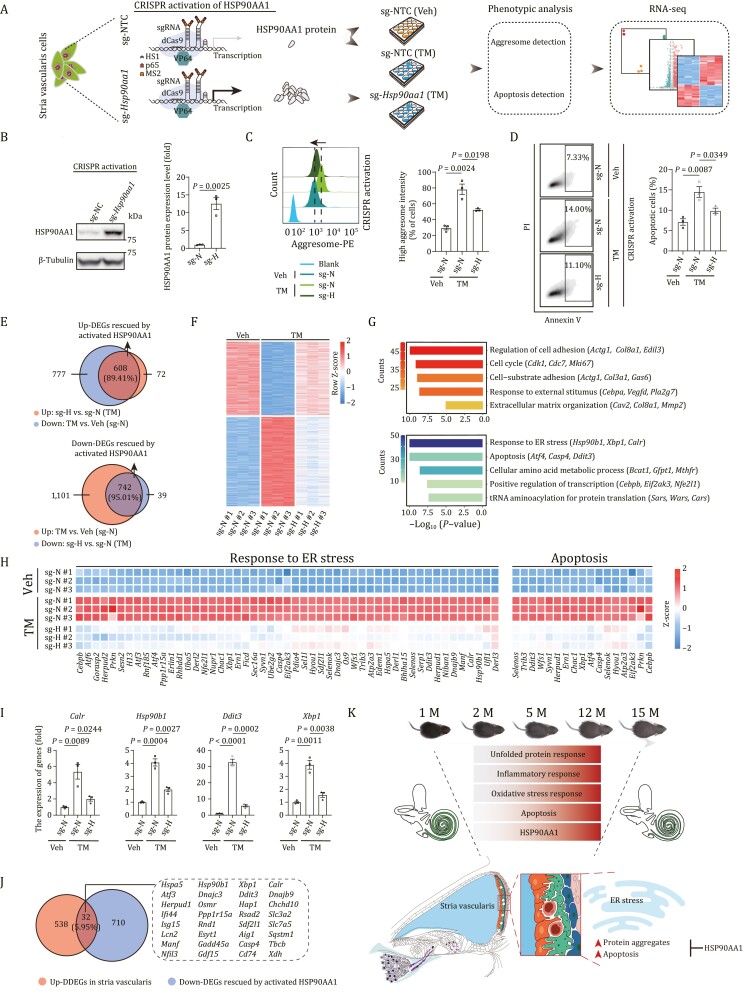
Progressive functional deterioration in the cochlea is associated with age-related hearing loss (ARHL). However, the cellular and molecular basis underlying cochlear aging remains largely unknown. Here, we established a dynamic single-cell transcriptomic landscape of mouse cochlear aging, in which we characterized aging-associated transcriptomic changes in 27 different cochlear cell types across five different time points. Overall, our analysis pinpoints loss of proteostasis and elevated apoptosis as the hallmark features of cochlear aging, highlights unexpected age-related transcriptional fluctuations in intermediate cells localized in the stria vascularis (SV) and demonstrates that upregulation of endoplasmic reticulum (ER) chaperon protein HSP90AA1 mitigates ER stress-induced damages associated with aging. Our work suggests that targeting unfolded protein response pathways may help alleviate aging-related SV atrophy and hence delay the progression of ARHL.

Keywords: aging; cochlea; mouse; single-cell transcriptomic atlas.


Conflict of interest statement

The authors declared no competing interests.

Figures

Figure 1.
Figure 1.
Aging-related phenotypes of mouse cochlea. (A) Diagram showing the procedure of aging phenotypical analysis, single cell RNA sequencing (scRNA-seq), and subsequent verification of molecular mechanism. Month, M; Scala Vestibuli, SV; Scala Media, SM; Scala Tympani, ST. (B and C) Line charts showing ABR (B) and DPOAE (C) thresholds of 1-, 2-, 5-, 11-, and 14-month-old mice in response to different frequencies. The ABR or DPAOE thresholds of 2-, 5-, 11-, and 14-month-old mice were compared with those of 1-month-old mice. The quantitative data are presented as the mean ± SEMs (n = 10 mice). Two-tailed Student’s t-test P-values were indicated. Month, M. (D) A recording of the endocochlear potential of 1, 5, and 14 months old mice (1 M, n = 8 mice; 5 M, n = 10 mice; 14 M, n = 8 mice). Data were shown as the mean ± SEMs. Two-tailed Student’s t-test P-values were indicated. Month, M. (E) H&E-staining of outer hair cells in the apical, middle, and basal turns of cochleae from 1-, 5-, and 15-month-old mice. Scale bars, 40 and 10 μm (zoomed-in images). The cell number was counted and quantified. The number of cells is quantified as fold changes relative to that of apical turn in 1-month-old cochlea (n = 5 mice). Two-tailed Student’s t-test P-values were indicated. Month, M. (F) H&E staining of modiolus in the apical, middle, and basal turns from 1-, 5-, and 15-month-old mouse cochleae. Scale bars, 40 μm. The cell density is quantified as fold changes relative to that of apical turn in 1-month-old cochlea (n = 5 mice). Two-tailed Student’s t-test P-values were indicated. (G) H&E staining of stria vascularis in the apical, middle, and basal turns of cochleae from 1-, 5-, and 15-month-old mice. Scale bars, 40 μm and 10 μm (zoomed-in images). The thickness of stria vascularis was counted and quantified as fold changes relative to that of apical turn in 1-month-old cochlea (n = 5 mice). Two-tailed Student’s t-test P-values were indicated. (H) H&E staining of spiral ligament in the apical, middle, and basal turns of cochleae from 1-, 5-, and 15-month-old mice. Scale bars, 80 and 20 μm (zoomed-in images). The apical, middle, and basal spiral ligament cell density were counted and quantified as fold changes relative to that of apical turn in 1-month-old cochlea (n = 5 mice). Two-tailed Student’s t-test P-values were indicated. (I) 4-HNE immunofluorescence staining showed elevated intensity of 4-HNE in 5- or 15-month-old mice compared with that in 1-month-old mice. Scale bars, 40 and 10 μm (zoomed-in images). The relative intensity is quantified as fold changes relative to that of apical turn in 1-month-old cochlea (n = 5 mice). Two-tailed Student’s t-test P-values were indicated.
Figure 2.
Figure 2.
Establishment of single-cell transcriptome landscape of mouse cochlea. (A) Top, UMAP plot showing the distribution of different cell types in cochlea. Bottom, the annotation of different cell types. HC, Hair cell; DC_PC, Deiter cell and pillar cell; IPhC_IBC, Inner phalangeal cell/inner border cell; TBC, Tympanic border cell; Nudt4+, Nudt4+ pillar cell; EC, Epithelial cell; SGN, Spiral ganglion neuron; SGC, Satellite glial cell; SC, Schwann cell; RMC, cells in Reissner’s membrane; IC, Intermediate cell; MC, Marginal cell; BC, Basal cell; CEC, Capillary endothelial cell; SMC, Smooth muscle cell; PVM_M, Perivascular resident macrophage-like melanocyte; FB, fibroblast; FC1, Fibrocyte 1; FC2, Fibrocyte 2; FC3, Fibrocyte 3; FC4, Fibrocyte 4; T, T cell; B, B cell; M, Macrophage; Neu, Granulocyte/neutrophil; CC, Chondrocyte; OB, Osteoblast. (B) Left, heatmap showing row z-score expression signatures of top 50 cell-type-specific genes. Right, representative Gene Ontology (GO) terms for marker genes. (C) UMAP plot showing the distribution of subclusters of HCs. (D) Violin and box plots showing the gene set scores of IHC (top) or OHC (bottom) signature genes in different subpopulations of HCs. Boxes show the medians and the quartile ranges (25%–75%), while the lengths of the whiskers represent 1.5× the IQR. (E) Violin plots showing the expression levels of select marker genes that are differentially expressed in IHCs and OHCs. Syne1 and Dnajc5b mark the IHCs. Slc26a5 and Kcnq4 mark the OHCs. (F) Heatmap showing the gene expression signatures of IHCs and OHCs. (G) UMAP plot showing the distribution of subclusters of SGNs. (H) Violin and box plots showing the gene set score of type I (top) or II (bottom) signature genes in different subpopulations of SGN. Boxes show the medians and the quartile ranges (25%–75%), while the lengths of the whiskers represent 1.5× the IQR. (I) Violin plots showing the expression levels of selected marker genes that are differentially expressed in types I and II SGN. (J) Heatmap showing the gene expression signatures of SGN subtypes. (K) Ridge plot showing the shift of CV of cochlear cells with age. P values by Wilcoxon test are indicated. (L) Box plot showing the CV of each cell type at 5-month-old compared to that of 1-month-old. Box shows the median and the quartile range (25%–75%) and the length of whiskers represents 1.5× the IQR.
Figure 3.
Figure 3.
Pairwise differential expression analysis reveals cell type-specific temporal signatures during cochlear aging. (A) Principal component analysis (PCA) of cochlear single-cell transcriptome data from each age group. (B) Upset plot showing the numbers of age-unique and shared PDEGs for pairwise comparisons between different age groups. (C) The smooth line plots showing the expression patterns of the frequency and percentage of the upregulated (left) and downregulated (right) PDEGs between 2, 5, 12, 15 months old and 1 month old, individually. Insets show the zoomed-in view of the region highlighted by a dashed line to the left. The arrows pointing to the left represent the PDEGs with a frequency less than 3, and the arrows to the right represent the PDEGs with a frequency more than 12. (D) Representative GO terms of upregulated PDEGs (left) and downregulated PDEGs (right) across four pairwise comparisons between different age groups. (E) Heatmap showing the number of upregulated (left) and downregulated PDEGs (right) of each cell types between 2, 5, 12, 15 months old and 1 month old, respectively. (F) Representative GO terms of total PDEGs in ICs (left), HCs (middle) and SGNs (right). (G) Ridge plot showing the AUC score of SASP-related genes in cochlear cells from 1-, 2-, 5-, 12-, and 15-month-old mice. (H) Network plot showing the upregulated PDEGs overlapped with genes from SASP gene set. The node size indicates the frequency of PDEGs appeared across four pairwise comparisons. (I) Ridge plot showing the AUC score of hearing maintenance-related genes in cochlear cells from 1-, 2-, 5-, 12-, and 15-month-old mice. (J) Network plot showing the PDEGs overlapped with hearing maintenance-related genes. The node size indicates the frequency of PDEGs appeared across four pairwise comparisons.
Figure 4.
Figure 4.
Dynamic differential expression analysis uncovers transcriptional signatures during cochlear aging. (A) Heatmaps showing dynamic DEGs (DDEGs) with six different expression patterns. The corresponding gene expression trajectories and representative GO terms are shown in the middle and right panels. (B) Heatmap showing the number of upregulated DDEGs (module 6) and downregulated DDEGs (module1) in each cell type. (C and D) Representative GO terms of upregulated DDEGs (module 6) (C) and downregulated DDEGs (module 1) (D) in the different cochlear cell types. Count indicates gene number. (E) Plots showing the upregulated DDEGs (left) shared by at least five cell types and downregulated DDEGs (right) shared by at least four cell types. (F) Network plot showing the upregulated and downregulated DDEGs overlapped with genes annotated in Aging Atlas database. The node size indicates the frequency of DDEGs appeared across different cell types. (G) Network visualization of upregulated (left) and downregulated (right) core regulatory transcription factors (TFs) across all cell types during cochlear aging. Outer nodes represent different cell types, and the size of outer nodes indicates the number of target genes involved in this cell type. (H) Violin plots showing the expression levels of core transcription factors Xbp1 and Atf3 in 1-, 2-, 5-, 12-, and 15-month-old mouse cochleae. (I) Ridge plots showing the gene set scores of Xbp1 and Atf3 target genes in 1-, 2-, 5-, 12-, and 15-month-old mouse cochleae. (J) Representative GO terms enriched for XBP1 target genes (top) and ATF3 target genes (bottom). Count indicates gene number.
Figure 5.
Figure 5.
Transcriptional profiles of intermediate cells during aging. (A) Network graph visualizing representative GO terms and pathways of upregulated DDEGs (left) and downregulated DDEGs (right) in intermediate cells. The size of the node is proportional to the total number of hits that fall into that specific term. Two terms with similarity > 0.3 are connected by a line. (B) Left, a schematic showing three principal branches and corresponding core components in the UPR pathway. Right, Violin and box plot showing the gene set scores of UPR pathway in intermediate cells across different time points. Box shows the median and the quartile range (25%–75%) and the length of whiskers represents 1.5× the IQR. P values by Wilcoxon test are indicated. (C) Violin and box plots showing the gene set scores of ATF6, IRE1, and PERK signal pathways in intermediate cells from 1-, 2-, 5-, 12-, and 15-month-old mice. (D) Violin and box plots showing the gene set scores of ER chaperones, ERAD and NRF2 pathways, oxidoreductases in intermediate cells from 1-, 2-, 5-, 12-, and 15-month-old mice. (E) Violin and box plot showing the gene set scores of apoptosis in intermediate cells from 1-, 2-, 5-, 12-, and 15-month-old mice. (F) Co-staining of aggresome and Kcnj10 in the 1-, 5-, and 15-month-old cochlear samples. Scale bars, 20 μm. The relative intensity of aggresomes in Kcnj10-positive areas and the relative number of Kcnj10-positive cells are quantified as fold changes and presented as the mean ± SEMs (n = 5 mice). Two-tailed Student’s t-test P values were indicated. (G) TUNEL staining in the 1-, 5-, and 15-month-old cochlear samples. Scale bars, 20 and 5 μm (zoomed-in images). The percentage of apoptotic cells was presented as the mean ± SEMs (n = 5 mice). Two-tailed Student’s t-test P-values were indicated. (H) Left, Venn diagram showing an overlap between upregulated DDEGs in intermediate cells and UPR-related genes. Right, heatmap showing the expression levels of the top 10 (accumulated fold changes) overlapping genes. (I) Violin and box plot showing the expression levels of Hsp90aa1 in intermediate cells from 1-, 2-, 5-, 12-, and 15-month-old mice. (J) RNA-ISH of Hsp90aa1 in cochlear SV from 1-, 5-, and 15-month-old mice. Representative images are shown on the left; the relative intensity of Hsp90aa1 is quantified as fold changes relative to that of apical turn in 1-month-old cochlea (n = 5 mice). Two-tailed Student’s t-test P-values were indicated. The values are shown as mean ± SEMs on the right. Scale bars, 20 μm. Month, M.
Figure 6.
Figure 6.
Activation of HSP90AA1 prevents loss of proteostasis and alleviates apoptosis in stria vascularis cells. (A) Schematic of CRISPR-dCas9 transcriptional activation system-based HSP90AA1 activation and phenotypic and mechanism analysis. NTC, non-targeting control. Veh, vehicle; TM, Tunicamycin. (B) Western blot and band intensity quantification of HSP90AA1 protein levels in stria vascularis cells (SV-K1) transduced with non-targeting or Hsp90aa1-targeting sgRNA. Data are presented as the mean ± SEMs, n = 3 biological repeats. Two-tailed Student’s t-test P-value was indicated. Representative data from one of the three independent experiments. sg-N, sg-NTC; sg-H, sg-Hsp90aa1. (C) Left, aggresome intensity analysis of stria vascularis cells transduced with non-targeting or Hsp90aa1-targeting sgRNA after treatment with vehicle or tunicamycin. Right, data are presented as mean ± SEMs, n = 3 biological repeats. Two-tailed Student’s t-test P-values were indicated. Representative data from one of the three independent experiments. (D) Left, apoptosis analysis of stria vascularis cells transduced with non-targeting or Hsp90aa1-targeting sgRNA after treatment with vehicle or TM. Right, the percentages of apoptotic cells are presented as mean ± SEMs, n = 3 biological repeats. Two-tailed Student’s t-test P-values were indicated. Representative data from one of the three independent experiments. (E) Venn diagram showed the number and percentage of upregulated (top) and downregulated (bottom) DEGs rescued by activated HSP90AA1 upon TM treatment. (F) Heatmap showing the expression levels of upregulated and downregulated DEGs rescued by activated HSP90AA1 upon TM treatment. (G) Representative GO terms of upregulated (top) and downregulated (bottom) DEGs rescued by activated HSP90AA1. Count indicates gene number. (H) Heatmaps showing the relative expression levels of genes related to response to ER stress and apoptosis in different groups. (I) The relative expression levels of indicated genes by RT-qPCR. Data are presented as mean ± SEMs, n = 3 biological repeats. Two-tailed Student’s t-test P values were indicated. A representative data from one of the three independent experiments. (J) The Venn diagram showing the genes shared by downregulated DEGs rescued by activated HSP90AA1 and upregulated DDEGs of stria vascularis. (K) Schematic illustration of the phenotypic changes and molecular mechanism of cochlear aging in mice.

References

    1. Abubacker S, Dorosz SG, Ponjevic Det al. . Full-length recombinant human proteoglycan 4 interacts with hyaluronan to provide cartilage boundary lubrication. Ann Biomed Eng 2016;44:1128–1137. - PubMed
    1. Aging Atlas C. Aging Atlas: a multi-omics database for aging biology. Nucleic Acids Res 2021;49:D825–D830. - PMC - PubMed
    1. Aibar S, Gonzalez-Blas CB, Moerman Tet al. . SCENIC: single-cell regulatory network inference and clustering. Nat Methods 2017;14:1083–1086. - PMC - PubMed
    1. Anders S, Pyl PT, Huber W.. HTSeq--a Python framework to work with high-throughput sequencing data. Bioinformatics 2015;31:166–169. - PMC - PubMed
    1. Angelidis I, Simon LM, Fernandez IEet al. . An atlas of the aging lung mapped by single cell transcriptomics and deep tissue proteomics. Nat Commun 2019;10:963. - PMC - PubMed

Publication types