. 2023 Jun;45(3):1471-1490.
doi: 10.1007/s11357-023-00773-x. Epub 2023 Mar 18.

Longitudinal characterization of cerebral hemodynamics in the TgF344-AD rat model of Alzheimer's disease

Affiliations

Longitudinal characterization of cerebral hemodynamics in the TgF344-AD rat model of Alzheimer's disease

Xing Fang et al. Geroscience. 2023 Jun.

Abstract

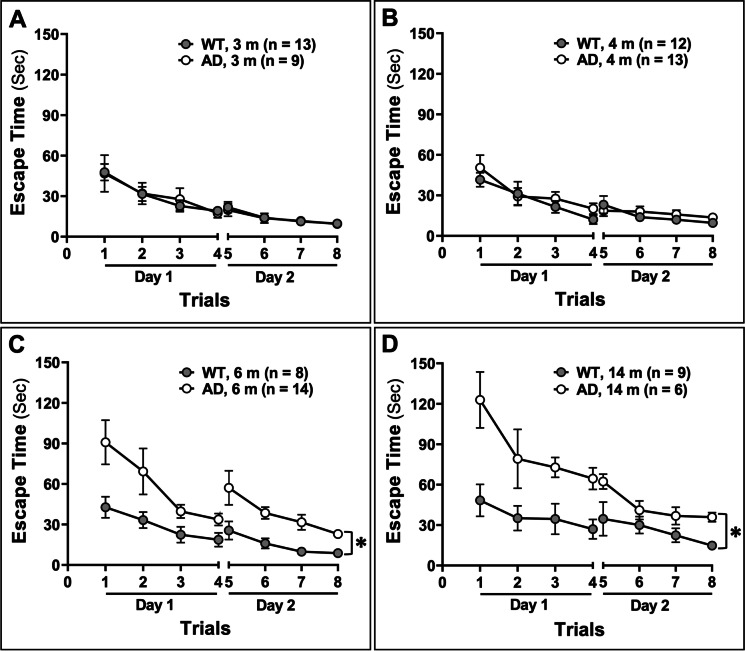
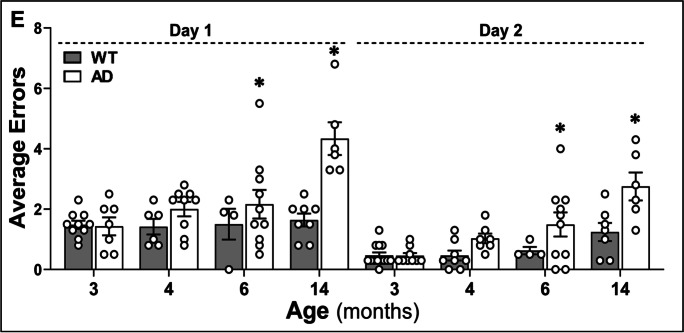
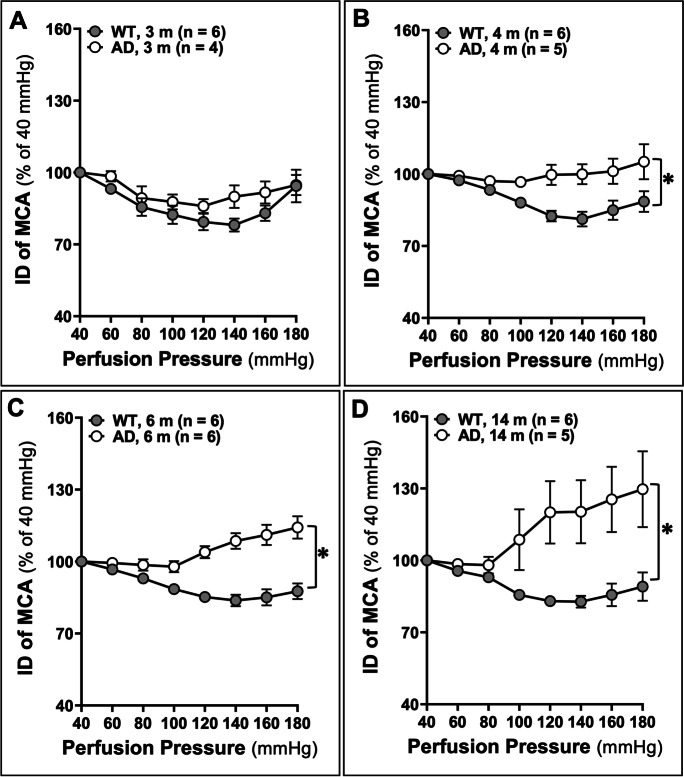
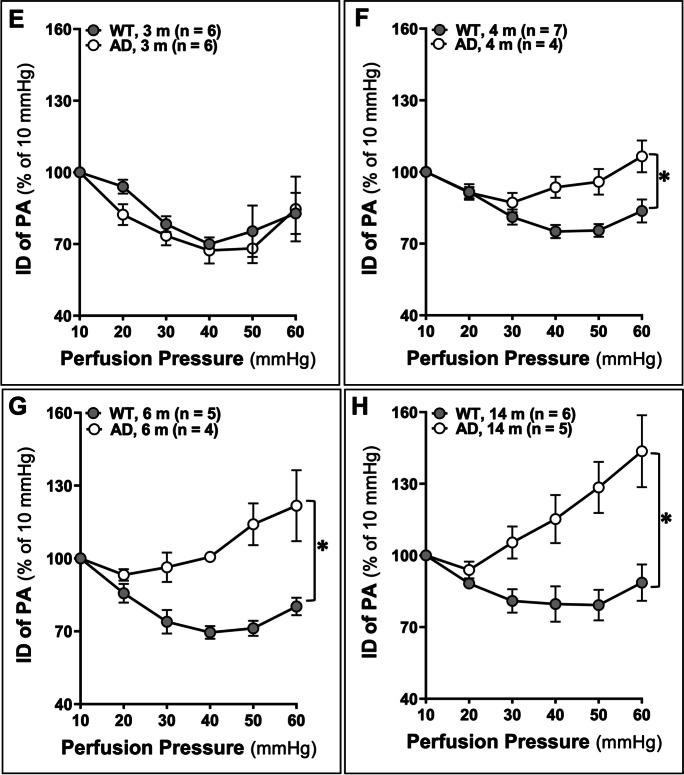
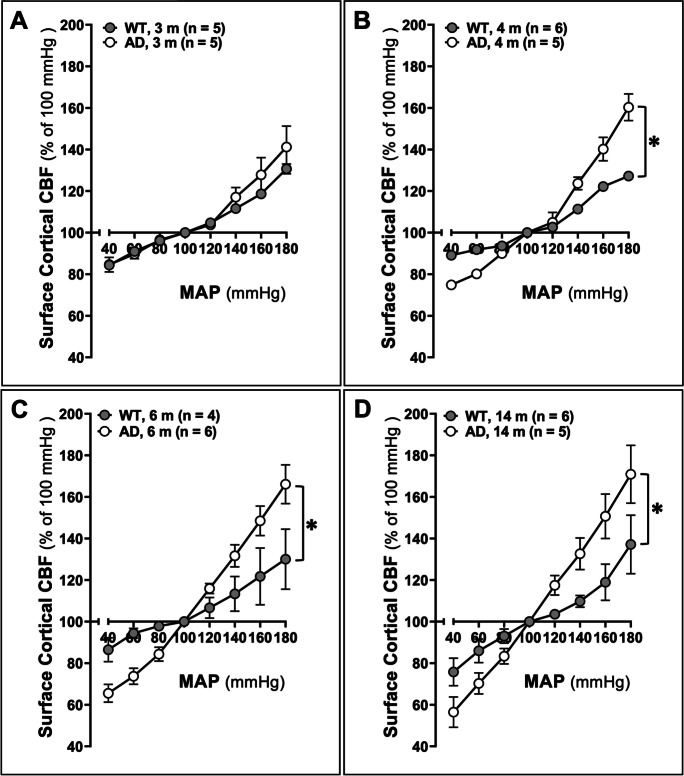
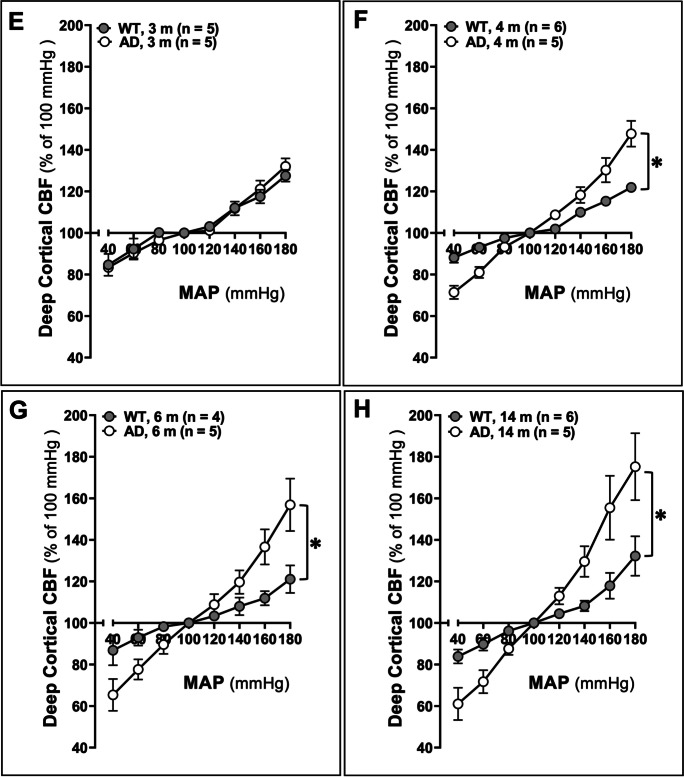
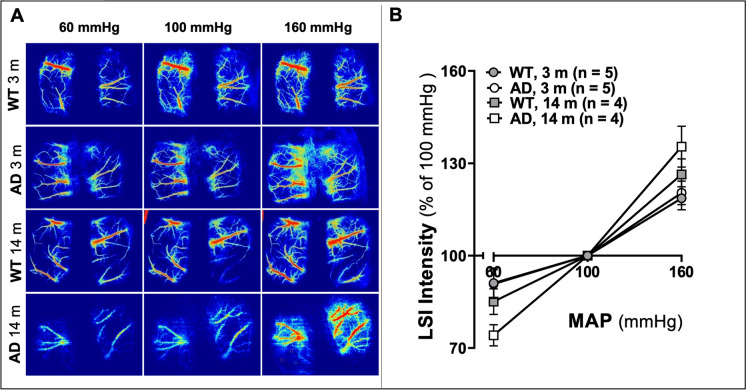
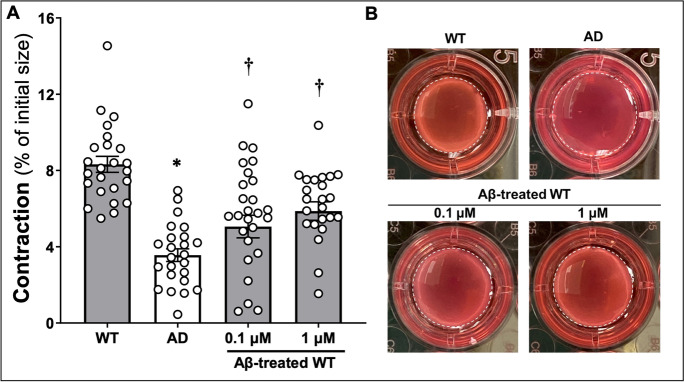
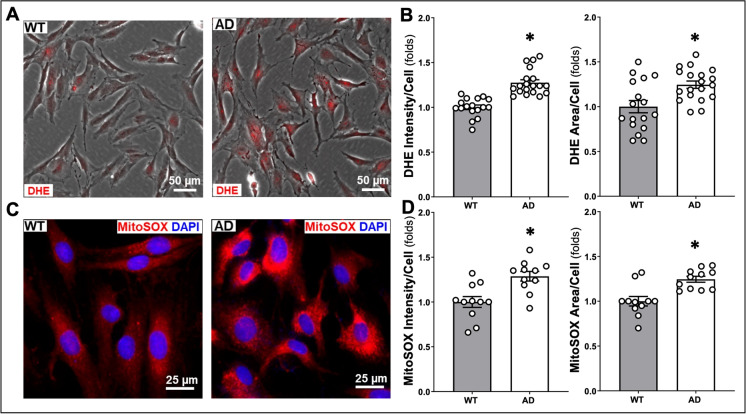
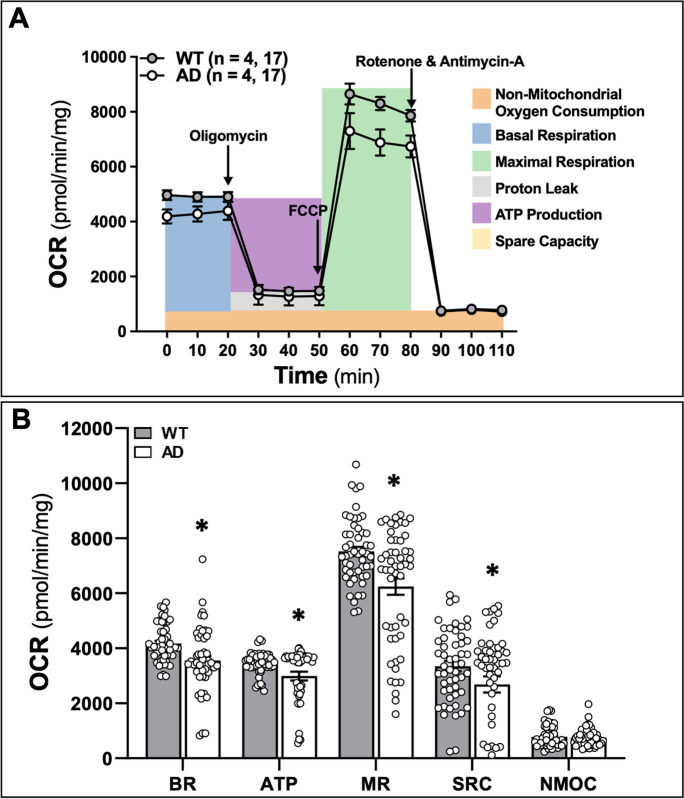
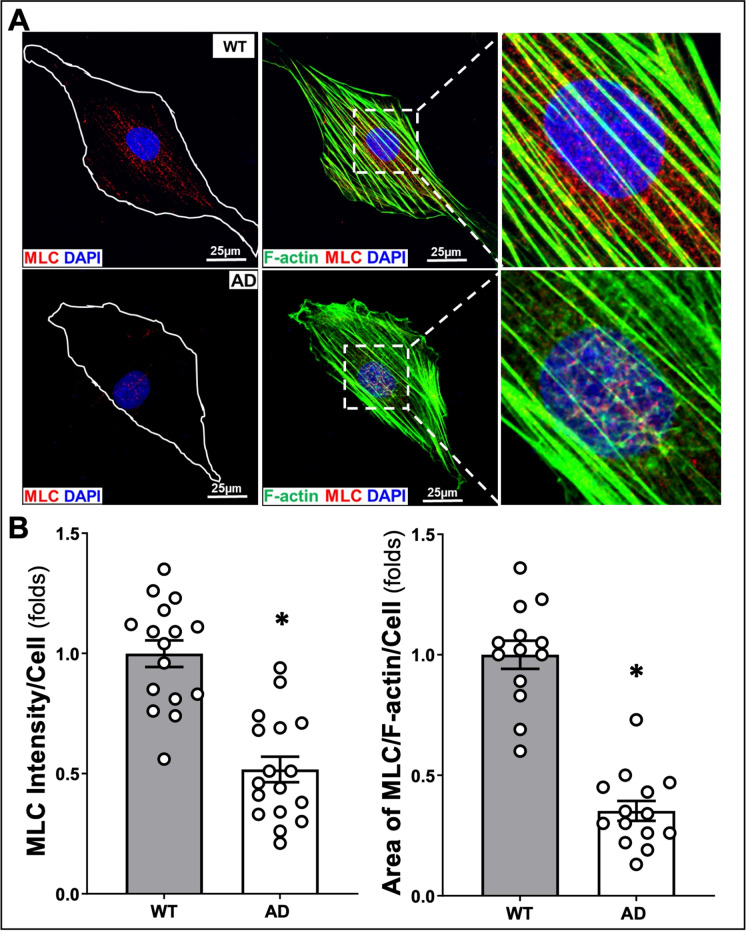
Alzheimer's disease (AD) is a global healthcare crisis. The TgF344-AD rat is an AD model exhibiting age-dependent AD pathological hallmarks. We confirmed that AD rats developed cognitive deficits at 6 months without alteration of any other major biophysical parameters. We longitudinally characterized cerebral hemodynamics in AD rats at 3, 4, 6, and 14 months. The myogenic responses of the cerebral arteries and arterioles were impaired at 4 months of age in the AD rats. Consistent with the ex vivo results, the AD rat exhibited poor autoregulation of surface and deep cortical cerebral blood flow 2 months preceding cognitive decline. The dysfunction of cerebral hemodynamics in AD is exacerbated with age associated with reduced cerebral perfusion. Further, abolished cell contractility contributes to cerebral hemodynamics imbalance in AD. This may be attributed to enhanced ROS production, reduced mitochondrial respiration and ATP production, and disrupted actin cytoskeleton in cerebral vascular contractile cells.

Keywords: Alzheimer’s disease; Autoregulation; Cognitive impairments; Hemodynamics; Myogenic response; Vascular smooth muscle cells.


Conflict of interest statement

The authors declare that they have no conflict of interest.

Figures

Fig. 1
Fig. 1
Validation of cognitive phenotype of the TgF344-AD (AD) rats. Hippocampal-based spatial learning and memory phenotype was evaluated in 3, 4, 6, and 14 months old wild-type (WT; F344) and AD rats. AD Time to reach the platform per trial (escape time) in a 2-day eight-arm water maze test. Numbers in parentheses indicate the number of rats studied per group. E The total number of errors per trial. N = 6–14 rats per group. Mean values ± SEM are presented. An open circle represents a single value obtained from an individual animal. * indicates P < 0.05 from the corresponding values in age-matched WT rats
Fig. 1
Fig. 1
Validation of cognitive phenotype of the TgF344-AD (AD) rats. Hippocampal-based spatial learning and memory phenotype was evaluated in 3, 4, 6, and 14 months old wild-type (WT; F344) and AD rats. AD Time to reach the platform per trial (escape time) in a 2-day eight-arm water maze test. Numbers in parentheses indicate the number of rats studied per group. E The total number of errors per trial. N = 6–14 rats per group. Mean values ± SEM are presented. An open circle represents a single value obtained from an individual animal. * indicates P < 0.05 from the corresponding values in age-matched WT rats
Fig. 2
Fig. 2
Myogenic response. Comparison of the myogenic response of the middle cerebral artery (MCA) and parenchymal arteriole (PA) in 3, 4, 6, and 14 months old wild-type (WT; F344) and TgF344-AD (AD) rats. AD Comparison of the myogenic response of the MCA as of % constriction to 40 mmHg. E–H. Comparison of the myogenic response of the PA as of % constriction to 10 mmHg. Mean values ± SEM are presented. Numbers in parentheses indicate the number of rats studied per group. * indicates a significant difference (P < 0.05) from the corresponding values in age-matched WT rats
Fig. 2
Fig. 2
Myogenic response. Comparison of the myogenic response of the middle cerebral artery (MCA) and parenchymal arteriole (PA) in 3, 4, 6, and 14 months old wild-type (WT; F344) and TgF344-AD (AD) rats. AD Comparison of the myogenic response of the MCA as of % constriction to 40 mmHg. E–H. Comparison of the myogenic response of the PA as of % constriction to 10 mmHg. Mean values ± SEM are presented. Numbers in parentheses indicate the number of rats studied per group. * indicates a significant difference (P < 0.05) from the corresponding values in age-matched WT rats
Fig. 3
Fig. 3
Cerebral blood flow (CBF) autoregulation. Comparison of the CBF autoregulation in 3, 4, 6, and 14 months old wild-type (WT; F344) and TgF344-AD (AD) rats. AD. Comparison of surface cortical CBF autoregulation as of % to 100 mmHg. EH Comparison of deep cortical CBF autoregulation as of % to 100 mmHg. Data are presented as mean values ± SEM. Numbers in parentheses indicate the number of rats studied per group. * indicates a significant difference (P < 0.05) from the corresponding values in age-matched WT rats
Fig. 3
Fig. 3
Cerebral blood flow (CBF) autoregulation. Comparison of the CBF autoregulation in 3, 4, 6, and 14 months old wild-type (WT; F344) and TgF344-AD (AD) rats. AD. Comparison of surface cortical CBF autoregulation as of % to 100 mmHg. EH Comparison of deep cortical CBF autoregulation as of % to 100 mmHg. Data are presented as mean values ± SEM. Numbers in parentheses indicate the number of rats studied per group. * indicates a significant difference (P < 0.05) from the corresponding values in age-matched WT rats
Fig. 4
Fig. 4
Brain perfusion. Comparison of surface brain perfusion in 3 and 14 months old wild-type (WT; F344) and TgF344-AD (AD) rats using laser speckle imaging (LSI) system at pressure 60, 100, and 160 mmHg. A Representatively laser speckle contrast images of surface cortical cerebral blood flow (CBF). B Quantitation of LSI intensity as of % to 100 mmHg as an indicator of surface cortical CBF. Data are presented as mean values ± SEM. Numbers in parentheses indicate the number of rats studied per group. * indicates a significant difference (P < 0.05) from the corresponding values in age-matched WT rats
Fig. 5
Fig. 5
Cell contractile capability. Comparison of contractile capability in vascular smooth muscle cells (VSMCs) isolated from the middle cerebral artery of wild-type (WT; F344) and TgF344-AD (AD) rats, as well as the effect of Aβ (1–42) on the contractile capability of WT cerebral VSMCs. A Quantitation of % constriction relative to the initial gel size of cerebral VSMCs in various groups and treatments. B Representative images. Cerebral VSMCs were isolated from 3 to 4 rats per strain. Experiments using primary cerebral VSMCs were performed in triplicate and repeated three times. Mean values ± SEM are presented. Each dot (open circle) represents a single value obtained from an individual animal. * indicates P < 0.05 from the corresponding values in WT cells. indicates P < 0.05 from the corresponding values in WT cells without Aβ (1–42) treatments
Fig. 6
Fig. 6
Production of reactive oxygen species (ROS) and mitochondrial superoxide. The production of ROS and mitochondrial superoxide in vascular smooth muscle cells (VSMCs) isolated from the middle cerebral artery of wild-type (WT; F344) and TgF344-AD (AD) rats were compared. A Representative images of dihydroethidium (DHE) staining as an indicator of ROS production. B Quantitation of DHE fluorescence intensity and DHE positive area per cell. C Representative images of MitoSOX™ as an indicator of mitochondrial superoxide production. D Quantitation of MitoSOX™ fluorescence intensity and MitoSOX™ positive area per cell. Cerebral VSMCs were isolated from 3 to 4 rats per strain. Experiments using primary cerebral VSMCs were performed in triplicate and repeated three times. Mean values ± SEM are presented. Each dot (open circle) represents a single value obtained from an individual well. * indicates P < 0.05 from the corresponding values in WT cells
Fig. 7
Fig. 7
Mitochondrial respiration and ATP production. Mitochondrial respiration and ATP production in vascular smooth muscle cells (VSMCs) isolated from the middle cerebral artery of wild-type (WT; F344) and TgF344-AD (AD) rats were compared using the Seahorse XFe24 Extracellular Flux Analyzer by comparing the oxygen consumption rate (OCR). A OCR Mito Stress test Seahorse profiles. Numbers in parentheses indicate the number of rats studied per group. B Quantitative analysis of OCR. Each dot (open circle) represents a single value obtained from an individual well. Cerebral VSMCs were isolated from 3 to 4 rats per strain. Experiments using primary cerebral VSMCs were performed in triplicate and repeated three times. Mean values ± SEM are presented. * indicates P < 0.05 from the corresponding values in WT cells. BR, basal respiration; ATP, adenosine triphosphate; MR, maximal respiration; SRC, spare respiratory capacity; NMOC, non-mitochondrial oxygen consumption
Fig. 8
Fig. 8
Contractile units. The structure, expression, and intracellular distribution of F-actin and myosin light chain (MLC) in vascular smooth muscle cells (VSMCs) isolated from the middle cerebral artery of wild-type (WT; F344) and TgF344-AD (AD) rats were compared by immunocytochemistry. A Representative images of immunostaining using Alexa Fluor 488 phalloidin for F-actin and the antibody against MLC. The cell nucleus was stained with 4′,6-diamidino-2-phenylindole (DAPI). B Quantitative analysis of MLC fluorescence intensity and the MLC/F-actin ratios (of positively stained cells) as indicators of MLC expression and the numbers of the actin-myosin contractile units, respectively. Each dot (open circle) represents a single value obtained from an individual well. Cerebral VSMCs were isolated from 3 to 4 rats per strain. Experiments using primary cerebral VSMCs were performed in triplicate and repeated three times. Mean values ± SEM are presented. * indicates P < 0.05 from the corresponding values in WT cells

Similar articles

Cited by

References

    1. Gaugler J, James B, Johnson T, Reimer J, Solis M, Weuve J. 2022 Alzheimer's disease facts and figures. Alzheimers Dement. 2022;18:700–789. doi: 10.1002/alz.12638. - DOI - PubMed
    1. Sweeney MD, Kisler K, Montagne A, Toga AW, Zlokovic BV. The role of brain vasculature in neurodegenerative disorders. Nat Neurosci. 2018;21:1318–1331. doi: 10.1038/s41593-018-0234-x. - DOI - PMC - PubMed
    1. Fang X, Crumpler RF, Thomas KN, Mazique JN, Roman RJ and Fan F. Contribution of cerebral microvascular mechanisms to age-related cognitive impairment and dementia. Physiol Int. 2022. - PMC - PubMed
    1. Fan F, Roman RJ. Reversal of cerebral hypoperfusion: a novel therapeutic target for the treatment of AD/ADRD? Geroscience. 2021;43:1065–1067. doi: 10.1007/s11357-021-00357-7. - DOI - PMC - PubMed
    1. Bracko O, Cruz Hernández JC, Park L, Nishimura N, Schaffer CB. Causes and consequences of baseline cerebral blood flow reductions in Alzheimer's disease. J Cereb Blood Flow Metab. 2021;41:1501–1516. doi: 10.1177/0271678X20982383. - DOI - PMC - PubMed

Publication types