

The role of miR-139-5p in radioiodine-resistant thyroid cancer
- PMID: 36933170
- PMCID: PMC10514163
- DOI: 10.1007/s40618-023-02059-7
The role of miR-139-5p in radioiodine-resistant thyroid cancer
Abstract
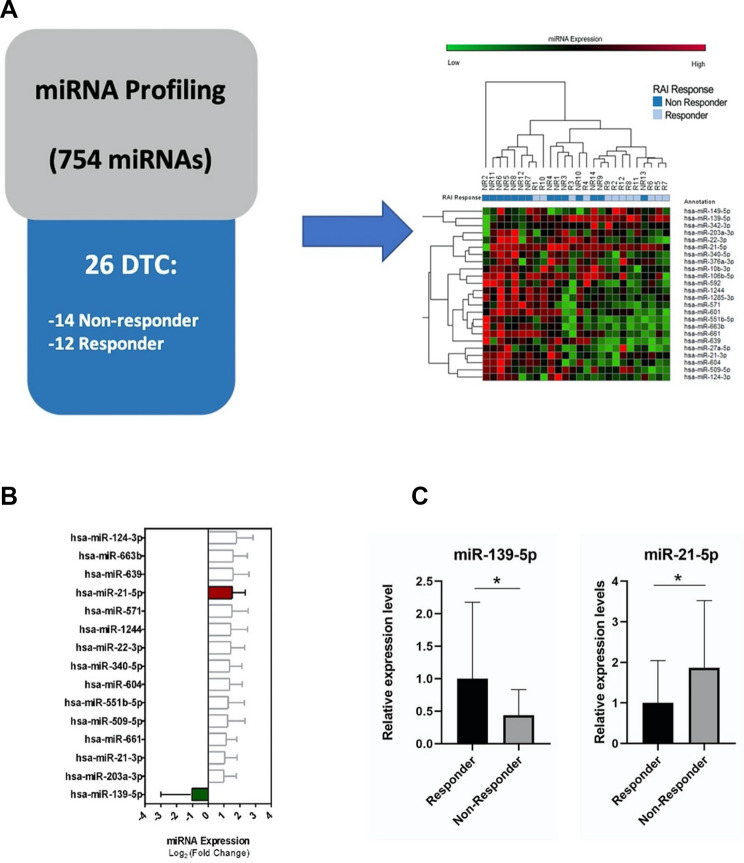
Purpose: Radioiodine I-131 (RAI) is the therapy of choice for differentiated thyroid cancer (DTC). Between 5% and 15% of DTC patients become RAI refractory, due to the loss of expression/function of iodide metabolism components, especially the Na/I symporter (NIS). We searched for a miRNA profile associated with RAI-refractory DTC to identify novel biomarkers that could be potential targets for redifferentiation therapy.
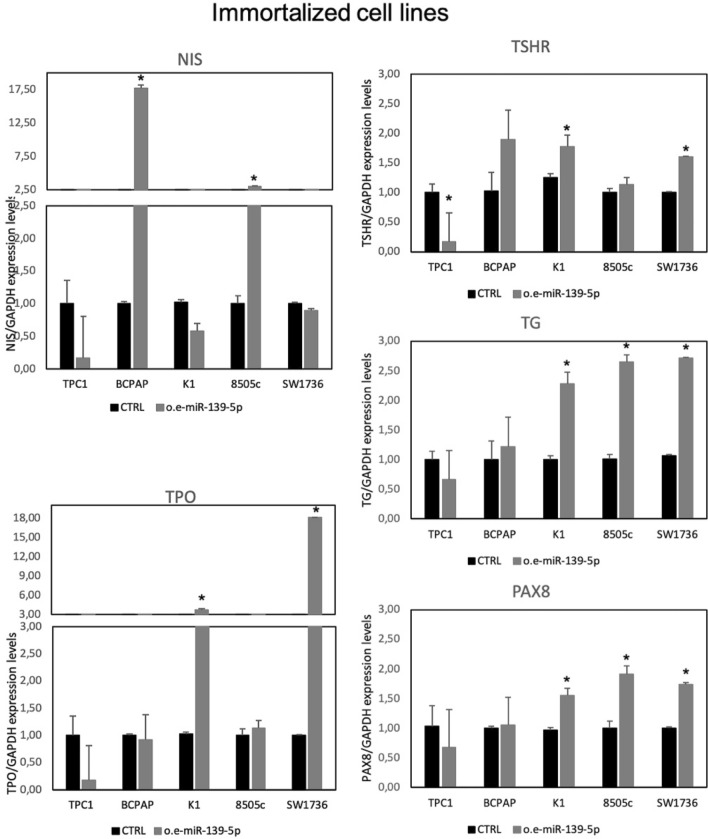
Methods: We analyzed the expression of 754 miRNAs in 26 DTC tissues: 12 responsive (R) and 14 non-responsive (NR) to RAI therapy. We identified 15 dysregulated miRNAs: 14 were upregulated, while only one (miR-139-5p) was downregulated in NR vs. R tumors. We investigated the role of miR-139-5p in iodine uptake metabolism. We overexpressed miR-139-5p in two primary and five immortalized thyroid cancer cell lines, and we analyzed the transcript and protein levels of NIS and its activation through iodine uptake assay and subcellular protein localization.
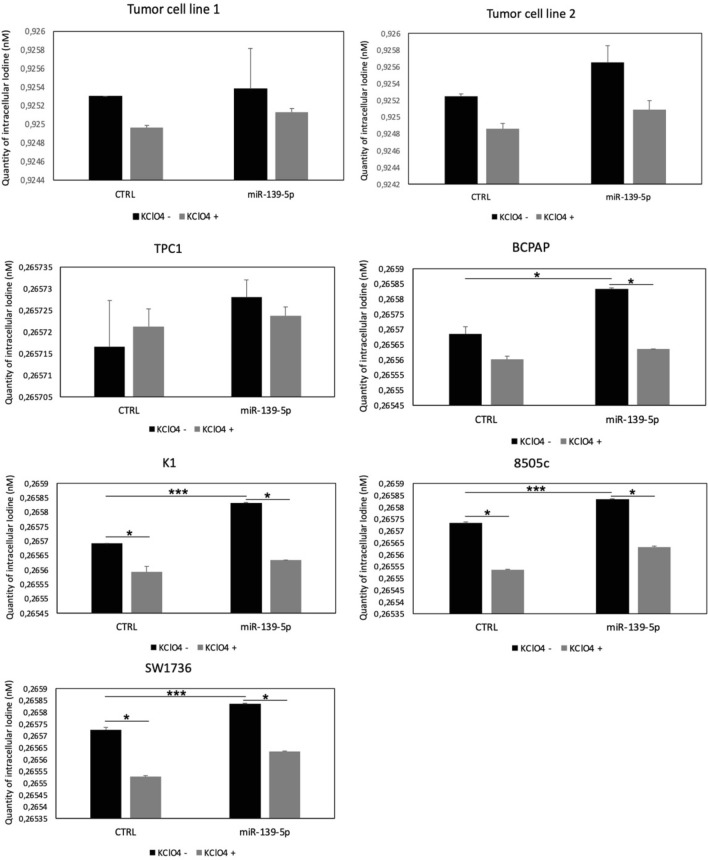
Results: The finding of higher intracellular iodine levels and increased cell membrane protein localization in miR-139-5p overexpressing cells supports the role of this miRNA in the regulation of NIS function.
Conclusions: Our study provides evidence of miR-139-5p involvement in iodine uptake metabolism and suggests its possible role as a therapeutic target in restoring iodine uptake in RAI-refractory DTC.
Keywords: Na/I symporter (NIS); Radioiodine resistance; Thyroid cancer; miR-139-5p.
© 2023. The Author(s).
Conflict of interest statement
The authors declare that there is no conflict of interest to disclose.
Figures


Similar articles
-
Selumetinib Activity in Thyroid Cancer Cells: Modulation of Sodium Iodide Symporter and Associated miRNAs.Int J Mol Sci. 2018 Jul 17;19(7):2077. doi: 10.3390/ijms19072077. Int J Mol Sci. 2018. PMID: 30018229 Free PMC article.
-
Inhibition of microRNA-875-5p promotes radioiodine uptake in poorly differentiated thyroid carcinoma cells by upregulating sodium-iodide symporter.J Endocrinol Invest. 2020 Apr;43(4):439-450. doi: 10.1007/s40618-019-01125-3. Epub 2019 Oct 14. J Endocrinol Invest. 2020. Retraction in: J Endocrinol Invest. 2022 Oct;45(10):2025. doi: 10.1007/s40618-022-01852-0. PMID: 31612419 Retracted.
-
microRNA-339-5p modulates Na+/I- symporter-mediated radioiodide uptake.Endocr Relat Cancer. 2015 Feb;22(1):11-21. doi: 10.1530/ERC-14-0439. Epub 2014 Nov 17. Endocr Relat Cancer. 2015. PMID: 25404690 Free PMC article.
-
Molecular mechanisms of radioactive iodine refractoriness in differentiated thyroid cancer: Impaired sodium iodide symporter (NIS) expression owing to altered signaling pathway activity and intracellular localization of NIS.Theranostics. 2021 Apr 15;11(13):6251-6277. doi: 10.7150/thno.57689. eCollection 2021. Theranostics. 2021. PMID: 33995657 Free PMC article. Review.
-
Radioactive Iodine-Refractory Differentiated Thyroid Cancer and Redifferentiation Therapy.Endocrinol Metab (Seoul). 2019 Sep;34(3):215-225. doi: 10.3803/EnM.2019.34.3.215. Endocrinol Metab (Seoul). 2019. PMID: 31565873 Free PMC article. Review.
Cited by
-
Current Advances in Radioactive Iodine-Refractory Differentiated Thyroid Cancer.Curr Oncol. 2024 Jul 3;31(7):3870-3884. doi: 10.3390/curroncol31070286. Curr Oncol. 2024. PMID: 39057158 Free PMC article. Review.
References
-
- Haugen BR, Alexander EK, Bible KC, et al. American thyroid association management guidelines for adult patients with thyroid nodules and differentiated thyroid cancer: the American thyroid association guidelines task force on thyroid nodules and differentiated thyroid cancer. Thyroid. 2016;26:1–133. doi: 10.1089/thy.2015.0020. - DOI - PMC - PubMed
MeSH terms
Substances
Grants and funding
LinkOut - more resources
Full Text Sources
Medical
