. 2023 Aug;26(3):385-407.
doi: 10.1007/s10456-023-09870-z. Epub 2023 Mar 18.

The vascular gene Apold1 is dispensable for normal development but controls angiogenesis under pathological conditions

Affiliations

The vascular gene Apold1 is dispensable for normal development but controls angiogenesis under pathological conditions

Zheng Fan et al. Angiogenesis. 2023 Aug.

Abstract

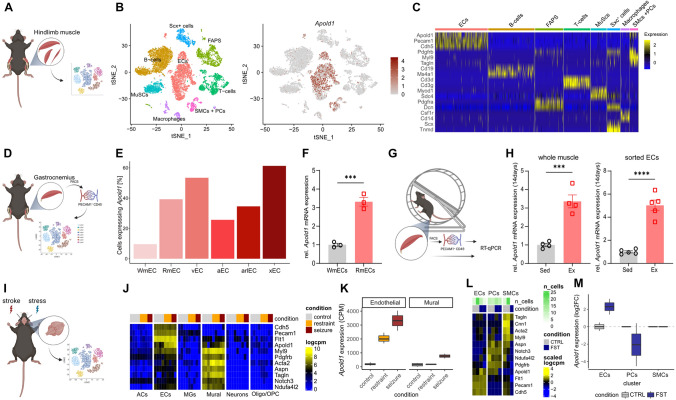
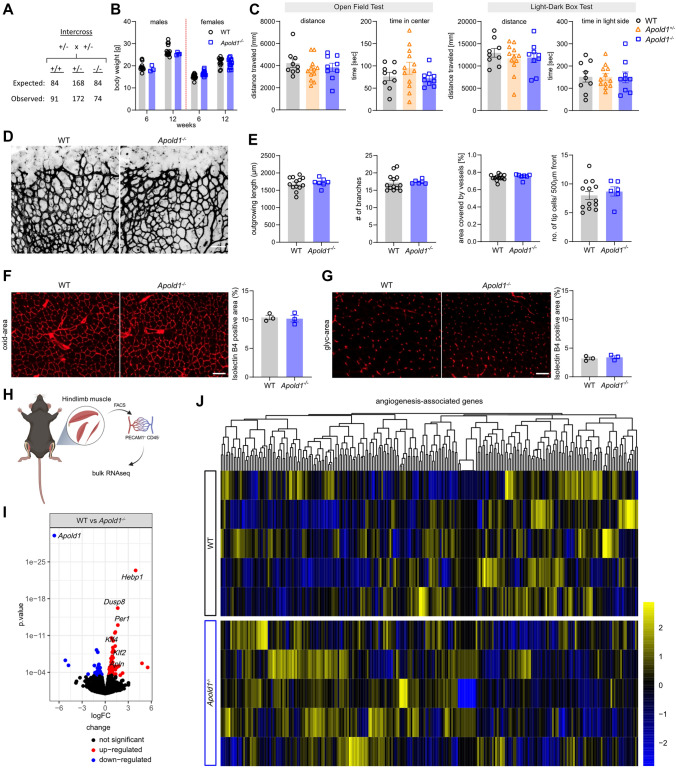
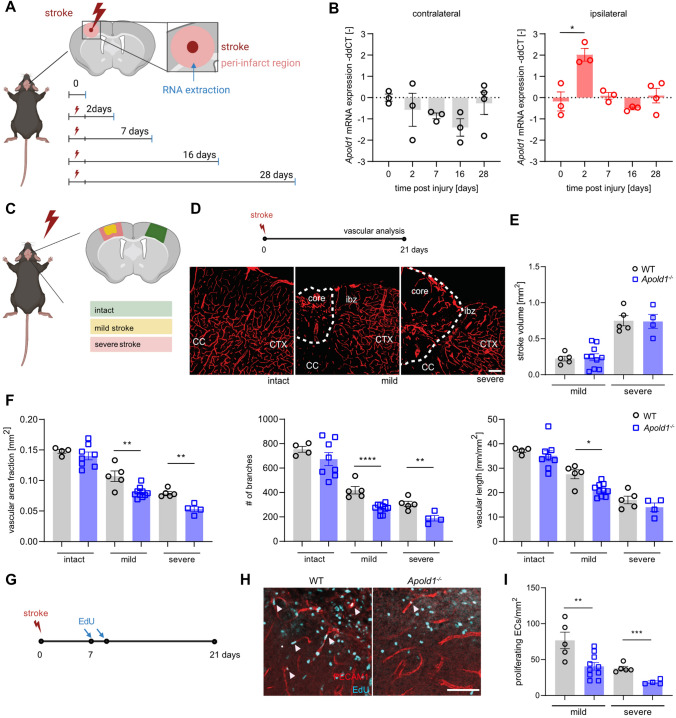
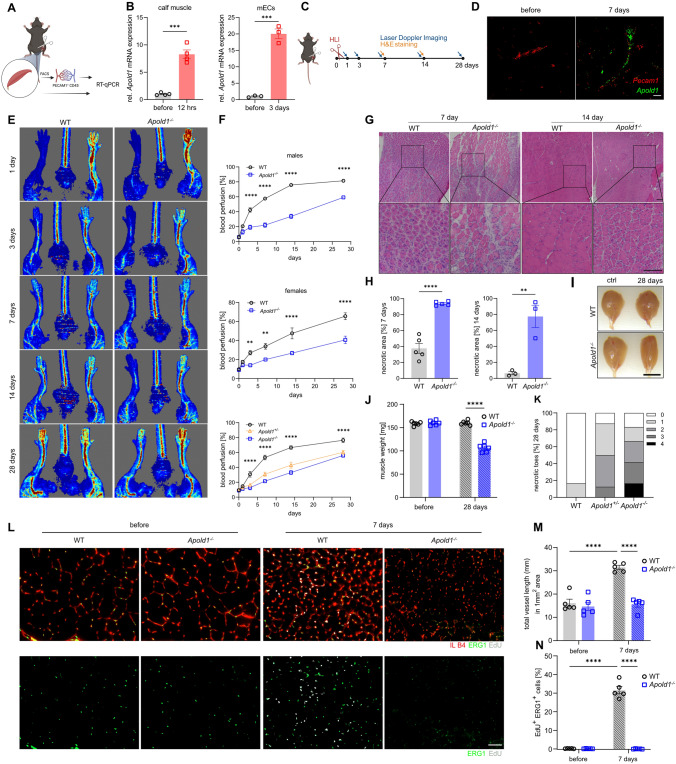
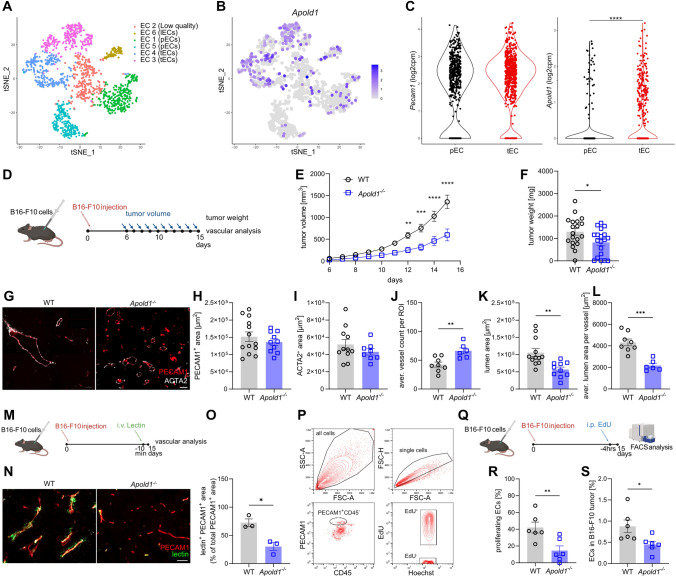
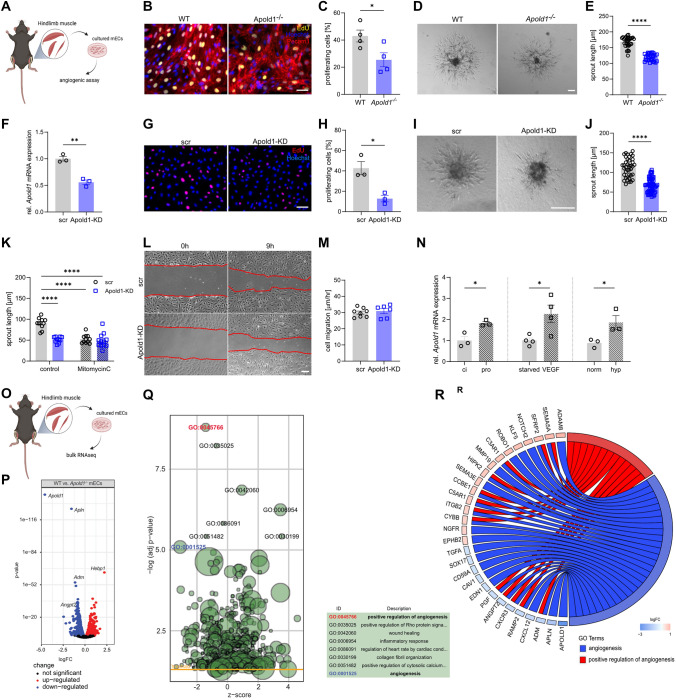
The molecular mechanisms of angiogenesis have been intensely studied, but many genes that control endothelial behavior and fate still need to be described. Here, we characterize the role of Apold1 (Apolipoprotein L domain containing 1) in angiogenesis in vivo and in vitro. Single-cell analyses reveal that - across tissues - the expression of Apold1 is restricted to the vasculature and that Apold1 expression in endothelial cells (ECs) is highly sensitive to environmental factors. Using Apold1-/- mice, we find that Apold1 is dispensable for development and does not affect postnatal retinal angiogenesis nor alters the vascular network in adult brain and muscle. However, when exposed to ischemic conditions following photothrombotic stroke as well as femoral artery ligation, Apold1-/- mice display dramatic impairments in recovery and revascularization. We also find that human tumor endothelial cells express strikingly higher levels of Apold1 and that Apold1 deletion in mice stunts the growth of subcutaneous B16 melanoma tumors, which have smaller and poorly perfused vessels. Mechanistically, Apold1 is activated in ECs upon growth factor stimulation as well as in hypoxia, and Apold1 intrinsically controls EC proliferation but not migration. Our data demonstrate that Apold1 is a key regulator of angiogenesis in pathological settings, whereas it does not affect developmental angiogenesis, thus making it a promising candidate for clinical investigation.

Keywords: Angiogenesis; EC proliferation; Endothelial cell; Hindlimb ischemia; Stroke; Tumor.


Conflict of interest statement

The authors disclose no financial or non-financial interests related to this work.

Figures

Fig. 1
Fig. 1
Apold1 gene expression in muscle and brain is restricted to the vasculature, including endothelial cells, pericytes, and smooth muscle cells and triggered by environmental stimuli. A Experimental design [41]. B t-Stochastic neighbor embedding (tSNE) plots of distribution of main muscle-resident populations reanalyzed [41] (ECs endothelial cells; PCs pericytes; SMCs smooth muscle cells). C RNA expression heat map for given cell populations (column) and genes (row) sorted by population specific gene expression reanalyzed [41]. D Experimental design [52]. E Percentage of Apold1 RNA expression in all endothelial populations (WmEC white mECs; RmEC red mECs; vEC venous ECs; aEC arterial ECs; arlEC arteriolar ECs; xEC unknown ECs) reanalyzed [52]. F Relative Apold1 mRNA expression in WmECs and RmECs (n (WmECs/RmECs) = 3/3). G Experimental design. H Relative Apold1 mRNA expression in whole muscle and sorted ECs after 14 days of voluntary wheel running (n (Sed/Ex) = 4/4). I Experimental design [42, 44]. J RNA expression heat map for control, restraint stress, and seizure conditions (column) and genes (rows) reanalyzed [42]. K Apold1 RNA expression in control, restraint stress, and seizure conditions in ECs and mural cells in the mice brain [42]. L RNA expression heat map of ECs, PCs, and SMCs in mice brain exposed to control (CTRL) and forced swim test conditions (FST) [44]. M Apold1 RNA expression upon forced swim test (FST) in ECs, PCs, and SMCs of the brain compared to control conditions [44]. Student’s t test in F and H (***p < 0.001, **** = p < 0.0001). The data shown are mean ± SEM
Fig. 2
Fig. 2
Apold1 deficiency does not affect physiological angiogenesis A Expected and observed Mendelian distribution of heterozygous breedings (Chi-square test: 0.9585; p = 0.6193). B Quantification of body weight at 6 and 12 weeks of age in females and males between genotypes (n = 3–14 per group). C Behavioral analysis of WT and Apold1−/− in the open-field test and light–dark box measured by distance traveled and time in center/time in light side (n (WT/Apold1±/Apold1−/−) = 9/12/9). D Representative images of isolectin-B4-stained (black) retinal vessels of postnatal day 5 (P5) pups. Scale bar, 100 µm. E Quantification of outgrowing vessel length, number of branches, percentage of area covered by vessels, and number of tip cells in 500 µm front of the retina (n (WT/Apold1−/−) = 13/6). F Representative images and percentage positive area of blood vessels stained with isolectin B4 (red) in the oxidative area of the gastrocnemius (oxid-area) (n (WT/Apold1−/−) = 3/3). Scale bar, 200 μm. G Representative images and percentage of positive area of blood vessels stained with isolectin B4 in the glycolytic area of the gastrocnemius (glyc-area) (n (WT/Apold1−/−) = 3/3). Scale bar 200 µm. H Experimental design. I Volcano plot of significantly differentially expressed genes by bulk RNAseq of WT vs Apold1−/− mECs (n (WT/Apold1−/−) = 5/5). J RNA expression heat map of all angiogenesis-associated genes (n(WT/Apold1−/−) = 5/5). Student’s test in B, E, F, and G; one-way ANOVA with Tukey’s multiple comparison test in C. The data shown are mean ± SEM
Fig. 3
Fig. 3
Apold1 is required for angiogenesis and revascularization after photothrombotic stroke. A Experimental design. B Time course of relative Apold1 mRNA expression on contralateral and ipsilateral cortex (n = 3–4 per timepoint). C Illustration of stroke size and location. D Experimental design and representative images of intact and injured PECAM1+ vasculature. E Stroke volumes 21 days following injury (n = 4–10 per group; Scale bar, 100 µm). F Quantitative analysis of vascular density, number of branches, and length of blood vessels in the ischemic border regions (n = 4–8 per group). G Experimental design. H Representative images of newly formed vascular cells by PECAM1+/EdU+ co-staining in WT and Apold1−/− animals. Scale bar, 50 µm. I Quantification of proliferating ECs (n = 4–10 per group). Two-way ANOVA with Tukey’s multiple comparisons test in B; Student’s t test in E, F, and G (*p < 0.05; **p < 0.01; ***p < 0.001; and ****p < 0.0001). The data shown are mean ± SEM
Fig. 4
Fig. 4
Impaired revascularization, angiogenesis, and EC proliferation after hindlimb ischemia in Apold1−/− mice. A Experimental design. B Apold1 expression in qRT-PCR in whole calf muscle tissue 12 h after hindlimb ischemia (left) and in muscle ECs (right) 3 days after hindlimb ischemia in WT mice (n = 3–4 per group). C Experimental design. D Representative image of in situ hybridization for Apold1 7 days after ischemia in the ischemic muscle (ipsilateral) and the contralateral control muscle. Scale bar, 20 μm. E Representative images of blood perfusion measured by laser Doppler imaging (LDI) 1, 3, 7, 14, and 28 days after hindlimb ischemia in Apold1−/− and WT mice. F Time course quantification of blood perfusion across 28 days after hindlimb ischemia comparing recovery in Apold1−/− vs. WT males (n (WT/Apold1−/−) = 6/6), females (n (WT/Apold1−/−) = 6/6), and in a separate experiment in Apold1−/−, Apold1±, and WT males (n (WT/Apold1±/Apold1−/−) = 6/6/4). G Representative hematoxylin–eosin (H&E) staining images of the triceps surae muscles at 7 and 14 days after hindlimb ischemia. Scale bar, 100 μm. H Quantification of necrotic area 7 and 14 days after hindlimb ischemia in WT and Apold1−/− mice (n (WT/Apold1−/−) = 6/6). I Photographs of whole calf muscle isolated from control and ischemic leg of WT and Apold1−/− mice. Scale bar, 7 mm. J Whole calf muscle weight 28 days after hindlimb ischemia (n = 6 per group). K Measurement of number of necrotic toes 28 days after hindlimb ischemia (n = 8–12 per group). L Representative images of isolectin B4 (IL B4, red), Erg1 (green), and EdU (white) immunofluorescent images on gastrocnemius muscle cross-sections of control and ischemic leg 7 days after hindlimb ischemia in WT and Apold1−/− mice. Scale bar, 50 μm. M Total vessel length in 1 mm2 area of muscle cross-sections before and 7 days after hindlimb ischemia in WT and Apold1−/− mice (n = 5 per group). N Percentage of EdU+ Erg1+ proliferating mECs at 7 days after induction of hindlimb ischemia (n = 5 per group). Student’s t test in B, H, and J; Two-way ANOVA with Sidak’s multiple comparison test in F; Two-way ANOVA with Tukey’s multiple comparison test in M and N (**p < 0.01; ***p < 0.001; and ****p < 0.0001). The data shown are mean ± SEM
Fig. 5
Fig. 5
Apold1 is enriched in tumor ECs and loss of Apold1 slows tumor growth. A t-Stochastic neighbor embedding (tSNE) plots of distribution of ECs in lung tissue resected from 5 patients with untreated, non-metastatic lung tumors reanalyzed [67]. B t-Stochastic neighbor embedding (tSNE) plots of distribution of Apold1 in ECs in lung tissue reanalyzed [67]. C Apold1 expression in tumor ECs (tECs) compared to pulmonary ECs (pECs) reanalyzed [67]. D Experimental design. E In vivo measurement of tumor volume in Apold1−/− and WT mice after injection of B16-F10 melanoma cells (n (WT/Apold1−/−) = 11/11). F Weight of isolated tumors 15 days after injection (n (WT/Apold1−/−) = 19/19). G Representative images of the vasculature in tumors isolated from WT and Apold1−/− mice stained for PECAM1 (red) and ACTA2 (white). Scale bar, 100 µm. H Quantification of PECAM1+ area (n (WT/Apold1−/−) = 13/10) and I ACTA2+ area (n (WT/Apold1−/−) = 13/10). Scale bar, 100 µm. (J) Quantification of average vessel count per region of interest (ROI) (n (WT/Apold1−/−) = 8/6), K lumen size (n (WT/Apold1−/−) = 12/10), and L average lumen area per vessel (n (WT/Apold1−/−) = 8/6). M Experimental design. N Representative image of perfusion stained by injected fluorescein-labeled Lycopersicon esculentum (tomato) lectin (green) in PECAM1+ (red) in tumors isolated from WT and Apold1−/− mice. O Percentage of lectin+PECAM1+ area of total PECAM1+ area (n (WT/Apold1−/−) = 3/3). P Representative flow cytometric analysis of ECs (PECAM1+CD45) and proliferating ECs (EdU+) in B16-F10 melanoma. Q Experimental design. R Percentage of proliferating ECs (EdU+) (n (WT/Apold1−/−) = 6/6) and S percentage of ECs (PECAM1+CD45+) in B16-F10 melanoma (n (WT/Apold1−/−) = 6/6). Student’s t test in C, F, H, I, J, K, L, O, R, and S. Two-way ANOVA with Sidak’s multiple comparison test in E (*p < 0.05; **p < 0.01; and ***p < 0.001). The data shown are mean ± SEM
Fig. 6
Fig. 6
Angiogenesis is impaired in Apold1-deficient cells in vitro. A Experimental design. B, C Representative immunofluorescent images and quantification of four independent experiments of EdU (yellow) labeling of proliferating ECs isolated from skeletal muscle of WT and Apold1−/− mice, co-stained with Hoechst (blue) (n (WT/Apold1−/−) = 4/4. Scale bar, 100 μm). D, E Representative bright-field images and morphometric quantification of average sprout length of sprouting spheroids of mECs isolated from WT and Apold1−/− mice (n (WT/Apold1−/−) = 30/33. Scale bar, 100 μm). F Apold1 knockdown efficiency in HUVECs treated with scrambled (scr) shRNAs or shRNAs against Apold1 (Apold1-KD). G, H Representative immunofluorescent images and quantification of percentage of EdU (red)-labeled proliferating HUVECS to all nuclei stained with Hoechst (blue) in scr and Apold1-KD HUVECs (n (WT/Apold1-KD) = 3/3. Scale bar, 100 μm). I, J Representative image and quantification of sprout length of spheroids of scr and Apold1-KD HUVECs (n (scr/Apold1-KD) = 30/33. Scale bar, 100 μm). K Quantification of sprout length in scr and Apold1-KD HUVECs treated in control conditions or Mitomycin C (n (scr/Apold1-KD) = 10/10). L, M Representative images and quantification of cell migration in scratch assay (n (scr/Apold1-KD) = 7/6). N Relative Apold1 expression in contact-inhibited (ci) and proliferative conditions (pro), after VEGF treatment and in hypoxic condition (0.1% O2) (n (scr/Apold1-KD) = 3-4/3-4). O Experimental design. P Volcano plots with red and blue dots showing significantly changed genes within 5% false discovery rate (FDR) determined by bulk RNAseq of cultured WT vs Apold1−/− mECs (n (WT/Apold1−/−) = 3/3). Q Gene ontology analysis of bulk RNAseq of cultured and WT vs Apold1−/− mECs (n (WT/Apold1−/−) = 3/3). R Overview of genes significantly differentially expressed within the GO terms angiogenesis (blue) and positive regulation of angiogenesis (red) in cultured WT and Apold1−/− mECs. Student’s test in C, E, F, H, J, M, and N; Two-way ANOVA with Tukey’s multiple comparison test in K (*p < 0.05; **p < 0.01; ****p < 0.0001). The data shown are mean ± SEM

References

    1. Krock BL, Skuli N, Simon MC. Hypoxia-induced angiogenesis: good and evil. Genes Cancer. 2011;2:1117–1133. doi: 10.1177/1947601911423654. - DOI - PMC - PubMed
    1. Potente M, Gerhardt H, Carmeliet P. Basic and therapeutic aspects of angiogenesis. Cell. 2011;146:873–887. doi: 10.1016/j.cell.2011.08.039. - DOI - PubMed
    1. Adams RH, Alitalo K. Molecular regulation of angiogenesis and lymphangiogenesis. Nat Rev Mol Cell Biol. 2007;8:464–478. doi: 10.1038/nrm2183. - DOI - PubMed
    1. Gorski T, De Bock K. Metabolic regulation of exercise-induced angiogenesis. Vasc Biol. 2019;1:H1–H8. doi: 10.1530/VB-19-0008. - DOI - PMC - PubMed
    1. Nishijima T, Torres-Aleman I, Soya H. Chapter 11 - Exercise and cerebrovascular plasticity. In: Masamoto K, Hirase H, Yamada K, editors. Progress in Brain Research. Elsevier; 2016. pp. 243–268. - PubMed

Publication types

Substances