. 2023 Mar 18;14(1):1530.
doi: 10.1038/s41467-023-37200-w.

Integrative omics identifies conserved and pathogen-specific responses of sepsis-causing bacteria

Andre Mu #  1   2 William P Klare #  3 Sarah L Baines #  1 C N Ignatius Pang #  4   5 Romain Guérillot #  1 Nichaela Harbison-Price #  6   7 Nadia Keller  6 Jonathan Wilksch  1 Nguyen Thi Khanh Nhu  6   7 Minh-Duy Phan  6   7 Bernhard Keller  6   7 Brunda Nijagal  8 Dedreia Tull  8 Saravanan Dayalan  8 Hwa Huat Charlie Chua  8 Dominik Skoneczny  8 Jason Koval  4 Abderrahman Hachani  1 Anup D Shah  9 Nitika Neha  8 Snehal Jadhav  8 Sally R Partridge  10 Amanda J Cork  6   7 Kate Peters  6   7 Olivia Bertolla  6   7 Stephan Brouwer  6   7 Steven J Hancock  6 Laura Álvarez-Fraga  6 David M P De Oliveira  6   7 Brian Forde  6 Ashleigh Dale  3 Warasinee Mujchariyakul  1 Calum J Walsh  1 Ian Monk  1 Anna Fitzgerald  11 Mabel Lum  11 Carolina Correa-Ospina  4 Piklu Roy Chowdhury  12 Robert G Parton  7   13 James De Voss  6 James Beckett  6 Francois Monty  14 Jessica McKinnon  12 Xiaomin Song  15 John R Stephen  14 Marie Everest  14 Matt I Bellgard  16   17 Matthew Tinning  14 Michael Leeming  8 Dianna Hocking  1 Leila Jebeli  1 Nancy Wang  1 Nouri Ben Zakour  10 Serhat A Yasar  4 Stefano Vecchiarelli  4 Tonia Russell  4 Thiri Zaw  15 Tyrone Chen  18 Don Teng  8 Zena Kassir  4 Trevor Lithgow  19 Adam Jenney  19 Jason N Cole  20   21 Victor Nizet  20   21 Tania C Sorrell  10 Anton Y Peleg  18   19 David L Paterson  22 Scott A Beatson  6 Jemma Wu  15 Mark P Molloy  15 Anna E Syme  23 Robert J A Goode  9   24 Adam A Hunter  17 Grahame Bowland  17 Nicholas P West #  6 Marc R Wilkins #  4 Steven P Djordjevic #  12 Mark R Davies #  1 Torsten Seemann #  1 Benjamin P Howden #  1 Dana Pascovici #  15 Sonika Tyagi #  18 Ralf B Schittenhelm #  9 David P De Souza #  8 Malcolm J McConville #  25 Jonathan R Iredell #  10 Stuart J Cordwell #  3 Richard A Strugnell #  1 Timothy P Stinear #  1 Mark A Schembri #  6   7 Mark J Walker #  26   27
Affiliations

Integrative omics identifies conserved and pathogen-specific responses of sepsis-causing bacteria

Andre Mu et al. Nat Commun. .

Abstract

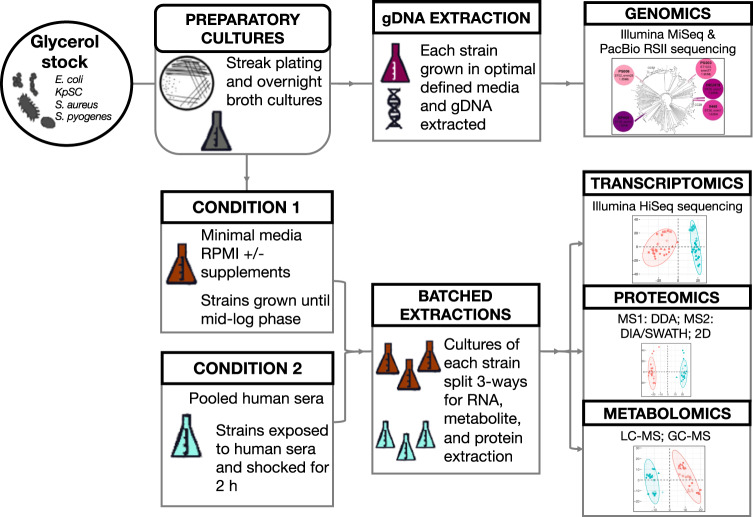
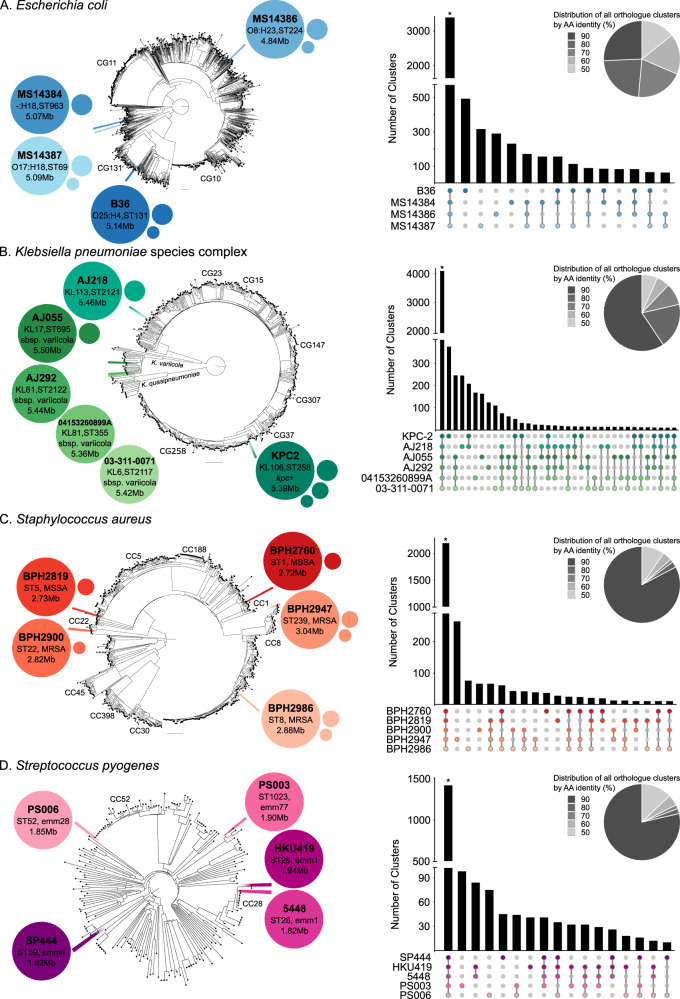
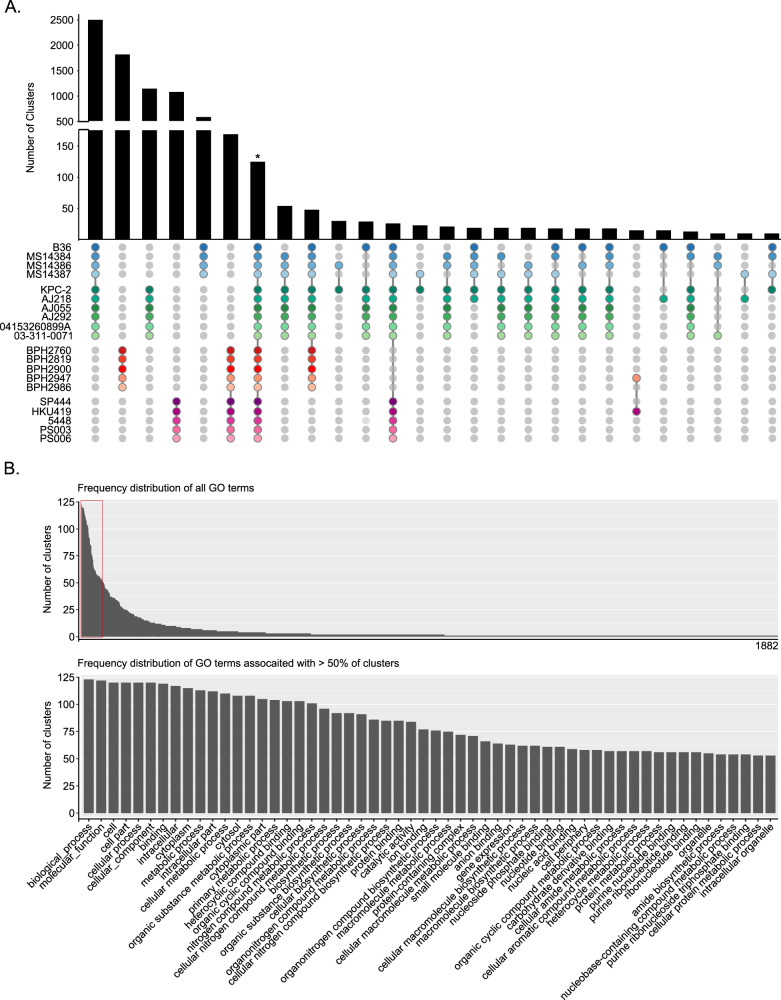
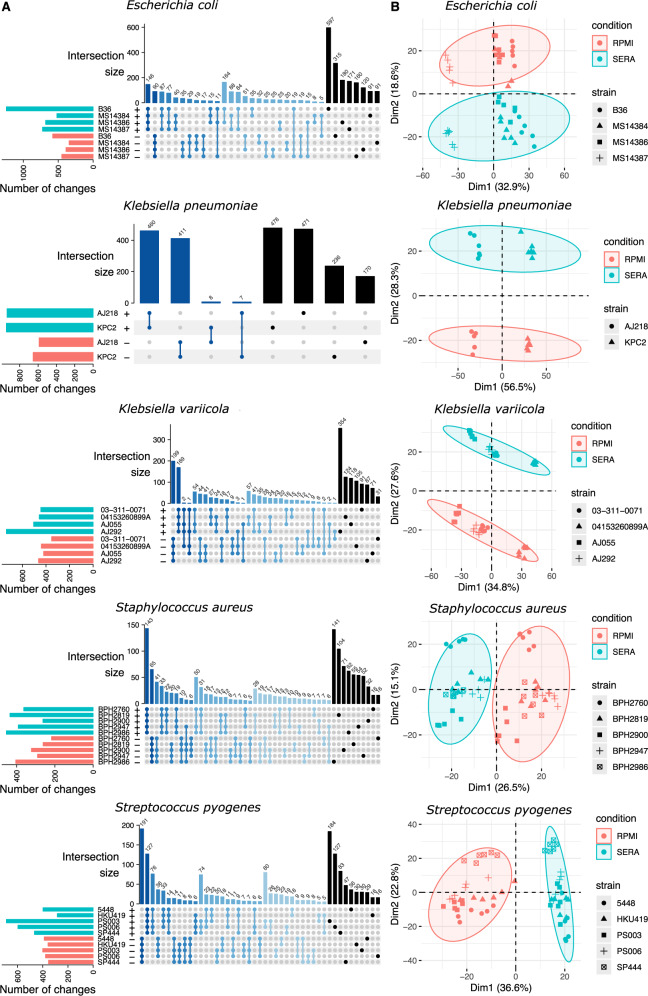
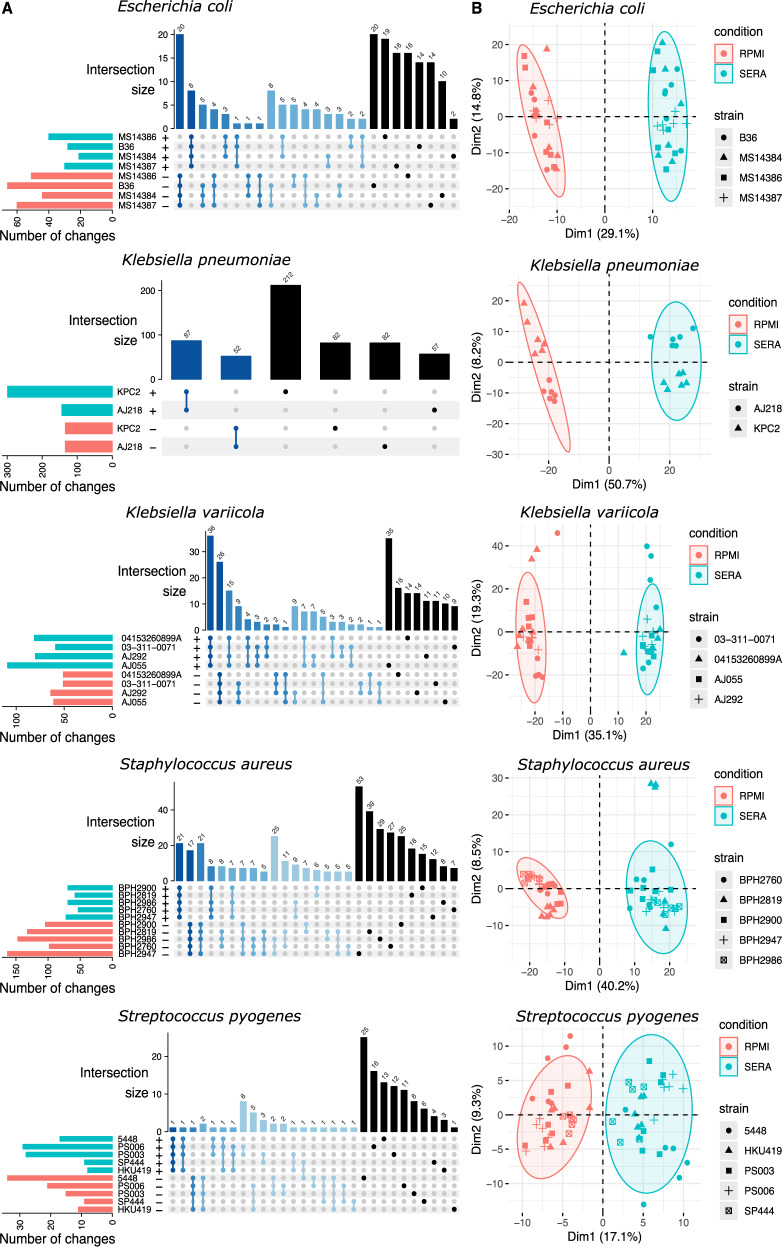
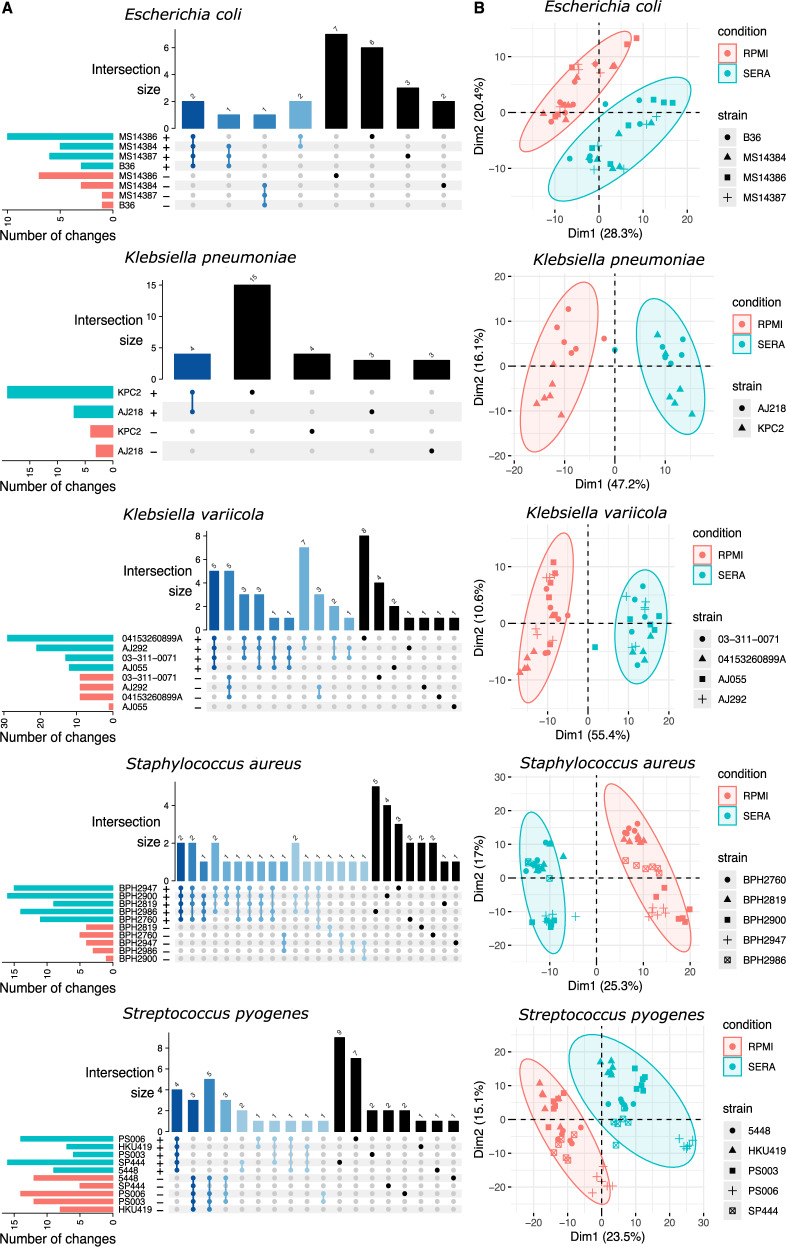
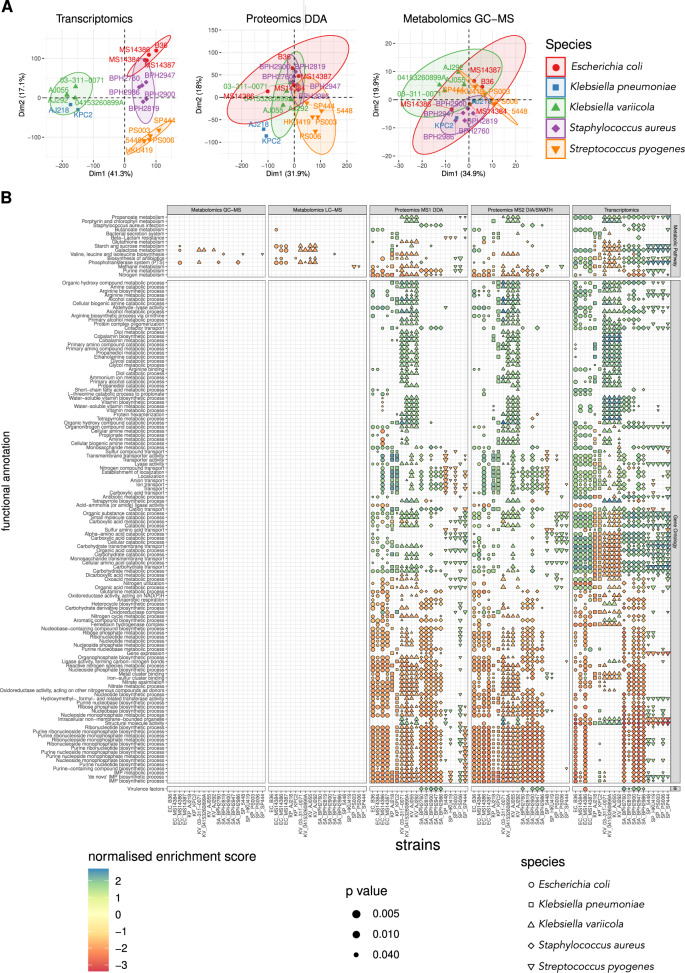
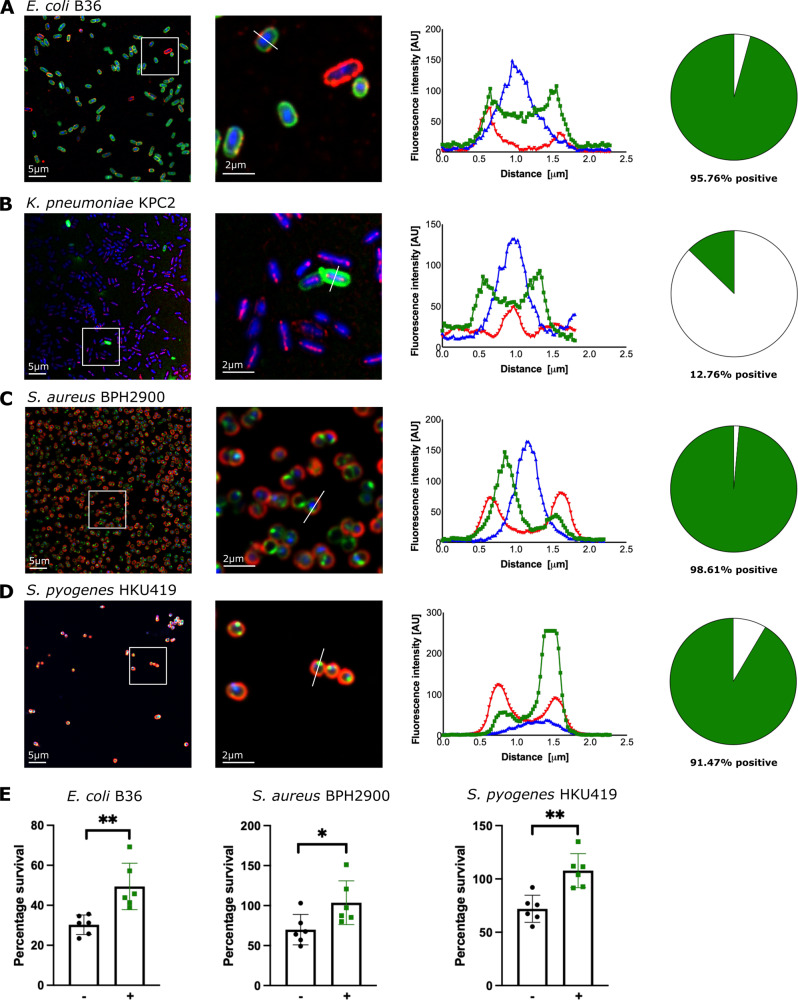
Even in the setting of optimal resuscitation in high-income countries severe sepsis and septic shock have a mortality of 20-40%, with antibiotic resistance dramatically increasing this mortality risk. To develop a reference dataset enabling the identification of common bacterial targets for therapeutic intervention, we applied a standardized genomic, transcriptomic, proteomic and metabolomic technological framework to multiple clinical isolates of four sepsis-causing pathogens: Escherichia coli, Klebsiella pneumoniae species complex, Staphylococcus aureus and Streptococcus pyogenes. Exposure to human serum generated a sepsis molecular signature containing global increases in fatty acid and lipid biosynthesis and metabolism, consistent with cell envelope remodelling and nutrient adaptation for osmoprotection. In addition, acquisition of cholesterol was identified across the bacterial species. This detailed reference dataset has been established as an open resource to support discovery and translational research.


Conflict of interest statement

The authors declare no competing interests.

Figures

Fig. 1
Fig. 1. Schematic of the experimental workflow employed in this study.
A sample of gDNA extracted from each strain of each species was split in order to prepare parallel sequencing libraries for both long-read (PacBio RSII) and short-read (Illumina MiSeq) sequencing. Biological replicates for transcriptomics, proteomics, and metabolomics were generated from a common glycerol stock for each strain of each species. Samples were batched in such a way that the same culture material was used to extract total RNA, proteins, and metabolites.
Fig. 2
Fig. 2. Genomic description, phylogenetic context, and shared protein orthologues of study strains.
The 20 complete genomes for A E. coli; B KpSC; C S. aureus; D S. pyogenes are illustrated. For each, the composition of the genome is illustrated as bubbles, with the chromosome represented by the largest bubble, with key features annotated, and the smaller bubbles representing plasmids, the size of which is a semi-quantitative representation of the plasmid size. The location of each genome in the respective phylogenetic trees for each species is illustrated; the tree representing all complete genomes for the species available in GenBank as of June 2020, and constructed using Mashree v1.1.2 based on the distance calculated from 50,000 k-mers. Clonal Groups (CG) and Clonal Complexes (CC) of interest for the species are annotated. Adjacent to each tree is an UpSet plot and a pie chart, illustrating the results of hierarchical protein orthologue clustering, performed with pirate v1.0.2. Predicted protein-coding sequences were clustered at five thresholds of amino acid identity (50%, 60%, 70%, 80%, 90%). The distribution of all orthologue clusters represented in a species at these thresholds is indicated in the pie chart. The sharing of orthologue clusters amongst the respective genomes (in various combinations or in isolation) is shown in the UpSet plot, ordered based on the frequency and coloured to match the genomes as illustrated in the phylogenetic trees. Asterisks (*) indicate the orthologue clusters that are conserved within a species (i.e., the ‘core’ cluster for each species). The corresponding list of core orthologue clusters is detailed in Supplementary Data 1 (E. coli), 2 (KpSC), 3 (S. aureus), and 4 (S. pyogenes). Combinations with less than ten shared orthologue clusters are not shown.
Fig. 3
Fig. 3. Conserved protein orthologues amongst genomes and associated functional analysis.
A comparison of protein orthologue clusters across the 20 genomes investigated is illustrated. A The sharing of orthologue clusters across species (in various combinations) or those conserved within a species are shown in the UpSet plot, ordered based on the frequency and coloured to match the genomes as illustrated in the phylogenetic trees in Fig. 2. Combinations with less than ten shared orthologue clusters are not shown. The asterisk (*) indicates the 125 orthologue clusters that were conserved across all 20 genomes. B Frequency for all 1882 GO terms associated with the 125 conserved clusters (top barplot). Those associated with >50% of these clusters (outlined in red) are highlighted in the enlarged plot (bottom barplot) with their functional annotations provided. A complete list of all GO and KEGG metabolic pathway terms associated with the 125 core clusters is provided in Supplementary Data 6.
Fig. 4
Fig. 4. RNA-seq to assess global serum exposure impacts on the transcriptome.
A UpSet plot representing the shared and distinctive transcriptional responses across strains of the same species. Only genes with significant differential expression after exposure to human serum are represented (FDR < 0.05; |log2 fold change | >1). Horizontal bars indicate the total number of significant changes per strain (top: up in serum, bottom: down in serum). Vertical bars represent the number of shared up/down genes across strains. Overlapping responses (intersections) are defined below the bars with connected dots. Darker blue bars represent intersections with higher numbers of strains and black bars the distinctive response for each strain. B Multidimensional scaling plots of the transcriptional responses of core genes across strains of the same species. Point shapes represent different strains and each point corresponds to an individual biological replicate. The colour of the points and ellipses differentiate cultured in RPMI from serum-exposed samples.
Fig. 5
Fig. 5. DDA mass spectrometry to assess the impact of serum exposure on the proteome within the different species.
A UpSet plot representing the shared and distinctive proteome responses across strains of the same species. Only proteins with significant differential abundance after exposure to human serum are represented (FDR < 0.05; |log2 fold change | >1). B Multidimensional scaling plots of the core protein responses across strains of the same species demonstrating a clear separation of serum exposed samples for all species. See Fig. 4 legend for a detailed explanation.
Fig. 6
Fig. 6. GC–MS analysis to assess the impact of serum exposure on the metabolome across the different species.
A UpSet plot represents the shared and distinctive metabolome responses across strains of the same species. Only metabolites with significant differential abundance after exposure to human serum are represented (FDR < 0.05; |log2 fold change | >1). B Multidimensional scaling plots of the core-metabolites responses across strains of the same species demonstrating a clear separation of serum exposed samples for all species. See Fig. 4 legend for a detailed explanation.
Fig. 7
Fig. 7. Functional and metabolic pathway enrichment analysis to assess the multi-omics response to serum.
A Principal component analysis representing the proximity of the functional responses to human serum exposure. The data compile the response of the 20 bacterial strains by transcriptomics, proteomics and metabolomics. B Dot heatmap representing the shared enrichment of GO terms and KEGG pathways across all strains and the different omics. Shapes and colours represent normalised enrichment scores as calculated using Gene Set Enrichment Analysis and adjusting for multiple hypothesis testing, and indicate up (blue) and down (red) regulated functions or pathways in serum. Only enriched GO terms and KEGG metabolic pathways significantly enriched in 50% of all strains and across at least two omics datasets are represented.
Fig. 8
Fig. 8. Quantification of the interaction of bacterial sepsis strains with cholesterol and protection from antimicrobial peptide killing.
Each of the indicated bacterial strains was grown for 2 h in RPMI in the presence of 10 μM TopFluor-cholesterol (a fluorescent cholesterol analogue (AD) or 10 μM cholesterol (E). AD show an overview (left panel) and magnified view (adjacent panel) of E. coli B36 (first row), K. pneumoniae KPC2 (second row), S. aureus BPH2900 (third row) and S. pyogenes HKU419 (fourth row). TopFluor-cholesterol is shown in green, the bacteria are stained using different antibodies and alexa555 (red) and the nuclei are stained using DAPI (blue). The histogram of the fluorescence intensity of one representative bacterium is shown (third column). A representative cross-section for fluorescence analysis is provided from the magnified view panel. Pie graphs showing the percentage of the respective bacteria associated with cholesterol (green area, right column) from three independent experiments with the following total number of individual bacteria: E. coli B36 (n = 1045), K. pneumoniae KPC2 (n = 1169), S. aureus BPH2900 (n = 1140) and S. pyogenes HKU419 (n = 1047). E LL-37-mediated killing of E. coli B36, S. aureus BPH2900 and S. pyogenes HKU419 cells post cholesterol (10 µM) exposure. Strains were challenged at the LL-37 MIC (B36 = 32 µg/mL; BPH2900 = 512 µg/mL; HKU419 = 32 µg/mL) for 1 h in CA-MHB and percentage survival was determined by CFU enumeration. Error bars indicate the standard deviation of the mean from six biological replicates, *P < 0.05; **P < 0.01, two-sided Mann–Whitney test.

References

    1. GBD 2017 Mortality Collaborators. Global, regional, and national age-sex-specific mortality and life expectancy, 1950–2017: a systematic analysis for the Global Burden of Disease Study 2017. Lancet Lond. Engl. 2018;392:1684–1735. doi: 10.1016/S0140-6736(18)31891-9. - DOI - PMC - PubMed
    1. Singer M, et al. The third international consensus definitions for sepsis and septic shock (Sepsis-3) JAMA. 2016;315:801–810. doi: 10.1001/jama.2016.0287. - DOI - PMC - PubMed
    1. Liu V, et al. Hospital deaths in patients with sepsis from 2 independent cohorts. JAMA. 2014;312:90–92. doi: 10.1001/jama.2014.5804. - DOI - PubMed
    1. Kaukonen K-M, Bailey M, Suzuki S, Pilcher D, Bellomo R. Mortality related to severe sepsis and septic shock among critically ill patients in Australia and New Zealand, 2000–2012. JAMA. 2014;311:1308–1316. doi: 10.1001/jama.2014.2637. - DOI - PubMed
    1. Australian Bureau of Statistics. Causes of Death (Australian Bureau of Statistics, Australia, 2019).

Publication types

Substances