. 2023 Mar 18;10(1):144.
doi: 10.1038/s41597-023-01974-x.

Evaluating explainability for graph neural networks

Affiliations

Evaluating explainability for graph neural networks

Chirag Agarwal et al. Sci Data. .

Abstract

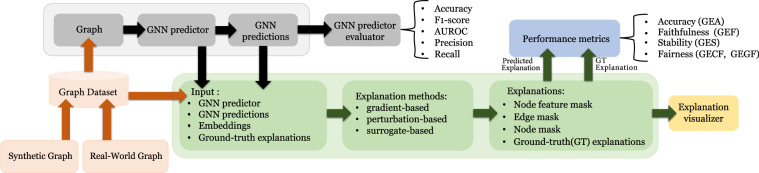
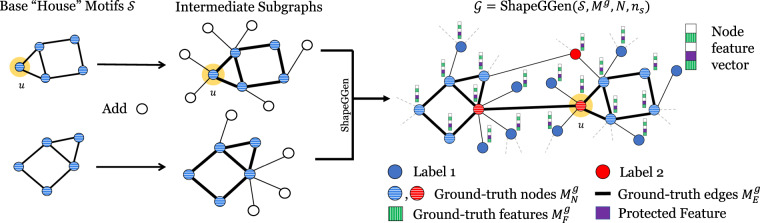
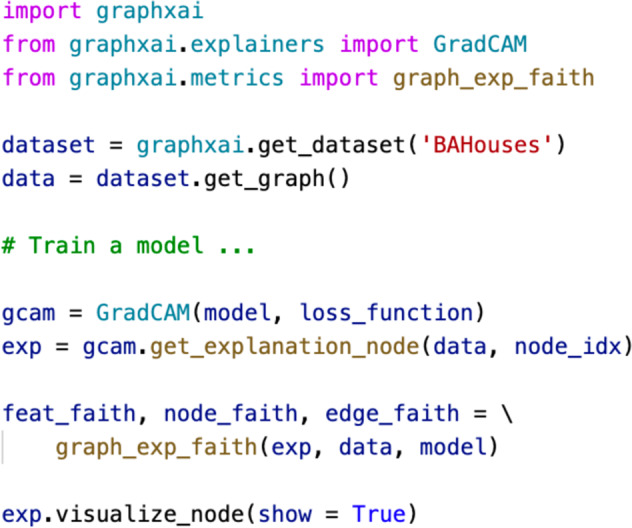
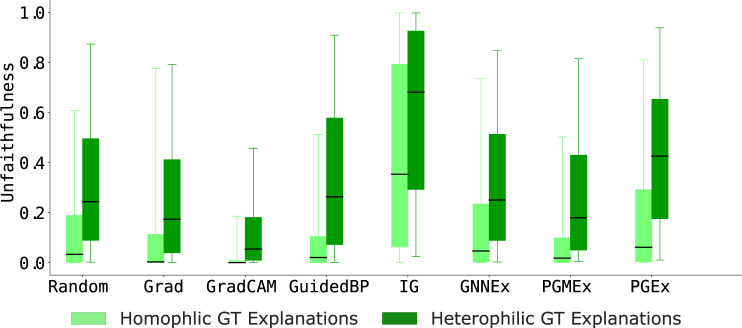
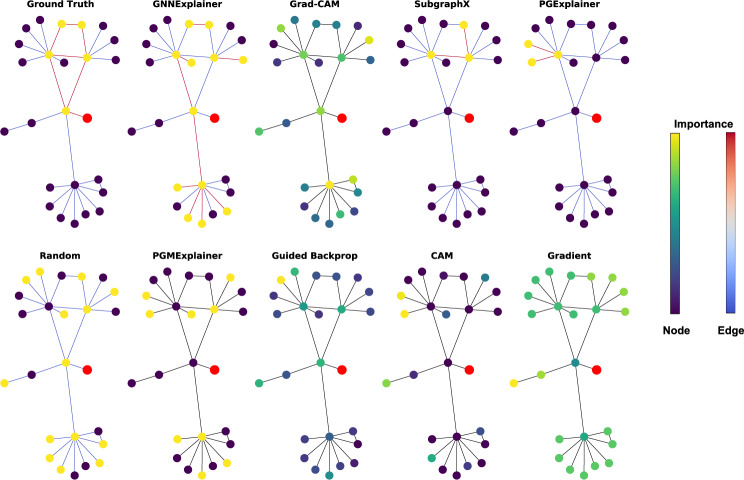
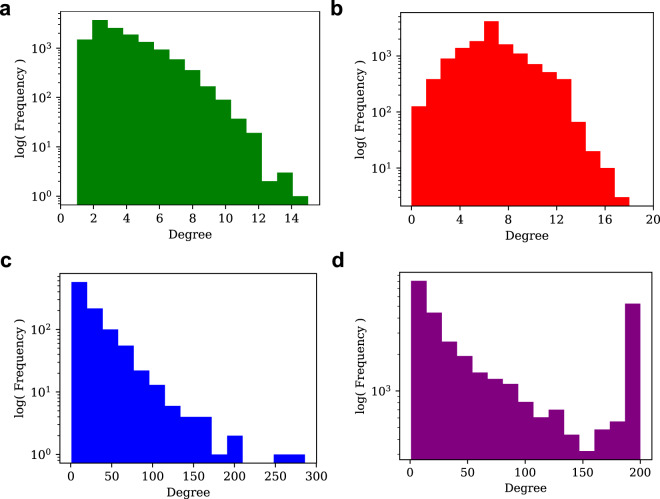
As explanations are increasingly used to understand the behavior of graph neural networks (GNNs), evaluating the quality and reliability of GNN explanations is crucial. However, assessing the quality of GNN explanations is challenging as existing graph datasets have no or unreliable ground-truth explanations. Here, we introduce a synthetic graph data generator, SHAPEGGEN, which can generate a variety of benchmark datasets (e.g., varying graph sizes, degree distributions, homophilic vs. heterophilic graphs) accompanied by ground-truth explanations. The flexibility to generate diverse synthetic datasets and corresponding ground-truth explanations allows SHAPEGGEN to mimic the data in various real-world areas. We include SHAPEGGEN and several real-world graph datasets in a graph explainability library, GRAPHXAI. In addition to synthetic and real-world graph datasets with ground-truth explanations, GRAPHXAI provides data loaders, data processing functions, visualizers, GNN model implementations, and evaluation metrics to benchmark GNN explainability methods.


Conflict of interest statement

The authors declare no competing interests.

Figures

Fig. 1
Fig. 1
Overview of GraphXAI. GraphXAI provides data loader classes for XAI-ready synthetic and real-world graph datasets with ground-truth explanations for evaluating GNN explainers, implementations of explanation methods, visualization functions for GNN explainers, utility functions to support new GNN explainers, and a diverse set of performance metrics to evaluate the reliability of explanations generated by GNN explainers.
Fig. 2
Fig. 2
Overview of ShapeGGen graph dataset generator. ShapeGGen is a novel dataset generator for graph-structured data that can be used to benchmark graph explainability methods using ground-truth explanations. Graphs are created by combining subgraphs containing any given motif and additional nodes. The number of motifs in a k-hop neighborhood determines the node label (in the figure, we use a 1-hop neighborhood for labeling, and nodes with two motifs in its 1-hop neighborhood are highlighted in red). Feature explanations are some masks over important node features (green striped), with an option to add a protected feature (shown in purple) whose correlation to node labels is controllable. Node explanations are nodes contained in the motifs (horizontal striped nodes) and edge explanations (bold lines) are edges connecting nodes within motifs.
Fig. 3
Fig. 3
Example use case of the GraphXAI package. An example of explaining a prediction in the GraphXAI package. With just a few lines of code, one can calculate an explanation for a node or graph, calculate metrics based on that explanation, and visualize the explanation.
Fig. 4
Fig. 4
Unfaithfulness scores across eight GNN explainers on SG-Heterophilic graph dataset consisting of either homophilic or heterophilic ground-truth (GT) explanations. GNN explainers produce more faithful explanations (lower GEF scores) on homophilic graphs than heterophilic graphs, revealing an important limitation of existing GNN explainers.
Fig. 5
Fig. 5
Unfaithfulness scores across eight GNN explainers on SG-SmallEx graph dataset with smaller (triangle shapes) or (house shapes) ground-truth (GT) explanations. Results show that GNN explainers produce more faithful explanations (lower GEF scores) on graphs with smaller GT explanations than on graphs with larger GT explanations.
Fig. 6
Fig. 6
Counterfactual fairness mismatch scores across eight GNN explainers on SG-Unfair graph dataset with weakly-unfair or strongly-unfair ground-truth (GT) explanations. Results show that explanations produced on graphs with strongly-unfair ground-truth explanations do not preserve fairness and are sensitive to flipping/modifying the protected node feature.
Fig. 7
Fig. 7
Unfaithfulness scores across five GNN explainers that produce node feature explanations. Every GNN explainer is evaluated on three datasets whose network topology is equivalent to SG-Base and by varying the ratio between informative and redundant node features: most informative node features, control node features, and least informative node features. Results show that across all explainers, unfaithfulness decreases as the proportion of informative to redundant features increases, with explainers trained on the graph with the most informative node features having consistently lower unfaithfulness scores than explainers trained on graphs with the least informative node features.
Fig. 8
Fig. 8
Visualization of four explainers from the G-XAI Bench library on the BA-Shapes dataset. The visualization is for explaining the prediction of node u. We show the L + 1-hop around node u, where L is the number of layers of the GNN model predicting on the dataset. Two color bars indicate the intensity of attribution scores for the node and edge explanations. Note that edge importance is not defined for every method, so edges are set to black to indicate that the method does not provide edge scores. Visualization tools are a native part of the GraphXAI package, including user-friendly functions graphxai.Explanation.visualize_node and graphxai.Explanation.visualize_graph to visualize GNN explanations. The visualization tools in GraphXAI allow users to compare the explanations of different GNN explainers, such as gradient-based methods (Gradient and Grad-CAM) and perturbation-based methods (GNNExplainer and SubgraphX).
Fig. 9
Fig. 9
Example of a particularly challenging example in a ShapeGGen dataset. All explanation methods that output node-wise importance scores are shown, including the ground-truth explanation at the top of the figure. Importance and edge scores are highlighted by relative value across each explanation method, as shown by the scales at right in the figure. The central node, i.e., the node being classified in this example, is shown in red on each subgraph. Visualizations are generated by graphxai.Explanation.visualize_node, a function native to the graphxai package. Some explainers can capture portions of the ground-truth explanation, such as SubgraphX and GNNExplainer, but others attribute no importance to the ground-truth shape, such as CAM and Gradient.
Fig. 10
Fig. 10
Comparison of degree distribution for (a) ShapeGGen dataset (SG-Base), (b) random Erdös-Rényi graph (p = 5 × 10−4) graph, (c) German Credit dataset, and (d) Credit Defaulter dataset. All plots are shown with a log scale of frequency for the y-axis. SG-Base and both real-world graphs show a power-law degree distribution commonly observed in real-world datasets exhibiting preferential attachment properties. Datasets generated by ShapeGGen are designed to present power-law degree distributions to match real-world dataset topologies, such as those observed in German Credit and Credit Defaulter. The degree distribution of SG-Base is much different than the binomial distribution exhibited in Erdös-Rényi graph (b), an unstructured random graph model.

References

    1. Agarwal, C., Lakkaraju, H. & Zitnik, M. Towards a unified framework for fair and stable graph representation learning. In UAI (2021).
    1. Sanchez-Lengeling et al. Evaluating attribution for graph neural networks. NeurIPS (2020).
    1. Giunchiglia, V., Shukla, C. V., Gonzalez, G. & Agarwal, C. Towards training GNNs using explanation directed message passing. In The First Learning on Graphs Conference (2022).
    1. Morselli Gysi, D. et al. Network medicine framework for identifying drug-repurposing opportunities for covid-19. Proceedings of the National Academy of Sciences (2021). - PMC - PubMed
    1. Zitnik, M., Agrawal, M. & Leskovec, J. Modeling polypharmacy side effects with graph convolutional networks. In Bioinformatics (2018). - PMC - PubMed