

Quantitative muscle MRI displays clinically relevant myostructural abnormalities in long-term ICU-survivors: a case-control study
- PMID: 36934222
- PMCID: PMC10024415
- DOI: 10.1186/s12880-023-00995-7
Quantitative muscle MRI displays clinically relevant myostructural abnormalities in long-term ICU-survivors: a case-control study
Abstract
Background: Long-term data on ICU-survivors reveal persisting sequalae and a reduced quality-of-life even after years. Major complaints are neuromuscular dysfunction due to Intensive care unit acquired weakness (ICUAW). Quantitative MRI (qMRI) protocols can quantify muscle alterations in contrast to standard qualitative MRI-protocols.
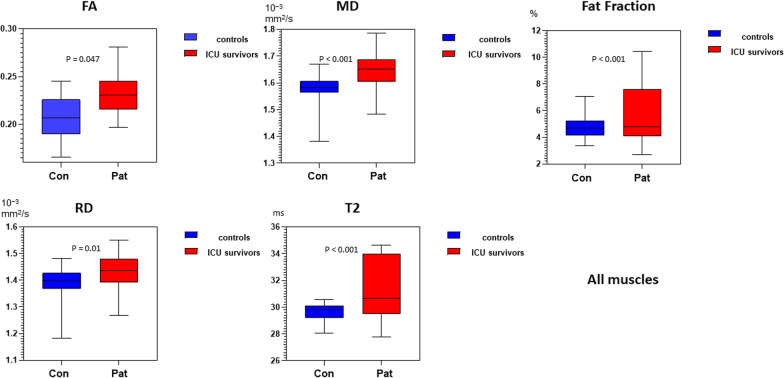
Methods: Using qMRI, the aim of this study was to analyse persisting myostructural abnormalities in former ICU patients compared to controls and relate them to clinical assessments. The study was conducted as a cohort/case-control study. Nine former ICU-patients and matched controls were recruited (7 males; 54.8y ± 16.9; controls: 54.3y ± 11.1). MRI scans were performed on a 3T-MRI including a mDTI, T2 mapping and a mDixonquant sequence. Water T2 times, fat-fraction and mean values of the eigenvalue (λ1), mean diffusivity (MD), radial diffusivity (RD) and fractional anisotropy (FA) were obtained for six thigh and seven calf muscles bilaterally. Clinical assessment included strength testing, electrophysiologic studies and a questionnaire on quality-of-life (QoL). Study groups were compared using a multivariate general linear model. qMRI parameters were correlated to clinical assessments and QoL questionnaire using Pearson´s correlation.
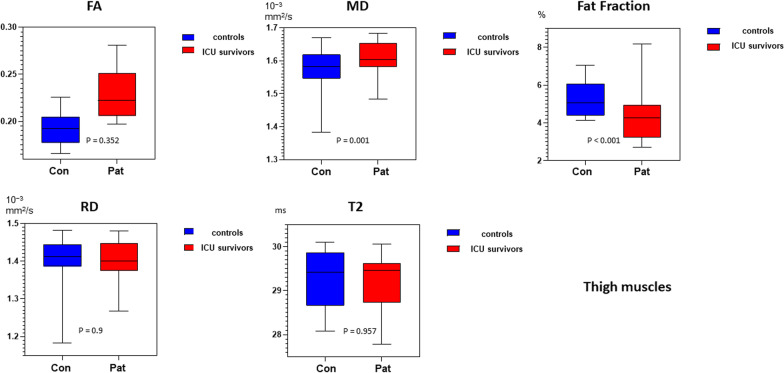
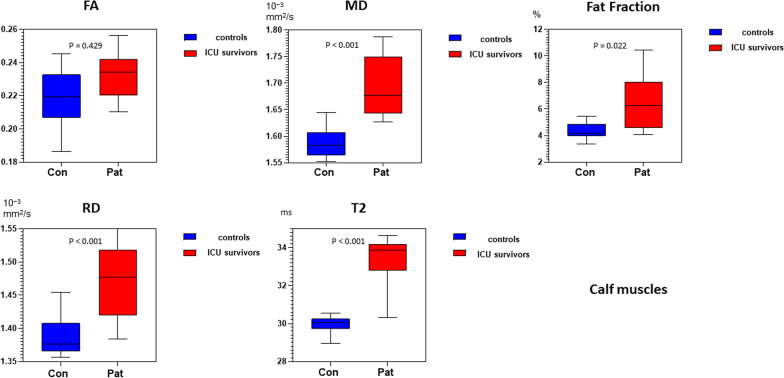
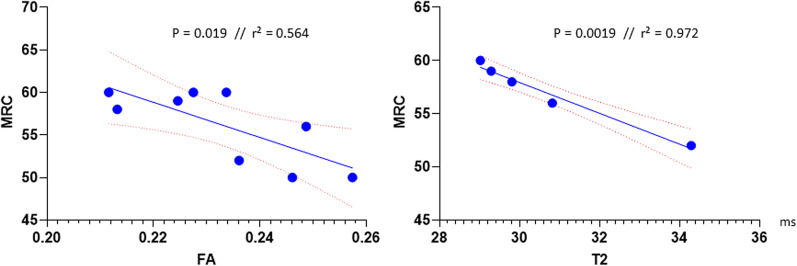
Results: qMRI parameters were significantly higher in the patients for fat-fraction (p < 0.001), water T2 time (p < 0.001), FA (p = 0.047), MD (p < 0.001) and RD (p < 0.001). Thighs and calves showed a different pattern with significantly higher water T2 times only in the calves. Correlation analysis showed a significant negative correlation of muscle strength (MRC sum score) with FA and T2-time. The results were related to impairment seen in QoL-questionnaires, clinical testing and electrophysiologic studies.
Conclusion: qMRI parameters show chronic next to active muscle degeneration in ICU survivors even years after ICU therapy with ongoing clinical relevance. Therefore, qMRI opens new doors to characterize and monitor muscle changes of patients with ICUAW. Further, better understanding on the underlying mechanisms of the persisting complaints could contribute the development of personalized rehabilitation programs.
Keywords: Critical illness myopathy; Critical illness neuropathy; Fat fraction; ICUAW; Muscle diffusion tensor imaging; Quantitative MRI; T2 mapping.
© 2023. The Author(s).
Conflict of interest statement
The authors declare that they have no competing interests.
Figures

References
-
- Meyer-Frießem CH, Malewicz NM, Rath S, Ebel M, Kaisler M, Tegenthoff M, et al. Incidence, time course and influence on quality of life of intensive care unit-acquired weakness symptoms in long-term intensive care survivors. J Intensive Care Med. 2021;36(11):1313–1322. doi: 10.1177/0885066620949178. - DOI - PubMed
Publication types
MeSH terms
Substances
LinkOut - more resources
Full Text Sources
Miscellaneous
