. 2023 Mar 18;11(1):45.
doi: 10.1186/s40478-023-01541-w.

The localization of molecularly distinct microglia populations to Alzheimer's disease pathologies using QUIVER

Affiliations

The localization of molecularly distinct microglia populations to Alzheimer's disease pathologies using QUIVER

Ryan K Shahidehpour et al. Acta Neuropathol Commun. .

Abstract

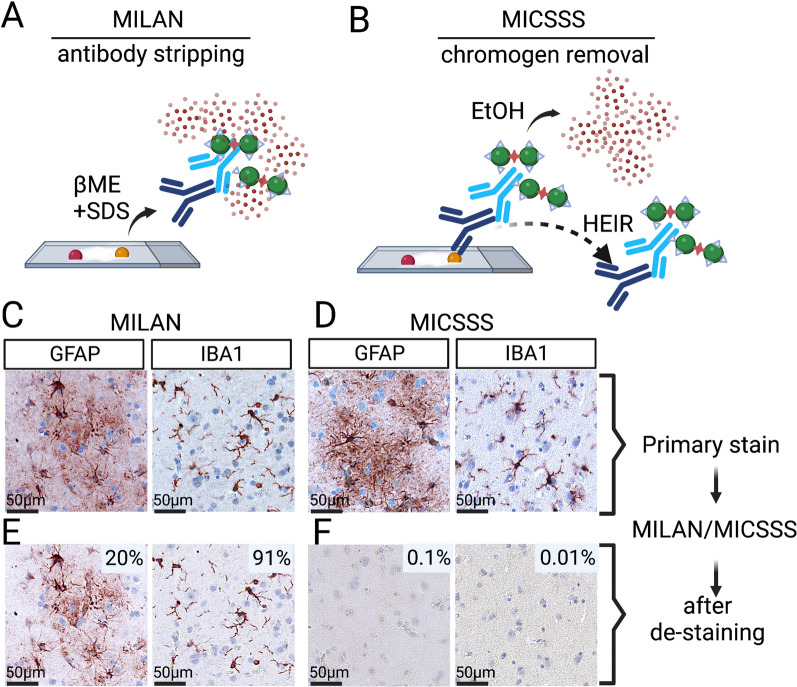
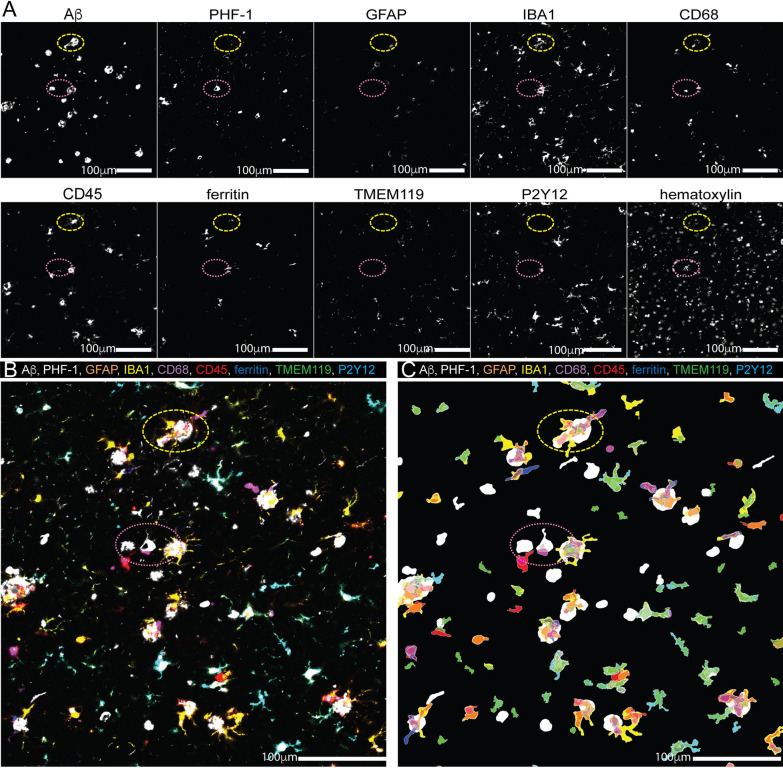
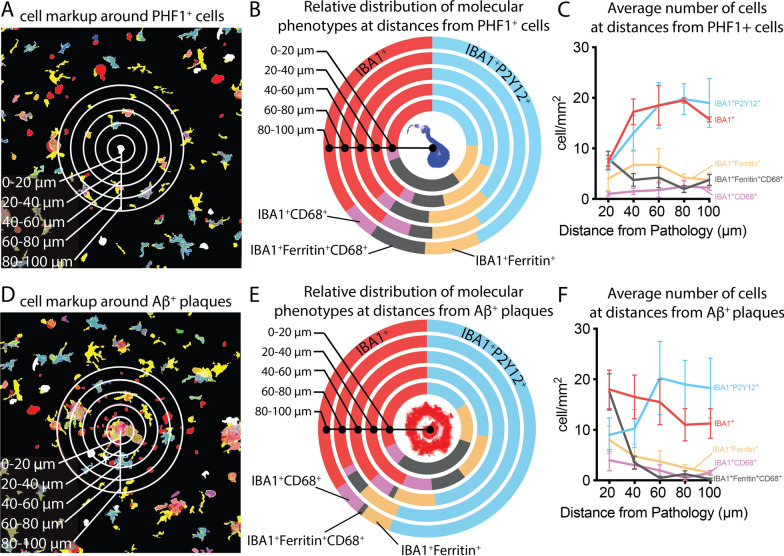
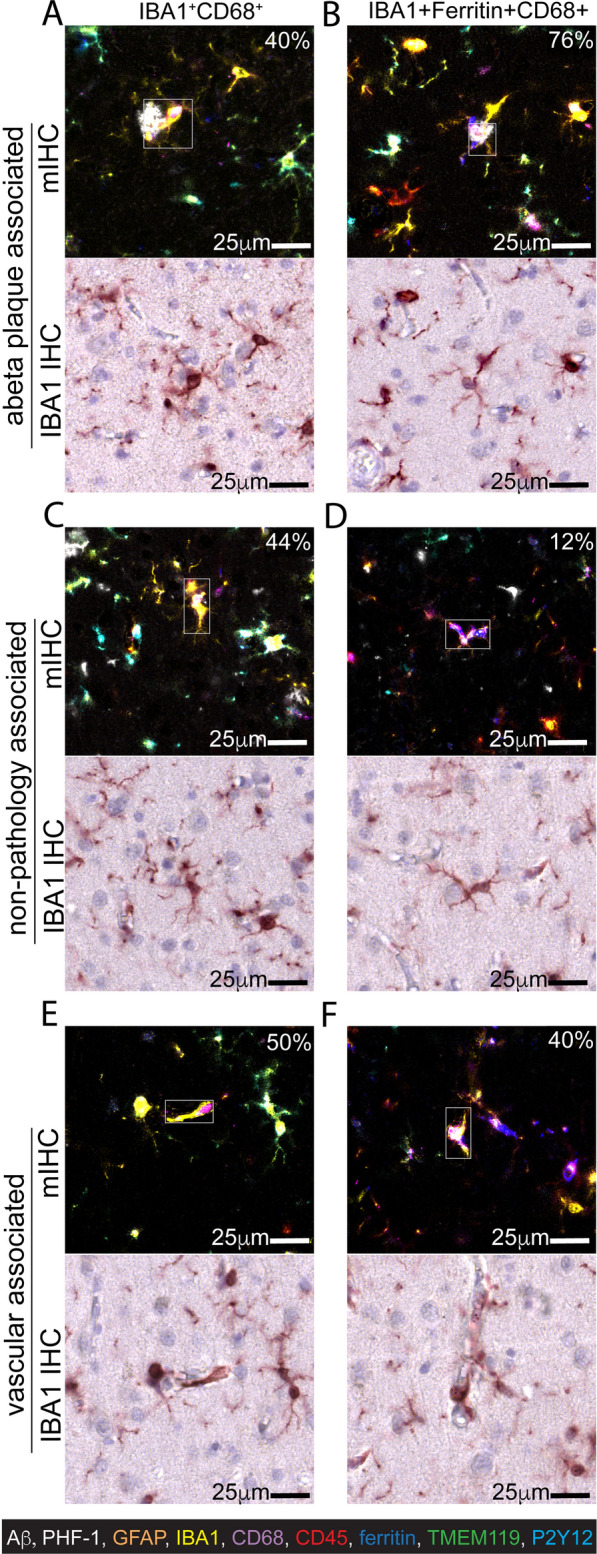
New histological techniques are needed to examine protein distribution in human tissues, which can reveal cell shape and disease pathology connections. Spatial proteomics has changed the study of tumor microenvironments by identifying spatial relationships of immunomodulatory cells and proteins and contributing to the discovery of new cancer immunotherapy biomarkers. However, the fast-expanding toolkit of spatial proteomic approaches has yet to be systematically applied to investigate pathological alterations in the aging human brain in health and disease states. Moreover, post-mortem human brain tissue presents distinct technical problems due to fixation procedures and autofluorescence, which limit fluorescence methodologies. This study sought to develop a multiplex immunohistochemistry approach (visualizing the immunostain with brightfield microscopy). Quantitative multiplex Immunohistochemistry with Visual colorimetric staining to Enhance Regional protein localization (QUIVER) was developed to address these technical challenges. Using QUIVER, a ten-channel pseudo-fluorescent image was generated using chromogen removal and digital microscopy to identify unique molecular microglia phenotypes. Next, the study asked if the tissue environment, specifically the amyloid plaques and neurofibrillary tangles characteristic of Alzheimer's disease, has any bearing on microglia's cellular and molecular phenotypes. QUIVER allowed the visualization of five molecular microglia/macrophage phenotypes using digital pathology tools. The recognizable reactive and homeostatic microglia/macrophage phenotypes demonstrated spatial polarization towards and away from amyloid plaques, respectively. Yet, microglia morphology appearance did not always correspond to molecular phenotype. This research not only sheds light on the biology of microglia but also offers QUIVER, a new tool for examining pathological alterations in the brains of the elderly.

Keywords: Digital pathology; Glia; Histology; Multiplexed tissue imaging; Neurodegenerative disease; Neuropathology; Single-cell analysis.


Conflict of interest statement

The authors declare that they have no competing interests.

Figures

Fig. 1
Fig. 1
Comparison of two mIHC protocols for use in human FFPE tissue. (A) The multiple interactive labeling by antibody neodeposition (MILAN) method uses β-mercaptoethanol and sodium dodecyl sulfate (βME + SDS) to strip the antibody complex. (B) The multiplexed immunohistochemical consecutive staining on a single slide (MICSSS) uses ethanol (EtOH) to wash out the chromogen. Heat-induced epitope retrieval (HIER) is predicted to elute the antibody partially. (C, D) GFAP and IBA1 were stained on serial sections of human FFPE brain tissue. Following the MILAN or MICSSS procedure the slide were re-imaged. (E) 20% of GFAP staining and 90% of IBA1 staining were found across the entire tissue section following the MILAN method. (F) The MICSSS method effectively reduced the re-development of GFAP and IBA1 to less than 0.1%
Fig. 2
Fig. 2
Blocking step optimization to limit antibody cross-reactivity. (A) Experimental workflow for antibody cross-reactivity test: (1) Indirect IHC is completed using an ethanol-soluble chromogen. (2) The digital slide is generated using a slide-scanning microscope. (3) The chromogen is removed using the chemical de-staining method. (4) The slide is then visually inspected to confirm the de-staining was ~ 100% efficient. (5) Additional blocking steps are added to limit cross-reactivity. (6) The tissue is stained following step 1, omitting the primary antibody. (7) A digital slide is created, and (8) digital pathological tools are used to quantify the percentage of cross-reactivity by co-registration and direct comparison of the image from step 2 to the image in step 8. (B) Avidin and biotin (A&B) blocking conditions were tested (Table 2). The photomicrographs show a comparison of the GFAP staining between the best A&B block condition versus the omission of the A&B blocking step. Digital neuropathological quantification of the area fraction of GFAP+ staining show that approximately 35% of the staining remains if the A&B blocking step is omitted. (C) The effect of varying the FAB blocking conditions (Table 2) were tested while holding the best A&B blocking condition from B constant. A high degree (46%) of GFAP+ staining was seen in samples lacking the FAB blocking step following re-staining whit the secondary antibody alone. By area fraction digital quantification, the degree of re-development of the GFAP staining was further blocked beyond the optimized A&B conditions using a higher concentration of FAB a incubating the samples in a greater volume of the blocking solution
Fig. 3
Fig. 3
Effects of mIHC protocol on antigenicity following repeated rounds of staining. (A) Serial sections of a Tissue microarray containing human brain samples from individuals with ADRC-NC were stained with rabbit-anti-P2Y12 or guinea pig-anti-IBA1 for the first round (1°) of staining. Digitalizing the side was followed by the refined MICSSS protocol and a second (2°) round of staining. Arrows indicated IBA1+P2Y12 cells. The number of cells in each case on the TMA was quantified using the object colocalization algorithm (HALO 3.4). By a paired t-test, no statistical difference was seen for between 1° or 2° rounds of staining the number of IBA1+ cells (B) or P2Y12+ cells
Fig. 4
Fig. 4
Panel of antibodies used from mIHC. FFPE human brain tissue was stained with antibodies used for the mIHC. The primary stain (1°) is shown, along with the image of the same section following the MICSSS de-staining, and then re-staining omitting the primary antibody. The order of antibody from left to right shows the order used on the mIHC panel. Using a HALO Area Quantification algorithm across the entire tissue section found, less than 0.03% of the primary stain, or other background noise, was detected in the de-stained and redeveloped tissue for all markers. Scale bar = 50 μm
Fig. 5
Fig. 5
Comparison of single and sequential histological staining in glia-associated markers. Representative photomicrographs in similar regions from neighboring FFPE sections of the same sMTG tissue block, show comparative staining for the selected glial-associated stains. During each round of staining, tissue was stained alone as a positive control and sequentially using the multiplex staining method to show there is little to-no loss in antigenicity or stainability in subsequent rounds of staining. The difference in the area quantification of staining between the multiplex vs. single stain was 0.5% or less. The single stain and multiplex stain analysis was done on serial sections of the same sMTG tissue block; however, there may be a separation of up to 100 μm in the z dimension between sections. Photomicrographs were captured at × 10 magnification. Scalebar is 50 μm
Fig. 6
Fig. 6
QUIVER image registry and cell identification. (A) Pseudocolored images were created from deconvolved single-channel IHC images. (B) The images were aligned using HALO software and generating a ten-channel image (nine antibodies and hematoxylin). (C) Cell/object count data, including marker co-expression, were generated using the object colocalization algorithm. Label colors coincide with representative color in markup image and merged image. Yellow dashed oval highlights a representative amyloid plaques and pink doted oval highlights a representative of tau tangles shown in all images
Fig. 7
Fig. 7
Identifying of microglia/macrophage phenotypes in human FFPE brain tissue using QUIVER. (A) Microglia/macrophages were grouped into one of five phenotypes based on unique marker expression. Human gray matter was analyzed to determine how many cells showed those phenotypes on average using the HALO object colocalization algorithm. (BF) The pseudo-fluorescent images were created from deconvolved single-channel IHC images. IBA1 (yellow), P2Y12 (green), ferritin (blue), and CD68 (magenta) were included in the pseudo-fluorescent images. The white box indicates a cell that expressed the different marker classes, as determined by the HALO object colocalization algorithm. The other cells in the micrograph may not share the same cell phenotype. The original brightfield image of the IBA1 IHC is shown for the cell highlighted in the box to highlight differences and similarities in the IBA1+ cellular morphology among the molecular distinct microglia/macrophage phenotypes. Scale bar = 25 μm
Fig. 8
Fig. 8
Digital proximity analysis of microglia/macrophage phenotypes to PHF-1+ tangles and Aβ+ plaques. (A) The Halo software generated markup shows the few cellular profiles within 60 μm of the PHF-1+ cell. (B) The Halo proximity analysis defined the relative percentage of the five microglia/macrophage phenotypes at each distance interval from the PHF-1+ cell. (C) The average number of cells at the distance intervals away from the PHF-1+ cell. (D) Near an Aβ+, plaque there is a high density of cells. (E) Nearest the plaque the IBA1 + Ferritin + CD68+ cell, and the IBA1+ phenotypes account for the majority of the plaque-associated cells. (F) The number of microglia/macrophage at the distance interval shows the polarization of marker expression that occurs around 50 μm from the plaque. The results are for 942 and 890 IBA1+ cells for figures A-C and D-F, respectively
Fig. 9
Fig. 9
Spatial characterization of molecularly distinct microglia/macrophage phenotypes in relation to pathology and vascular profiles. A representative example of the nine-color multiplex IHC and single-color IBA1 IHC for IBA1+CD68+ (A, C, E) and IBA1+Ferritin+CD68+ (B, D, F) cells associated with Aβ plaques (A, B) non-plaque or PHF-1 associated (C, D), or vascular associated (E, F). The percent of the cells associated with pathology, non-pathology, or blood vessels is indicated on the image. A total of 1382 IBA1+ cells were included in the analysis

References

    1. Andreasson KI, Bachstetter AD, Colonna M, Ginhoux F, Holmes C, Lamb B, Landreth G, Lee DC, Low D, Lynch MA, et al. Targeting innate immunity for neurodegenerative disorders of the central nervous system. J Neurochem. 2016;138:653–693. doi: 10.1111/jnc.13667. - DOI - PMC - PubMed
    1. Leng F, Edison P. Neuroinflammation and microglial activation in Alzheimer disease: where do we go from here? Nat Rev Neurol. 2021;17:157–172. doi: 10.1038/s41582-020-00435-y. - DOI - PubMed
    1. Paolicelli RC, Sierra A, Stevens B, Tremblay ME, Aguzzi A, Ajami B, Amit I, Audinat E, Bechmann I, Bennett M, et al. Microglia states and nomenclature: a field at its crossroads. Neuron. 2022;110:3458–3483. doi: 10.1016/j.neuron.2022.10.020. - DOI - PMC - PubMed
    1. Pimenova AA, Raj T, Goate AM. Untangling genetic risk for Alzheimer's disease. Biol Psychiatry. 2018;83:300–310. doi: 10.1016/j.biopsych.2017.05.014. - DOI - PMC - PubMed
    1. De Smet F, Martinez AA, Bosisio FM. Next-generation pathology by multiplexed immunohistochemistry. Trends Biochem Sci. 2021;46:80–82. doi: 10.1016/j.tibs.2020.09.009. - DOI - PubMed

Publication types

Substances