. 2023 Mar 18;42(1):67.
doi: 10.1186/s13046-023-02628-x.

Guadecitabine increases response to combined anti-CTLA-4 and anti-PD-1 treatment in mouse melanoma in vivo by controlling T-cells, myeloid derived suppressor and NK cells

Affiliations

Guadecitabine increases response to combined anti-CTLA-4 and anti-PD-1 treatment in mouse melanoma in vivo by controlling T-cells, myeloid derived suppressor and NK cells

Adriana Amaro et al. J Exp Clin Cancer Res. .

Abstract

Background: The combination of Programmed Cell Death 1 (PD-1) and Cytotoxic T-Lymphocyte Antigen 4 (CTLA-4) blockade has dramatically improved the overall survival rate for malignant melanoma. Immune checkpoint blockers (ICBs) limit the tumor's immune escape yet only for approximately a third of all tumors and, in most cases, for a limited amount of time. Several approaches to overcome resistance to ICBs are being investigated among which the addition of epigenetic drugs that are expected to act on both immune and tumor cells. Guadecitabine, a dinucleotide prodrug of a decitabine linked via phosphodiester bond to a guanosine, showed promising results in the phase-1 clinical trial, NIBIT-M4 (NCT02608437).

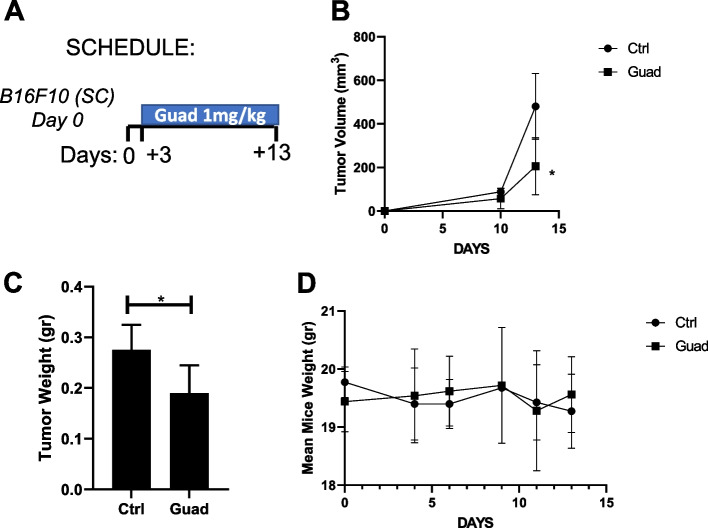
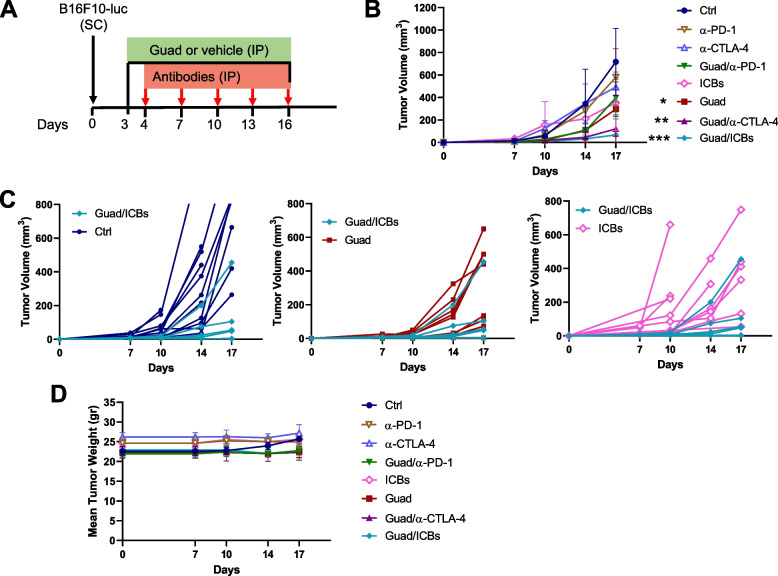
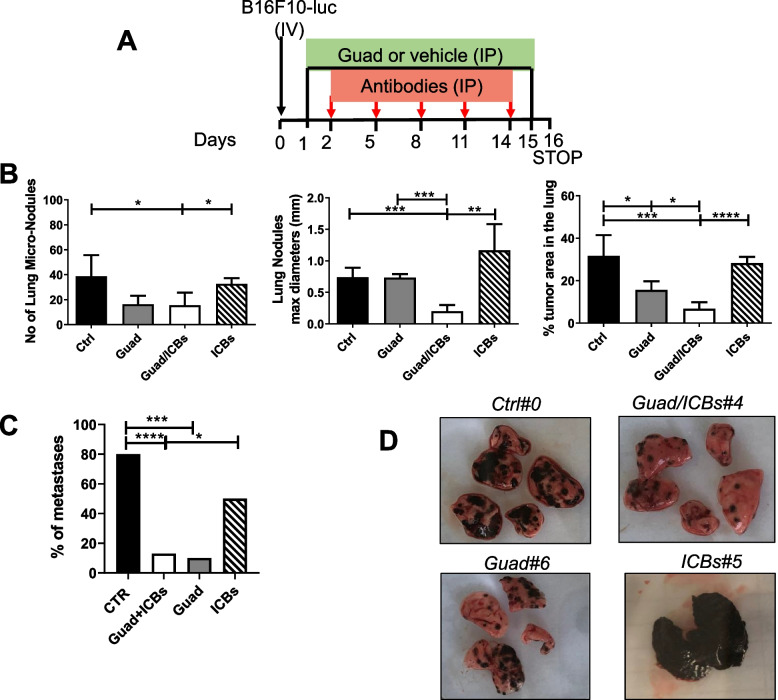
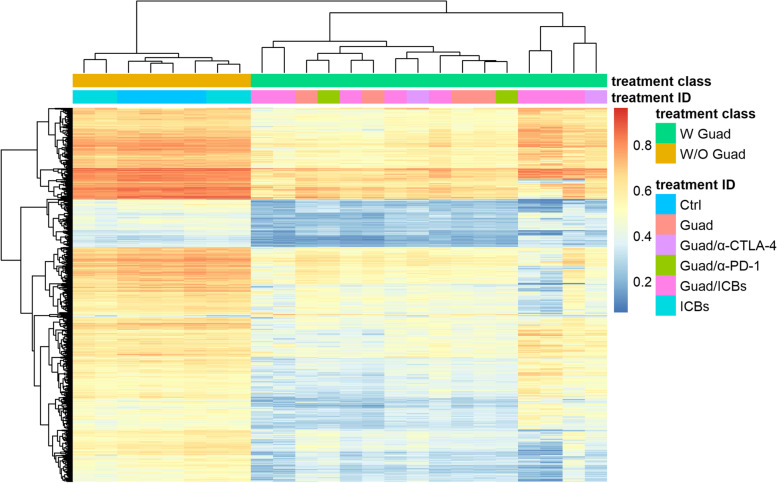
Methods: We used the syngeneic B16F10 murine melanoma model to study the effects of immune checkpoint blocking antibodies against CTLA-4 and PD-1 in combination, with and without the addition of Guadecitabine. We comprehensively characterized the tumor's and the host's responses under different treatments by flow cytometry, multiplex immunofluorescence and methylation analysis.

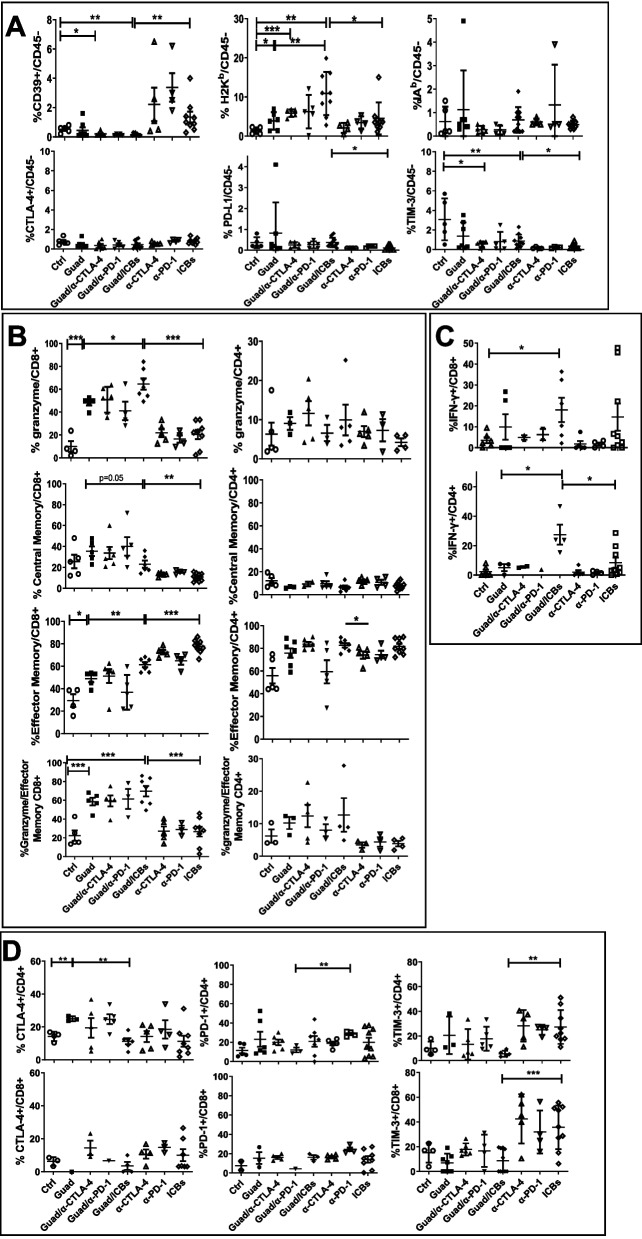
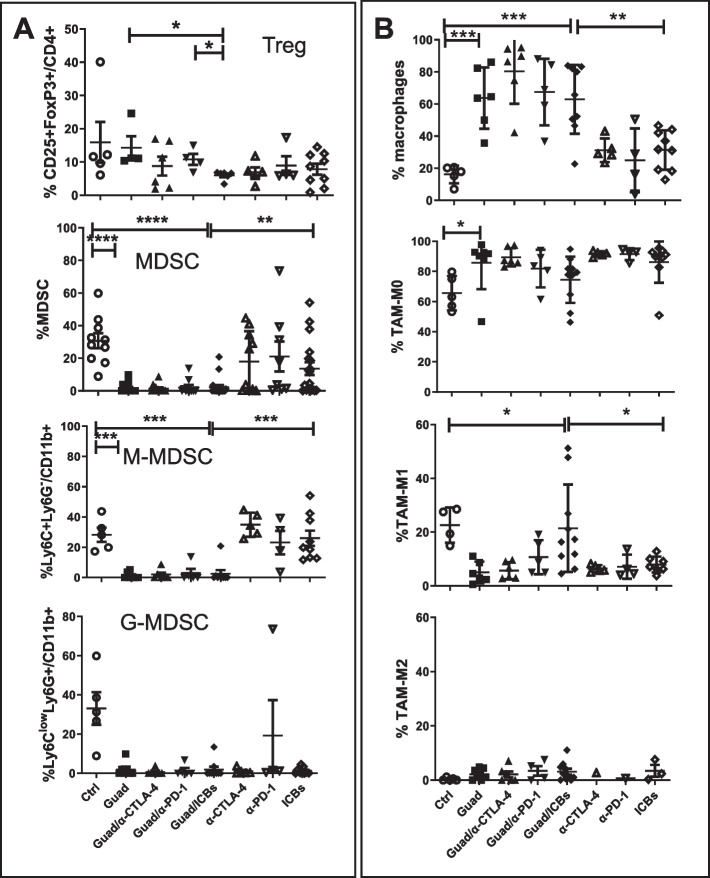
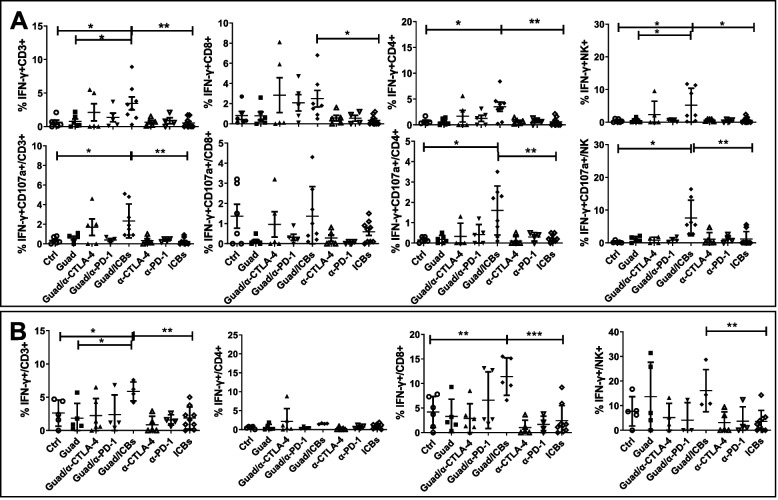
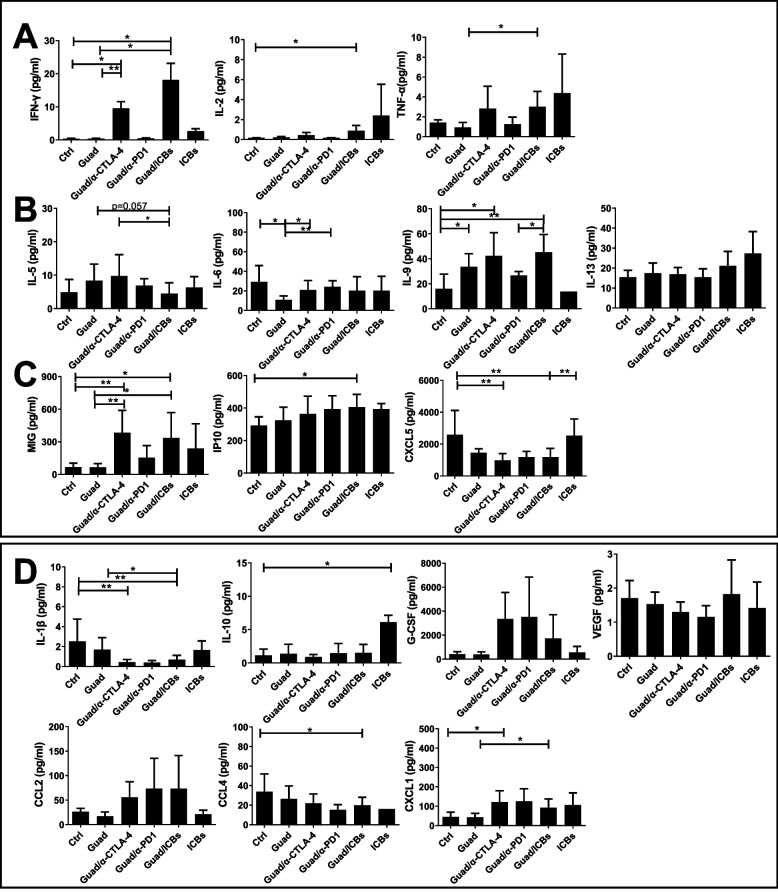
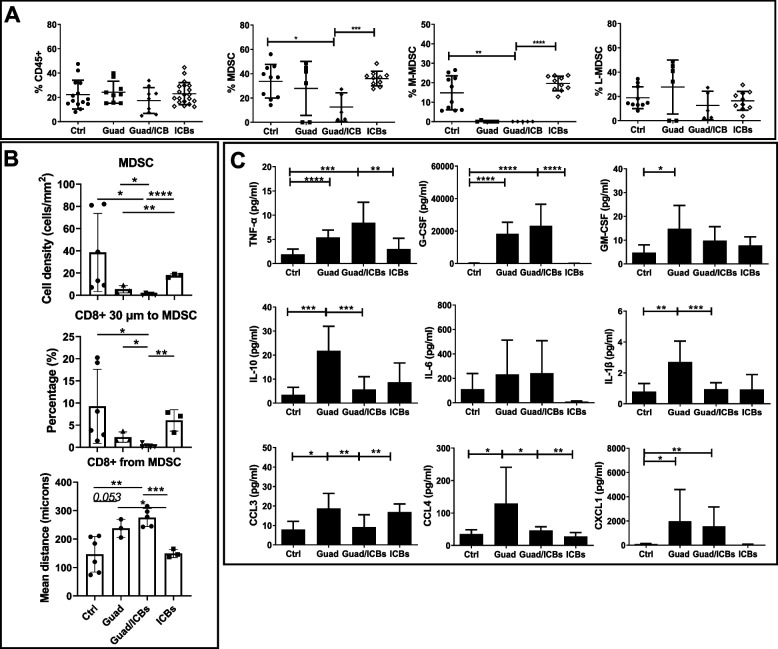
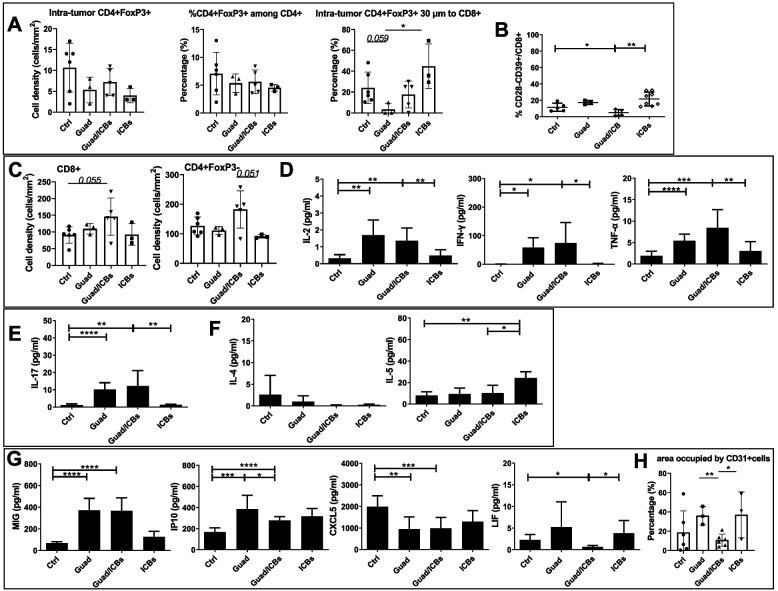
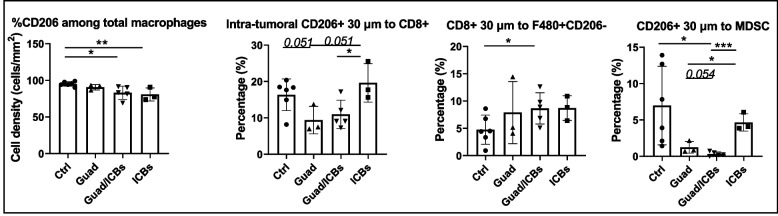
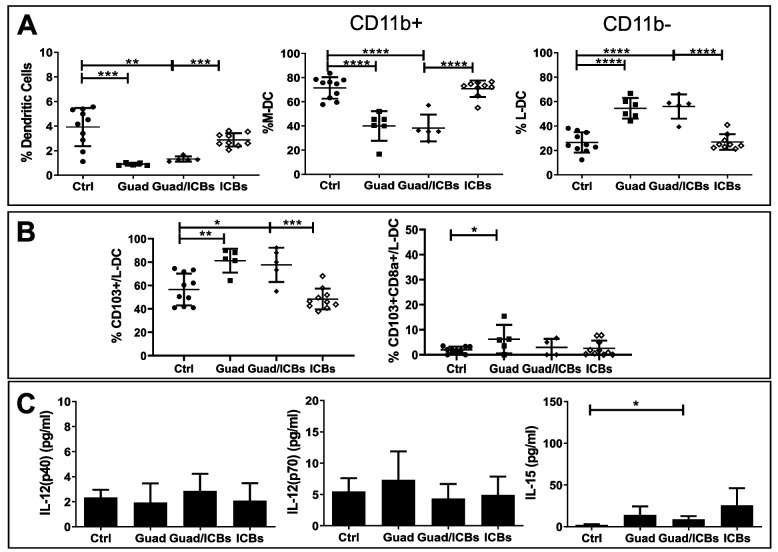
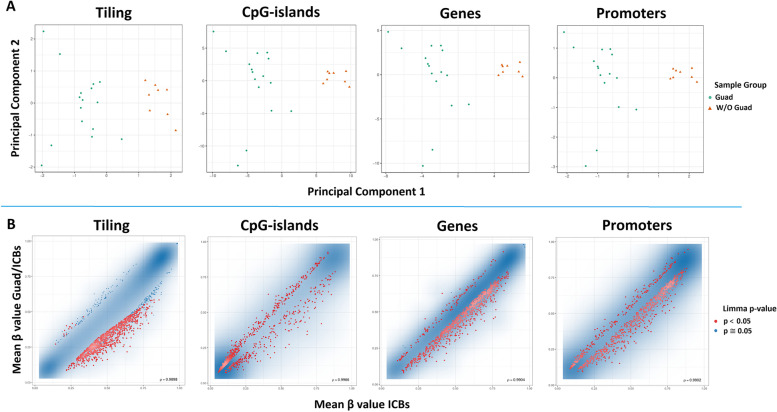
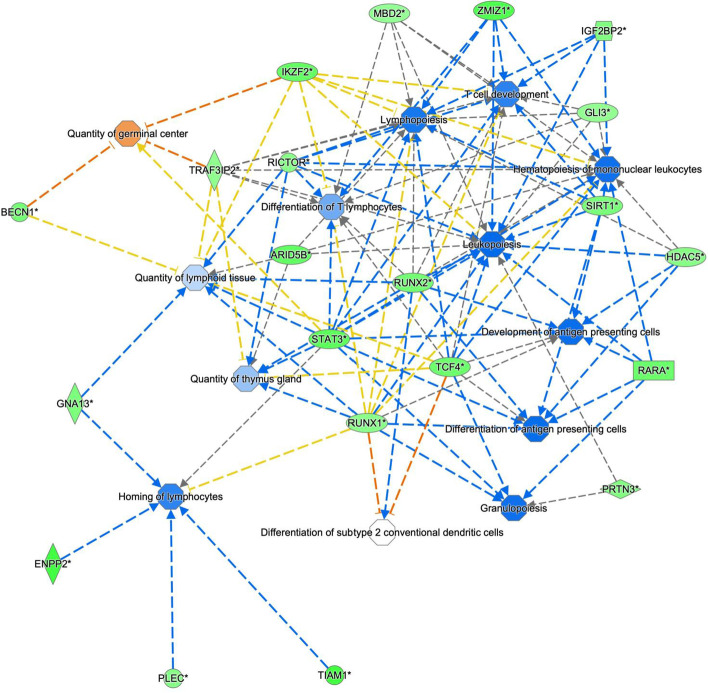
Results: In combination with ICBs, Guadecitabine significantly reduced subcutaneous tumor growth as well as metastases formation compared to ICBs and Guadecitabine treatment. In particular, Guadecitabine greatly enhanced the efficacy of combined ICBs by increasing effector memory CD8+ T cells, inducing effector NK cells in the spleen and reducing tumor infiltrating regulatory T cells and myeloid derived suppressor cells (MDSC), in the tumor microenvironment (TME). Guadecitabine in association with ICBs increased serum levels of IFN-γ and IFN-γ-induced chemokines with anti-angiogenic activity. Guadecitabine led to a general DNA-demethylation, in particular of sites of intermediate methylation levels.

Conclusions: These results indicate Guadecitabine as a promising epigenetic drug to be added to ICBs therapy.

Keywords: Anti-CTLA-4; Anti-PD-1; Guadecitabine; MDSC; Melanoma; Treg; Tumor microenvironment.


Conflict of interest statement

Michele Maio has served as a consultant and/or advisor to Roche, Bristol-Myers Squibb, Merck Sharp Dohme, Incyte, AstraZeneca, Amgen, Pierre Fabre, Eli Lilly, Glaxo Smith Kline, Sciclone, Sanofi, Alfasigma, and Merck Serono; and own shares in Theravance and Epigen Therapeutics, Srl. The other authors declare that they have no competing interests.

Figures

Fig. 1
Fig. 1
Guadecitabine continuous treatment significantly reduces tumor growth. A schedule of treatments. B tumor volume reduction in mice treated with 1mg/kg guadecitabine (Guad) for 13 consecutive days (Day +13 p<0.01). n=5 mice/group. C significative reduction of mean tumor weight in mice receiving guadecitabine (Guad). *p<0.05. D no difference in mean mouse weight between control and treated mice
Fig. 2
Fig. 2
Triple therapy significantly reduces in vivo tumor growth. A schedule of treatments: B16F10 cells were injected SC on day 0 (black arrow), guadecitabine or vehicle were given IP daily from day +3 to day +16 (black line), antibodies (anti-CTLA-4 and/or anti-PD-1 or isotype controls) were given IP on days +4, +7, +10, +13, +16 (red arrow). B Guadecitabine significantly increased the anti-tumoral effects of anti-CTLA-4 and anti-PD-1 mAbs (ICBs). (*p<0.05; ***p<0.01, respect to control). C Spaghetti plots of the volume of the single tumors in mice treated with guad alone versus triple therapy (top panel), ICBs vs. triple therapy (middle panel) and control vs. triple therapy (bottom panel). Some curves overlap. D Mice weight in grams. No significative differences in weight were detected among different group of treatments. n=9 mice /group of treatment
Fig. 3
Fig. 3
TME modifications induced by different treatments. Cell suspensions from tumors were analyzed by flow cytometry. A Analysis of CD39, MHC-class I (H2Kb), MHC-class II (IAb), CTLA-4, PD-L1 and TIM-3 expression on B16F10 cells (CD45neg). B expression of granzyme on CD8+ and CD4+ T cells, maturation of CD8+ and CD4+ T cells in central (CD44+CD62L+) and effector (CD44+CD62L-) memory cells and granzyme expression on effector memory CD8+ and CD4+ T cells. C IFN-γ expression on CD8+ and CD4+ T cells. D expression of CTLA-4, PD-1 and TIM-3 immune checkpoints on CD4+ and CD8+ T cells referred to CD3+. *p<0.05, **p<0.02, ***p<0.01
Fig. 4
Fig. 4
Guadecitabine modifies TME by increasing macrophages, while Guadecitabine/ICBs skews TAM to M1 subset, without upregulating alternative immune checkpoint. A identification of Treg (CD45+CD3+ CD4+CD25+Foxp3+), and MDSC (CD45+CD11b+Ly6C+/-Ly6G+/-) and subset M (Ly6C+Ly6G-) G (Ly6ClowLy6G+) on CD45+ cells infiltrating tumors. B frequencies of macrophages (Ly6C-Ly6G- on CD45+CD3-CD19-NKp46-I-Ab-CD11c-/+) and identification of TAM subsets: M0 CD38-Egr2-, M1 CD38+Egr2-, M2 CD38-Egr2+. *p<0.05, **p<0.02, ***p<0.01
Fig. 5
Fig. 5
Guadecitabine/ICBs stimulate IFN-γ production and cytotoxic activity on T and NK cells. A functional assay on spleen cells from different groups of treatments. Upper row: IFN-γ expression on CD3+, CD4+, CD8+ T and NK cells. Lower row: co-expression of CD107a (marker of degranulation and cytotoxic activity) and IFN-γ on CD3+, CD4+, CD8+ T, and NK cells. B functional assay on tumor-draining lymph node cells from different groups of treatments. Percentages of CD3+ IFN-γ+, CD4+ IFN-γ+, CD8+ IFN-γ+ and NKp46+ IFN-γ+ NK cells. *p<0.05, **p<0.02, ***p<0.01
Fig. 6
Fig. 6
Guadecitabine/ICBs shift towards a Th1 response and inhibit angiogenesis and metastatization. Cytokines level expressed in pg/ml detected by Milliplex assay correlated to: A Th1 responses, B Th2 responses, C angiogenesis and metastasization (CXCL5) regulation and D upper row: MDSC generation and activation, D lower row: MDSC and leukocyte migration (n=3-5 mice/group). *p<0.05, **p<0.02
Fig. 7
Fig. 7
Guadecitabine/ICBs significantly reduce tumor nodules formation in the lung of C57black/6J mice. A schedule of treatments: B16F10 cells were injected IV on day 0 (black arrow), guadecitabine or vehicle were given IP daily from day +1 to day +15 (black line), ICBs or Isotype controls (Antibodies) were given IP on days +2, +5, +8, +11, +14 (red arrow). B Mice lungs were FFPE and mounted on microscope slides. The histograms show the comparison among each group of treatment concerning: the numbers of lung micronodules (left panel), the mean of nodules maximum diameters (middle panel) and the percentage of lung area occupied by tumor (right panel) (Sample sizes: Ctrl n=6, guadecitabine n=3, guadecitabine/ICBs n=6, ICBs n=3). C The histogram shows the percentages of mice bearing extra-lung metastases for each group of treatment (Sample sizes: Ctrl n=15, guadecitabine n=10, guadecitabine /ICBs n=15, ICBs n=10). D Representative images of lungs for each group of treatment. *p<0.05, **p<0.02, ***p<0.01, ****p<0.001
Fig. 8
Fig. 8
Effects of guadecitabine /ICBs on the percentages of MDSC in proximity to CD8+T cells and on cytokines/chemokine serum levels. A percentages of CD45+, MDSC and subsets: M-MDSC (Ly6C+Ly6G-/CD11b+) and G-MDSC (Ly6ClowLy6G+/CD11b+) in the lung from mice receiving different treatments. B mIF analysis of lung tumor tissue slides (n=6 mice/group) showing MDSC cell density (upper histogram), percentages of CD8+ T cells and MDSC (F480-Ly6G+Ly6C-) in a radius distance of 30µm (middle histogram), and mean distance between CD8+ T cells and MDSC (lower histogram) from mice receiving different treatments. C serum levels expressed in pg/ml of different cytokines (upper and middle row) or chemokines (lower row) analyzed by Milliplex assay (n=7 mice/group). *p<0.05, **p<0.02, ***p<0.01, ****p<0.001
Fig. 9
Fig. 9
Guadecitabine/ICBs reduce the percentages of immune suppressive T cells more efficiently than guadecitabine alone, increase IFN-γ production and reduce angiogenesis. A mIF analysis of lung tumor tissue slides (n=3-6 mice/group) showing cell densities of CD4+Foxp3+ regulatory cells, percentages of CD4+FoxP3+ among total CD4+ T cells and percent of CD4+Foxp3+ cells in 30µm proximity to CD8+ cells in tumor nodules from mice receiving different treatments. B percentages of CD8+CD28-CD39+ cells in the lung from mice receiving different treatments. C mIF analysis of lung tumor tissue slides (n=3-6 mice/group) showing CD8+, and CD4+FoxP3- cell densities from mice receiving different treatments. D serum levels expressed in pg/ml of Th1 cytokines in response to different in vivo treatments by Milliplex assay (n=7 mice/group). E serum levels expressed in pg/ml of IL-17 cytokine in response to different in vivo treatments by Milliplex assay (n=7 mice/group). F serum levels expressed in pg/ml of Th2 cytokines in response to different in vivo treatments by Milliplex assay (n=7 mice/group). G serum levels expressed in pg/ml of chemokines involved in angiogenesis regulation in response to different in vivo treatments by Milliplex assay (n=7 mice/group). H mIF analysis of lung tumor tissue slides (n=3-6 mice/group) showing the percentage of area occupied by CD31+cells from mice receiving different treatments. *p<0.05, **p<0.02, ***p<0.01, ****p<0.001
Fig. 10
Fig. 10
Guadecitabine/ICBs reduce TAM-M2 percentages among total macrophages. mIF analysis of lung tumor tissue slides (n=3-6 mice/group). Histograms show, starting from left side, the frequency of CD206+ among total macrophages, percent of CD206+ cells in 30µm proximity to CD8+ cells, the frequency of CD8+ cells within 30µm distance to macrophages CD206- and the frequency of CD206+ cells within 30µm distance to MDSC in the lung from mice receiving different treatments. *p<0.05, **p<0.02, ***p<0.01, ****p<0.001
Fig. 11
Fig. 11
Guadecitabine decreases Dendritic Cells in lung TME, shifting to the subset of Lymphoid-DC. A Percentages of Dendritic Cells (CD11c+IAb+) referred to myeloid cells, not T, B, NK, myeloid (M)- (CD11c+IAb+CD11b+), and lymphoid (L)-DC (CD11c+IAb+CD11b-) referred to DC in the lung from mice receiving different treatments by flow cytometry. B percentages of L-DC/conventional DC expressing CD103 and co-expressing CD103 and CD8a in the lung from mice receiving different treatments. C serum levels expressed in pg/ml of DC cytokines in response to different in vivo treatments by Milliplex assay (n=7 mice/group). **p<0.02, ***p<0.01, ****p<0.001
Fig. 12
Fig. 12
Whole genome methylation analysis of tumors. A Scatter plot showing the samples’ coordinates on principal component analysis for all conditions, treatments containing guadecitabine (Guad) = green dots, treatments without guadecitabine (W/O Guad) = ochre triangles. The two treatment conditions are clearly separated by the first two principle components. B Scatterplots are shown for samples treated with ICBs alone or triple therapy analyzed by hybridization to Infinium Mouse Methylation BeadChip arrays (Illumina) according to the best combined ranks of signals (scale: mean beta values) derived from all methylation sites (tiling), CpG-islands, and genomic regions containing genes and promoter regions. Blue clouds contain the majority of single methylation sites that are not differentially methylated in a statistically significant manner, red dots indicate sites that are differentially methylated in a significant manner, blue dots correspond to borderline significant sites. Blue clouds show a bimodal distribution of high and low methylation with only a minor population of sites of intermediate methylation, especially so for CpG-islands and promoters
Fig. 13
Fig. 13
Heatmap of the 1% most variable methylation probes in terms of median absolute deviation (MAD). Probes methylated above mean are reported in red, below mean in blue; the color intensity indicates the distance from mean values. Samples are annotated with two color bars at the top of the heatmap (treatment class): green=with Guad , gold=without Guad. The second color bar (treatment ID) reports mouse treatment as Control (Ctrl), Guad alone or combined with one (Guad/α-CTLA-4, α-PD-1) or both immune check-point inhibitors (Guad/ICBs). Clusters defined by the Pheatmap package [37] are reported by the dendrogram on top of the heatmap
Fig. 14
Fig. 14
Significant biological networks generated by differentially methylated probes filtered in terms of MAD based on the connectivity of the genes including the methylation probes. The network is constituted by genes involved in the lymphoid tissue structure and development and in the homeostasis of the immune system. All genes identified are hypomethylated by Guad treatment and are predicted to activate several processes of the immune system represented by trapezoidal shapes. Green genes represent demethylated genes, blue hexagonal shapes represent biological processes predicted to be activated by demethylated genes and orange hexagonal shapes those predicted to be inactivated

Similar articles

Cited by

References

    1. Wolchok JD, Chiarion-Sileni V, Gonzalez R, Rutkowski P, Grob J-J, Cowey CL, et al. Overall Survival with Combined Nivolumab and Ipilimumab in Advanced Melanoma. N Engl J Med. 2017;377:1345–56. doi: 10.1056/NEJMoa1709684. - DOI - PMC - PubMed
    1. Larkin J, Chiarion-Sileni V, Gonzalez R, Grob JJ, Cowey CL, Lao CD, et al. Combined Nivolumab and Ipilimumab or Monotherapy in Untreated Melanoma. N Engl J Med. 2015;373:23–34. doi: 10.1056/NEJMoa1504030. - DOI - PMC - PubMed
    1. Asher N, Ben-Betzalel G, Lev-Ari S, Shapira-Frommer R, Steinberg-Silman Y, Gochman N, et al. Real World Outcomes of Ipilimumab and Nivolumab in Patients with Metastatic Melanoma. Cancers (Basel). 2020;12:E2329. doi: 10.3390/cancers12082329. - DOI - PMC - PubMed
    1. Donia M, Ellebaek E, Øllegaard TH, Duval L, Aaby JB, Hoejberg L, et al. The real-world impact of modern treatments on the survival of patients with metastatic melanoma. Eur J Cancer. 2019;108:25–32. doi: 10.1016/j.ejca.2018.12.002. - DOI - PubMed
    1. Sharma P, Hu-Lieskovan S, Wargo JA, Ribas A. Primary, Adaptive, and Acquired Resistance to Cancer Immunotherapy. Cell. 2017;168:707–23. doi: 10.1016/j.cell.2017.01.017. - DOI - PMC - PubMed

Associated data