Film measurement and analytical approach for assessing treatment accuracy and latency in a magnetic resonance-guided radiotherapy system
- PMID: 36934441
- PMCID: PMC10161048
- DOI: 10.1002/acm2.13915
Film measurement and analytical approach for assessing treatment accuracy and latency in a magnetic resonance-guided radiotherapy system
Abstract
Purpose: We measure the dose distribution of gated delivery for different target motions and estimate the gating latency in a magnetic resonance-guided radiotherapy (MRgRT) system.
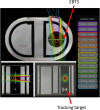
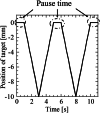
Method: The dose distribution accuracy of the gated MRgRT system (MRIdian, Viewray) was investigated using an in-house-developed phantom that was compatible with the magnetic field and gating method. This phantom contains a simulated tumor and a radiochromic film (EBT3, Ashland, Inc.). To investigate the effect of the number of beam switching and target velocity on the dose distribution, two types of target motions were applied. One is that the target was periodically moved at a constant velocity of 5 mm/s with different pause times (0, 1, 3, 10, and 20 s) between the motions. During different pause times, different numbers of beams were switched on/off. The other one is that the target was moved at velocities of 3, 5, 8, and 10 mm/s without any pause (i.e., continuous motion). The gated method was applied to these motions at MRIdian, and the dose distributions in each condition were measured using films. To investigate the relation between target motion and dose distribution in the gating method, we compared the results of the gamma analysis of the calculated and measured dose distributions. Moreover, we analytically estimated the gating latencies from the dose distributions measured using films and the gamma analysis results.
Results: The gamma pass rate linearly decreased with increasing beam switching and target velocity. The overall gating latencies of beam-hold and beam-on were 0.51 ± 0.17 and 0.35 ± 0.05 s, respectively.
Conclusions: Film measurements highlighted the factors affecting the treatment accuracy of the gated MRgRT system. Our analytical approach, employing gamma analysis on films, can be used to estimate the overall latency of the gated MRgRT system.
Keywords: gating method; latency; magnetic resonance-guided radiotherapy; quality assurance.
© 2023 The Authors. Journal of Applied Clinical Medical Physics published by Wiley Periodicals, LLC on behalf of The American Association of Physicists in Medicine.
Conflict of interest statement
There is no ethical problem or conflict of interest with regard to this manuscript.
Figures


Similar articles
-
Dosimetric evaluation of respiratory gating on a 0.35-T magnetic resonance-guided radiotherapy linac.J Appl Clin Med Phys. 2022 Sep;23(9):e13666. doi: 10.1002/acm2.13666. Epub 2022 Aug 10. J Appl Clin Med Phys. 2022. PMID: 35950272 Free PMC article.
-
Dosimetric validation of a magnetic resonance image gated radiotherapy system using a motion phantom and radiochromic film.J Appl Clin Med Phys. 2017 May;18(3):163-169. doi: 10.1002/acm2.12088. Epub 2017 Apr 24. J Appl Clin Med Phys. 2017. PMID: 28436094 Free PMC article.
-
Technical aspects of real time positron emission tracking for gated radiotherapy.Med Phys. 2016 Feb;43(2):783-95. doi: 10.1118/1.4939664. Med Phys. 2016. PMID: 26843241
-
A simple method to measure the gating latencies in photon and proton based radiotherapy using a scintillating crystal.Med Phys. 2023 Jun;50(6):3289-3298. doi: 10.1002/mp.16418. Epub 2023 Apr 19. Med Phys. 2023. PMID: 37075173
-
Comprehensive beam delivery latency evaluation for gated proton therapy system using customized multi-channel signal acquisition platform.J Appl Clin Med Phys. 2024 May;25(5):e14349. doi: 10.1002/acm2.14349. Epub 2024 Mar 29. J Appl Clin Med Phys. 2024. PMID: 38551392 Free PMC article.
Cited by
-
Multi-institutional questionnaire-based survey on online adaptive radiotherapy performed using commercial systems in Japan in 2023.Radiol Phys Technol. 2024 Sep;17(3):581-595. doi: 10.1007/s12194-024-00828-4. Epub 2024 Jul 19. Radiol Phys Technol. 2024. PMID: 39028438
-
Evaluation of dynamic accuracy and latency of a surface-guided radiotherapy system.Radiol Phys Technol. 2025 Mar;18(1):136-146. doi: 10.1007/s12194-024-00866-y. Epub 2024 Nov 28. Radiol Phys Technol. 2025. PMID: 39609349
-
Enhanced analysis of gating latency in 0.35T MR-linac through innovative time synchronization of a motion phantom and plastic scintillation detector.J Appl Clin Med Phys. 2025 Jul;26(7):e70116. doi: 10.1002/acm2.70116. Epub 2025 May 13. J Appl Clin Med Phys. 2025. PMID: 40358922 Free PMC article.
References
-
- Tarver RD, Conces DJ, Godwin JD. Motion artifacts on CT simulate bronchiectasis. AJR Am J Roentgenol. 1988;151(6):1117‐1119. Published online ahead of print December 01, 1988. - PubMed
-
- Keall PJ, Kini VR, Vedam SS, Mohan R. Potential radiotherapy improvements with respiratory gating. Australas Phys Eng Sci Med. 2002;25(1):1‐6. Published online ahead of print June 07, 2002. - PubMed
-
- Mayo JR, Muller NL, Henkelman RM. The double‐fissure sign: a motion artifact on thin‐section CT scans. Radiology. 1987;165(2):580‐581. Published online ahead of print November 01, 1987. - PubMed
-
- Balter JM, Ten Haken RK, Lawrence TS, Lam KL, Robertson JM. Uncertainties in CT‐based radiation therapy treatment planning associated with patient breathing. Int J Radiat Oncol Biol Phys. 1996;36(1):167‐174. Published online ahead of print August 01, 1996. - PubMed
MeSH terms
Grants and funding
LinkOut - more resources
Full Text Sources

