. 2023 Apr:60:101231.
doi: 10.1016/j.dcn.2023.101231. Epub 2023 Mar 15.

Polyneuro risk scores capture widely distributed connectivity patterns of cognition

Affiliations

Polyneuro risk scores capture widely distributed connectivity patterns of cognition

Nora Byington et al. Dev Cogn Neurosci. 2023 Apr.

Abstract

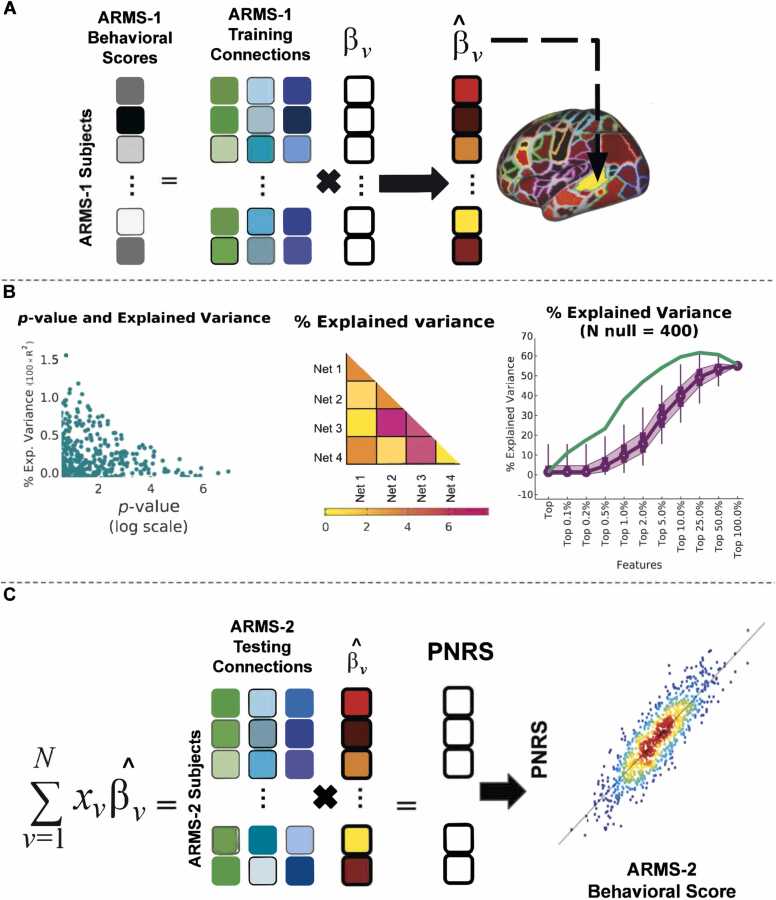
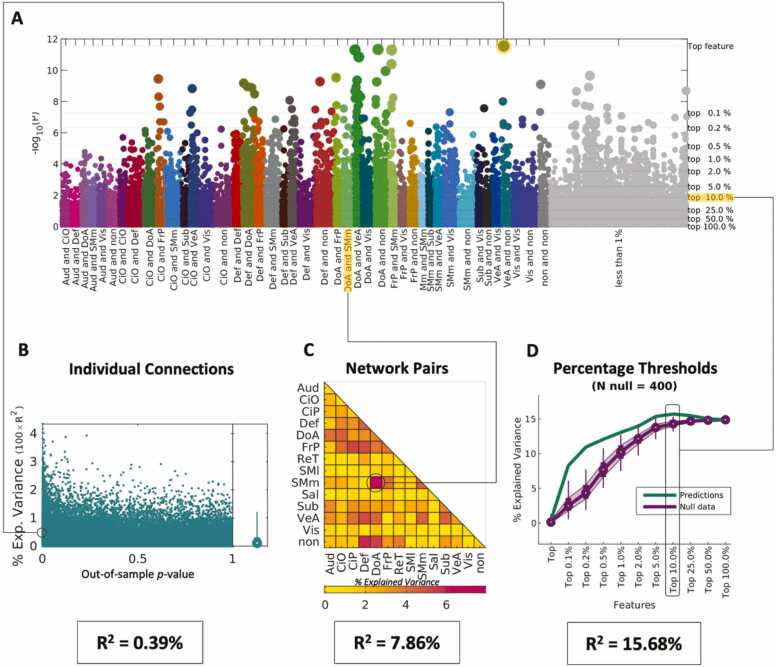
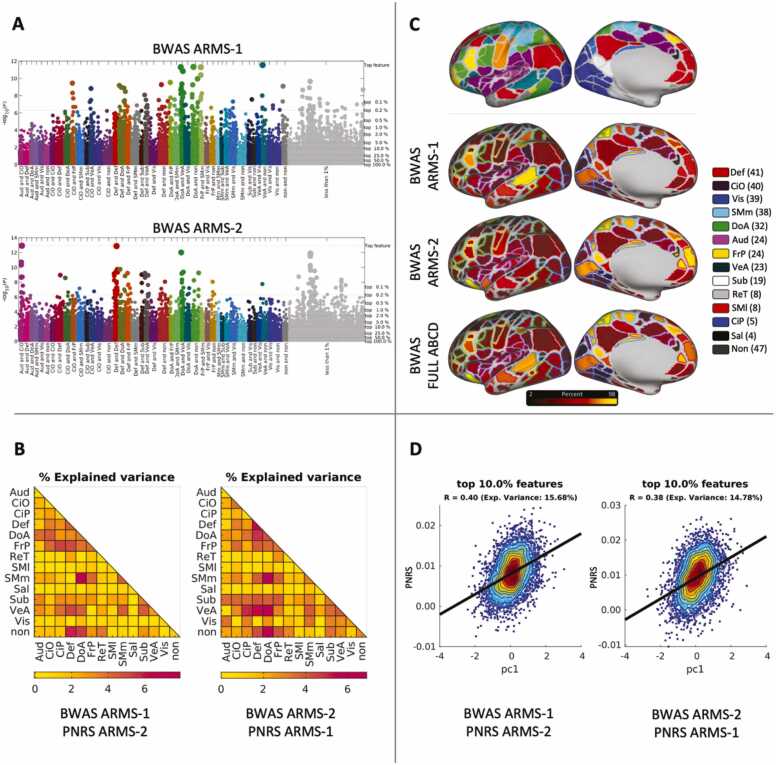
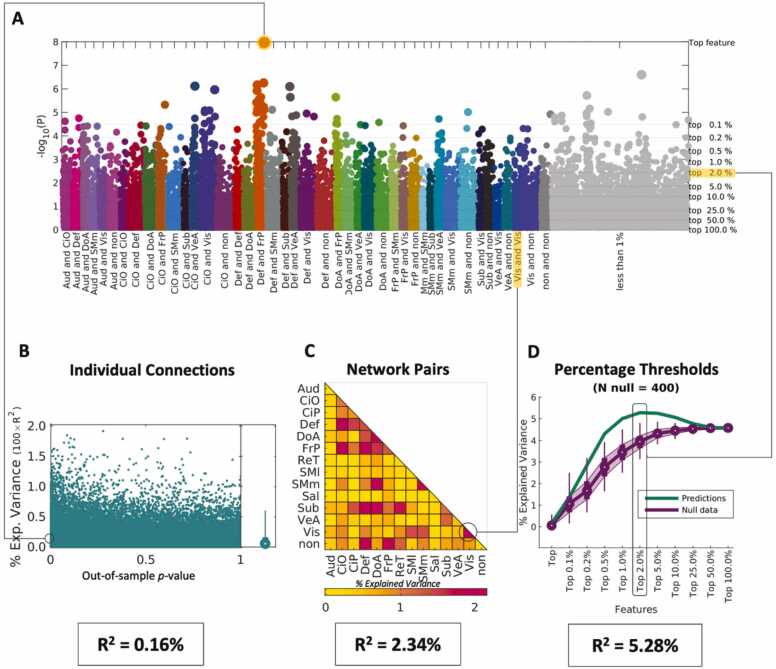
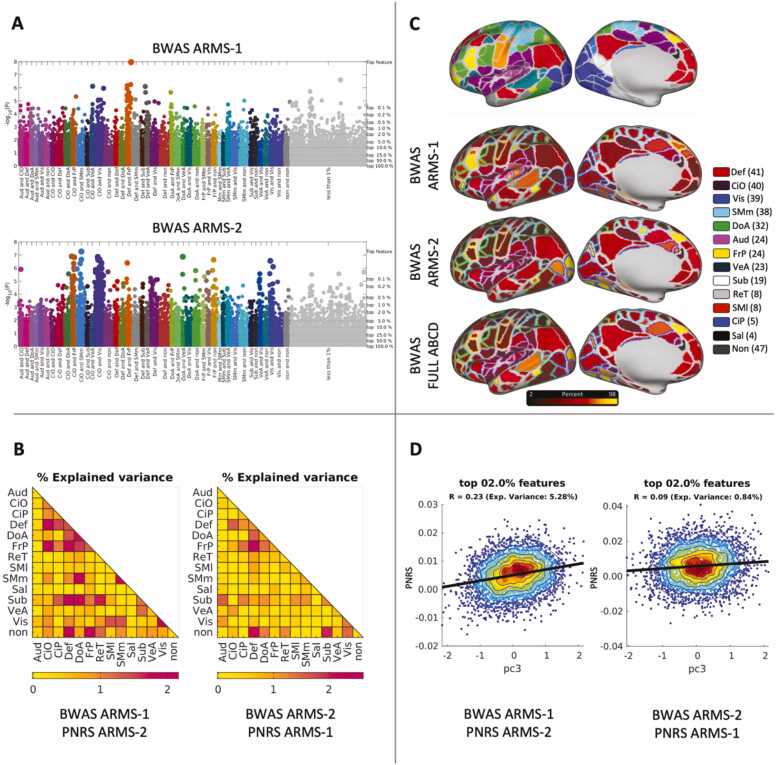
Resting-state functional connectivity (RSFC) is a powerful tool for characterizing brain changes, but it has yet to reliably predict higher-order cognition. This may be attributed to small effect sizes of such brain-behavior relationships, which can lead to underpowered, variable results when utilizing typical sample sizes (N∼25). Inspired by techniques in genomics, we implement the polyneuro risk score (PNRS) framework - the application of multivariate techniques to RSFC data and validation in an independent sample. Utilizing the Adolescent Brain Cognitive Development® cohort split into two datasets, we explore the framework's ability to reliably capture brain-behavior relationships across 3 cognitive scores - general ability, executive function, learning & memory. The weight and significance of each connection is assessed in the first dataset, and a PNRS is calculated for each participant in the second. Results support the PNRS framework as a suitable methodology to inspect the distribution of connections contributing towards behavior, with explained variance ranging from 1.0 % to 21.4 %. For the outcomes assessed, the framework reveals globally distributed, rather than localized, patterns of predictive connections. Larger samples are likely necessary to systematically identify the specific connections contributing towards complex outcomes. The PNRS framework could be applied translationally to identify neurologically distinct subtypes of neurodevelopmental disorders.

Keywords: BWAS; Big data; MRI; Neuroimaging; PNRS; Reproducibility.


Conflict of interest statement

Declaration of Competing Interest The authors declare the following financial interests/personal relationships which may be considered as potential competing interests: Damien Fair reports a relationship with Nous Imaging, Inc that includes: board membership and equity or stocks. Damien A. Fair has patent REAL TIME MONITORING AND PREDICTION OF MOTION IN MRI issued to Nous Imaging.

Figures

Fig. 1
Fig. 1
An overview of the Gordon Parcellation. Timecourses were calculated using ROIs defined by the Gordon parcellation schema, which includes 333 cortical ROIs. They are color coded on the cerebral hemispheres with the corresponding network name, network abbreviation, and ROI count listed. Networks are ranked alphabetically.
Fig. 2
Fig. 2
Polyneuro risk score framework methodology. An in-depth overview of each step within the polyneuro risk score framework. (A) Behavioral measures and functional connectivity from ARMS-1 subjects are used to calculate the weighted contribution, beta-weights, of each connection. (B) Beta-weights can be evaluated by explained variance achieved at three distinct levels: single connection, connections within a network pair, and a percentage of the top connections, when ranked by their p-values. The method by which beta-weights are evaluated dictates which connections are used to generate the PNRS. (C) Estimated beta-weights from (A) are then applied to the functional connectivity data from ARMS-2 subjects to calculate a PNRS. The PNRS can then be compared to the independent behavioral scores for ARMS-2 subjects.
Fig. 3
Fig. 3
Evaluation of beta-weights for general ability (GA). Beta-weights were calculated in the ARMS-1 sample with GA as the outcome of interest. (A) Manhattan plot, in logarithmic scale, showing the p-values of each connection. Connections are color coded according to the Gordon parcellation schema. Connections are color-coded by network assignment and ranked by the p-value of their beta-weight calculated in ARMS-1 for GA. The right-hand axis and thin gray horizontal lines denote the imposed thresholds evaluated to predict scores in the independent sample (ARMS-2). (B) Scatterplot showing the explained variance as a function of p-value per individual connection in the independent sample. (C) Explained variance calculated per network pair by summing all the connections within a given network pair. (D) Green line shows the explained variance per imposed threshold for the connections identified in the Manhattan plot (gray lines). Null data testing the specificity of the selected connections is shown in purple. At each threshold the PNRS approach was repeated 400 times after re-sorting connections randomly. Resulting predictions are shown as box plots where mean values are indicated as circles, the interquartile range is indicated in shaded purple and thin lines show the 2.5 % and 97.5 % of the distribution.
Fig. 4
Fig. 4
Beta-weights and explained variance across ARMS-1 and ARMS-2 for general ability (GA). To test the reproducibility of our results, beta-weights were calculated within each of the ARMS to allow for evaluation of the stability of the identified connections and resulting explained variance. (A) Manhattan plots across ARMS-1 and ARMS-2 for GA reveal differences in the ranking of individual connections. (B) Explained variance calculated per network pair by summing all the connections within a given network pair. (C) The absolute values of all the beta-weights (100 % threshold) are summed and mapped by their topographical location using the Gordon parcellation schema (Gordon et al., 2016). Differences are noted across the ARMS-1, ARMS-2, and full ABCD beta-weights, but the brain-wide instantiation of the behavior is observed across all 3 models. (D) The calculated polyneuro risk scores are compared to the independently calculated PC1 scores for both ARMS-2 (left) and ARMS-1 (right) participants.
Fig. 5
Fig. 5
Evaluation of Beta-weights for Learning & Memory (LM). Caption as in Fig. 2.
Fig. 6
Fig. 6
Beta-weights and explained variance across ARMS-1 and ARMS-2 for Learning & Memory (LM). Caption as in Fig. 3.

References

    1. Acker, Acker (1982). Bexley Maudsley automated processing screening and Bexley Maudsley category sorting test manual. Windsor, England: NFER-Nelson.
    1. Agerbo E., Sullivan P.F., Vilhjalmsson B.J., Pedersen C.B., Mors O., Børglum A.D., Hougaard D.M., Hollegaard M.V., Meier S., Mattheisen M., Others Polygenic risk score, parental socioeconomic status, family history of psychiatric disorders, and the risk for schizophrenia: a Danish population-based study and meta-analysis. JAMA Psychiatry. 2015;72(7):635–641. 〈https://jamanetwork.com/journals/jamapsychiatry/article-abstract/2211892〉 - PubMed
    1. Alvarez J.A., Emory E. Executive function and the frontal lobes: a meta-analytic review. Neuropsychol. Rev. 2006;16(1):17–42. doi: 10.1007/s11065-006-9002-x. - DOI - PubMed
    1. Biswal B., Zerrin Yetkin F., Haughton V.M., Hyde J.S. Functional connectivity in the motor cortex of resting human brain using echo-planar mri. Magn. Reson. Med. 1995;Vol. 34(Issue 4):537–541. doi: 10.1002/mrm.1910340409. - DOI - PubMed
    1. Bleck T.P., Nowinski C.J., Gershon R., Koroshetz W.J. What is the NIH Toolbox, and what will it mean to neurology? Neurology. 2013;Vol. 80(Issue 10):874–875. doi: 10.1212/wnl.0b013e3182872ea0. - DOI - PubMed

Publication types