. 2023 Jun 15:877:162934.
doi: 10.1016/j.scitotenv.2023.162934. Epub 2023 Mar 18.

Fine particulate matter (PM2.5)-induced pulmonary oxidative stress contributes to increases in glucose intolerance and insulin resistance in a mouse model of circadian dyssynchrony

Affiliations

Fine particulate matter (PM2.5)-induced pulmonary oxidative stress contributes to increases in glucose intolerance and insulin resistance in a mouse model of circadian dyssynchrony

Amanda Ribble et al. Sci Total Environ. .

Abstract

Results of human and animal studies independently suggest that either ambient fine particulate matter (PM2.5) air pollution exposure or a disturbed circadian rhythm (circadian dyssynchrony) are important contributing factors to the rapidly evolving type-2-diabetes (T2D) epidemic. The objective of this study is to investigate whether circadian dyssynchrony increases the susceptibility to PM2.5 and how PM2.5 affects metabolic health in circadian dyssynchrony. We examined systemic and organ-specific changes in glucose homeostasis and insulin sensitivity in mice maintained on a regular (12/12 h light/dark) or disrupted (18/6 h light/dark, light-induced circadian dyssynchrony, LICD) light cycle exposed to air or concentrated PM2.5 (CAP, 6 h/day, 30 days). Exposures during Zeitgeber ZT3-9 or ZT11-17 (Zeitgeber in circadian time, ZT0 = begin of light cycle) tested for time-of-day PM2.5 sensitivity (chronotoxicity). Mice transgenic for lung-specific overexpression of extracellular superoxide dismutase (ecSOD-Tg) were used to assess the contribution of CAP-induced pulmonary oxidative stress. Both, CAP exposure from ZT3-9 or ZT11-17, decreased glucose tolerance and insulin sensitivity in male mice with LICD, but not in female mice or in mice kept on a regular light cycle. Although changes in glucose homeostasis in CAP-exposed male mice with LICD were not associated with obesity, they were accompanied by white adipose tissue (WAT) inflammation, impaired insulin signaling in skeletal muscle and liver, and systemic and pulmonary oxidative stress. Preventing CAP-induced oxidative stress in the lungs mitigated the CAP-induced decrease in glucose tolerance and insulin sensitivity in LICD. Our results demonstrate that circadian dyssynchrony is a novel susceptibility state for PM2.5 and suggest that PM2.5 by inducing pulmonary oxidative stress increases glucose intolerance and insulin resistance in circadian dyssynchrony.

Keywords: Air pollution; Akt phosphorylation; Circadian dyssynchrony; Circadian rhythm; Fine particulate matter, PM(2.5); Insulin resistance; Light pollution; Type 2 diabetes.


Conflict of interest statement

Declaration of competing interest The authors declare that they have no known competing financial interests or personal relationships that could have appeared to influence the work reported in this paper.

Figures

Figure 1:
Figure 1:. Light-induced circadian dyssynchrony (LICD) and concentrated fine particulate matter (CAP) exposure.
(A) Experimental protocols: Age matched ~12-week-old mice with or without light-induced circadian dyssynchrony (LICD) inhaled concentrated ambient fine particulate matter (CAP) or HEPA-filtered air for 30 days (6h/ day). To stimulate LICD (Study 1, 2, 3 and 5) mice were switched to a disturbed light cycle (18h light, ZT0-18: 6h dark, ZT18-24) while control mice (Study 1, 3, 5) remained on a regular light cycle (12h light, ZT0-12: 12h dark, ZT12-24). To test for the time of the day sensitivity inhalation exposure was performed from either ZT3-9 (Study 1) or ZT11-17 (Study 2). In Study 3, female mice were used to examine sex specific effects. In addition, male mice transgenic for lung specific extracellular superoxide dismutase and their WT littermates were used in Study 5 to test for the role of pulmonary oxidative stress. Mice (Study 1, 2, 3 and 5) were used to test whether CAP exposure affects metabolic health in LICD. After 20 days, glucose tolerance tests (GTTs) or insulin tolerance tests (ITTs) were performed at ZT7 or ZT2, respectively. Following the 30 days of exposure, animals in Study 1, 2, 3 and 5 were injected with either saline or insulin to determine insulin sensitivity in the collected tissues and organs. To examine the time of the day dependency of the measurements, mice with LICD (Study 1) are injected with saline or insulin at ZT3 and 15. Additional mice are used to determine metabolic rate, physical activity, food and water intake as well as body composition (Study 1). To examine effects that are induced by CAP exposure itself at different times of the day in the absence of circadian dyssynchrony mice assigned to Study 4 remained on a regular light cycle and terminal measurements were taken and tissues and organs were collected at ZT0, 6, 12 and 18. (B) Activity (Total Movement, XT) measured in mice either (i) maintained on a regular light cycle (12h light, ZT0-12: 12h dark, ZT12-24) or (ii) switched to a disturbed light cycle (18h light, ZT0-18: 6h dark, ZT18-24; light-induced circadian dyssynchrony, LICD). (C) Plasma corticosterone levels in air or CAP inhaling mice (i) kept on regular light/dark cycle or in LICD (Study 1, ZT3) or (ii) maintained on regular light/dark cycle (Study 4, ZT0, 6, 12, and 18). Data are the mean ± SE, *p < 0.05, $p < 0.1 LICD versus matching regular light cycle control; n = 4.
Figure 2:
Figure 2:. Effects of concentrated fine particulate matter (CAP) exposure on systemic glucose tolerance and insulin sensitivity.
(A) Systemic glucose tolerance measured in mice maintained on a regular light cycle that inhaled air or CAP between ZT3-9 (Study 1, i), or in mice kept on a disturbed light cycle (light-induced circadian dyssynchrony, LICD) that inhaled air or CAP from either ZT3-9 (Study 1, ii) or ZT11-17 (Study 2, iii). (B) Systemic insulin sensitivity (Study 1) tested in animals kept on a regular light cycle (i) or with LICD (ii) that inhaled air or CAP from ZT3-9. During glucose and insulin tolerance test blood glucose levels were measured before (0) and 5, 15, 30 60 and 120 minutes after injection of either glucose (1 g/kg) or insulin (1.5 U/kg). Total excursion of glucose in the blood was calculated by integrating the area under the curve (AUC). (C) HOMA-IR (= fasting blood glucose [mmol/L] × fasting plasma insulin levels [mU/L]/22.5) and (D) HOMA-β (= 20 × fasting plasma insulin levels [mU/L]/fasting blood glucose [mmol/L] – 3.5, in %) scores calculated from values measured at ZT3 and ZT15 (Study 1, LICD only) in mice kept on a regular light cycle or with LICD inhaling air or CAP from ZT3-9 (Study 1) or ZT11-17 (Study 2). (E) Circulating levels of hemoglobin A1c (HbA1C) measured at ZT3 in mice kept on a regular light cycle or at ZT3 and ZT15 in mice with LICD exposed to air or CAP (ZT3-9, Study 1). Data are the mean ± SE, *p < 0.05 CAP versus matching air; n = 5-10.
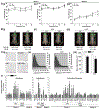
Figure 3:
Figure 3:. Effects of concentrated fine particulate matter (CAP) exposure on adiposity and adipose tissue inflammation.
(A) Changes in body weight during the 30 days of exposure and (B) fat and lean mass measured by dual energy X-ray absorptiometer (DEXA) scan in mice maintained on a regular light cycle that inhaled air or CAP (ZT3-9, Study 1, i) or in mice kept on a disturbed light cycle (light-induced circadian dyssynchrony, LICD) that inhaled air or CAP from either ZT3-9 (Study 1, ii) or ZT11-17 (Study 2, iii). Data are mean ± SE, body weight: Study 1: n = 9-10, Study 2: n = 15, DEXA scans: n=4-5. (C) Adipocyte size in epididymal white adipose tissue (WAT) determined by microscopy in animals kept on a regular light cycle or with LICD exposed from ZT3-ZT9. (i) Representative microscopic images of WAT sections stained with H&E that were used to determine adipocyte size distribution (ii) and mean adipocyte sizes (iii). (D) Abundance of cytokine, adipokine and antioxidant enzyme mRNA in WAT from animals kept on a regular light cycle exposed from ZT3-9 (Study 1) and mice with LICD exposed from ZT3-9 (Study 2, collected at ZT3 or ZT15) or ZT11-17 (Study 2). The mRNA levels of tumor necrosis factor a, Tnfa; interleukin 1β, II1b; interleukin 6, II6; chemokine (C-C motif) ligand 2, Ccl2; chemokine (C-C motif) ligand 3, Ccl3; adiponectin, Adpn; leptin, Lep; superoxide dismutase, Sod 1, 2 and 3; catalase, Cat; heme oxygenase 1, Hmox1; nuclear factor-erythroid factor 2-related factor 2, Nrf2; and glutathione transferase a, m, and p were determined by qRT-PCR. Data are the mean ± SE, *p < 0.05 CAP versus matching air; n = 5.
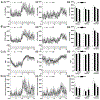
Figure 4:
Figure 4:. Effects of concentrated fine particulate matter (CAP) exposure on whole body metabolism and activity.
(A) Oxygen consumption (VO2), (B) carbon dioxide production (VCO2), (C) respiratory exchange rate (RER), and (D) activity (total movement) measured in mice maintained on regular light cycle (i) or kept on a disturbed light cycle (light-induced circadian dyssynchrony, LICD, ii) that were exposed from ZT3-9 to air or CAP (Study 1). Summary data (iii) are calculated for 24 h (ZT0-24), light phase (ZT0-12), and dark phase (ZT12-24). Data are mean ± SE, n = 4.
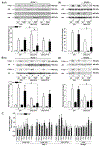
Figure 5.
Figure 5.. Effects of concentrated fine particulate matter (CAP) exposure on insulin sensitivity of skeletal muscle (SKM) and liver.
Western blot analysis of Akt phosphorylation in SKM (A) and liver (B) isolated from mice kept on a regular light cycle or placed on a disturbed circadian rhythm (light-induced circadian dyssynchrony, LICD) exposed to air or CAP for 30 days. Mice kept in LICD were exposed from ZT3-9 (Study 1, i) or ZT11-17 (Study 2, ii). Mice were injected with saline or insulin (1.5 U/kg, 15 min) at ZT3 or ZT15 (LICD, Study 1 only). Data are the mean ± SE normalized to controls, *p < 0.05 saline vs. insulin; #p < 0.05, air versus CAP; &p < 0.05, CAP versus LICD-CAP; n = 4-5. (D) Hepatic mRNA levels of gluconeogenesis enzymes at ZT3 or ZT15 (LICD, Study 1 only) in animals kept on a regular light cycle exposed from ZT3-9 (Study 1) and in mice with LICD exposed from ZT3-9 (Study 1) or ZT11-17 (Study 2). Abundance of glucose-6-phosphatase catalytic subunit 1, 2, and 3 (G6pc1, 2, 3), fructose-1,6-bisphosphatase 1 and 2 (Fbp1, 2), and phosphoenolpyruvate carboxykinase 1 and 2 (Pck1, 2) mRNA were determined by qRT-PCR. Data are the mean ± SE, *p < 0.05 CAP versus matching air; n = 5.
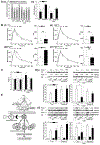
Figure 6.
Figure 6.. Prevention of concentrated fine particulate matter (CAP)-induced pulmonary oxidative stress mitigates glucose intolerance and insulin resistance.
Mice transgenic for pulmonary extracellular superoxide dismutase (ecSOD-Tg) and their wildtype (WT) littermates maintained on a regular light cycle (12h light: 12h dark) or switched on a disturbed circadian rhythm (18h light: 6h dark; light-induced circadian dyssynchrony, LICD) were exposed to air or CAP for 30 days (6h/ day, ZT3-9, Study 5). (A) Pulmonary levels of (i) reduced (GSH) and oxidized (GSSG) glutathione, and (ii) GSH: GSSG ratios in WT and ecSOD-Tg mice. Data are the mean ± SE, *p < 0.05 air versus CAP; n = 5. (B) After 20 days of exposure systemic glucose tolerance was tested in both WT (i&iii) and ecSOD-Tg (ii&iv) mice kept on a regular or disturbed light cycle (LICD). The total excursion of glucose in the blood was calculated by integrating the area under the curve (AUC). Data are the mean ± SE, *p < 0.05 air versus CAP; n = 8-10. (C) Calculated HOMA-IR (= fasting blood glucose [mmol/L] × fasting plasma insulin levels [mU/L]/22.5) scores of air or CAP inhaling WT and ecSOD-Tg mice kept with or without LICD. Data are the mean ± SE, *p < 0.05 air versus CAP; n = 5. (D) Western blot analysis of Akt phosphorylation in (i) SKM and (ii) liver of WT and ecSOD-Tg mice. Mice kept on a regular or disturbed light cycle that inhaled air or CAP for 30 days were injected with saline or insulin (1.5 U/kg, 15 min). Data are the mean ± SE normalized to controls, *p < 0.05 saline vs. insulin; #p < 0.05, air versus CAP; n = 4-5. (E) PM2.5 exposure exacerbates glucose intolerance and insulin resistance in circadian dyssynchrony via a pathway that involves the induction of pulmonary oxidative stress.

References

    1. Ayas NT, White DP, Al-Delaimy WK, Manson JE, Stampfer MJ, Speizer FE, Patel S, and Hu FB (2003). A prospective study of self-reported sleep duration and incident diabetes in women. Diabetes care 26, 380–384. - PubMed
    1. Bass JJ, Wilkinson DJ, Rankin D, Phillips BE, Szewczyk NJ, Smith K, and Atherton PJ (2017). An overview of technical considerations for Western blotting applications to physiological research. Scandinavian journal of medicine & science in sports 27, 4–25. 10.1111/sms.12702. - DOI - PMC - PubMed
    1. Beaglehole R, Bonita R, Horton R, Adams C, Alleyne G, Asaria P, Baugh V, Bekedam H, Billo N, Casswell S, et al. (2011). Priority actions for the non-communicable disease crisis. Lancet 377, 1438–1447. 10.1016/S0140-6736(11)60393-0. - DOI - PubMed
    1. Bhatnagar A (2017). Environmental Determinants of Cardiovascular Disease. Circulation research 121, 162–180. 10.1161/CIRCRESAHA.117.306458. - DOI - PMC - PubMed
    1. Blanco RA, Ziegler TR, Carlson BA, Cheng PY, Park Y, Cotsonis GA, Accardi CJ, and Jones DP (2007). Diurnal variation in glutathione and cysteine redox states in human plasma. The American journal of clinical nutrition 86, 1016–1023. - PubMed

LinkOut - more resources