Cellular and humoral responses to an HIV DNA prime by electroporation boosted with recombinant vesicular stomatitis virus expressing HIV subtype C Env in a randomized controlled clinical trial
- PMID: 36935288
- PMCID: PMC10102555
- DOI: 10.1016/j.vaccine.2023.03.015
Cellular and humoral responses to an HIV DNA prime by electroporation boosted with recombinant vesicular stomatitis virus expressing HIV subtype C Env in a randomized controlled clinical trial
Abstract
Background: HIV subtypes B and C together account for around 60% of HIV-1 cases worldwide. We evaluated the safety and immunogenicity of a subtype B DNA vaccine prime followed by a subtype C viral vector boost.
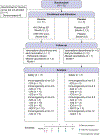
Methods: Fourteen healthy adults received DNA plasmid encoding HIV-1 subtype B nef/tat/vif and env (n = 11) or placebo (n = 3) intramuscularly (IM) via electroporation (EP) at 0, 1, and 3 months, followed by IM injection of recombinant vesicular stomatitis virus encoding subtype C Env or placebo at 6 and 9 months. Participants were assessed for safety, tolerability of EP, and Env-specific T-cell and antibody responses.
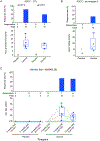
Results: EP was generally well tolerated, although some device-related adverse events did occur, and vaccine reactogenicity was mild to moderate. The vaccine stimulated Env-specific CD4 + T-cell responses in greater than 80% of recipients, and CD8 + T-cell responses in 30%. Subtype C Env-specific IgG binding antibodies (bAb) were elicited in all vaccine recipients, and antibody-dependent cell-mediated cytotoxicity (ADCC) responses to vaccine-matched subtype C targets in 80%. Negligible V1/V2 and neutralizing antibody (nAb) responses were detected.
Conclusions: This prime/boost regimen was safe and tolerable, with some device-related events, and immunogenic. Although immunogenicity missed targets for an HIV vaccine, the DNA/rVSV platform may be useful for other applications.
Clinicaltrials: gov: NCT02654080.
Keywords: DNA vaccine; Electroporation; HIV vaccine; Vesicular stomatitis virus.
Copyright © 2023 Elsevier Ltd. All rights reserved.
Conflict of interest statement
Declaration of Competing Interest The authors declare the following financial interests/personal relationships which may be considered as potential competing interests: The following authors declare no conflicts of interest: MT, MDM, JE, DCM, JMJ, ME, DKC, GJW, GDT, GF, SK, ER, ME, TL, RX, SL. MA and MP are employed by NIAID but had no role in the funding decisions or grant oversight. DH is a full-time employee of Ichor Medical Systems, Inc. and receives a salary and equity for this work. SCDR reports funding from NIH, Bill & Melinda Gates Foundation for the work. IF gets research support from Moderna, Janssen, Pfizer and Sanofi, and is a consultant for Gilead, GlaxoSmithKline and Merck.
Figures


References
-
- Rerks-Ngarm S, Pitisuttithum P, Nitayaphan S, et al. Vaccination with ALVAC and AIDSVAX to prevent HIV-1 infection in Thailand. N Engl J Med 2009; 361:2209–20. - PubMed
-
- FDA. First FDA-approved vaccine for the prevention of Ebola virus disease, marking a critical milestone in public health preparedness and response. https://www.fda.gov/news-events/press-announcements/first-fda-approved-v...: FDA, 2019.
Publication types
MeSH terms
Substances
Associated data
Grants and funding
- UM1 AI069501/AI/NIAID NIH HHS/United States
- UM1 AI068614/AI/NIAID NIH HHS/United States
- UM1 AI068618/AI/NIAID NIH HHS/United States
- U01 AI068635/AI/NIAID NIH HHS/United States
- UM1 AI068635/AI/NIAID NIH HHS/United States
- P30 AI064518/AI/NIAID NIH HHS/United States
- U01 AI068618/AI/NIAID NIH HHS/United States
- U01 AI068614/AI/NIAID NIH HHS/United States
- U01 AI069534/AI/NIAID NIH HHS/United States
- UM1 AI069534/AI/NIAID NIH HHS/United States
- P30 AI045008/AI/NIAID NIH HHS/United States
- U01 AI069501/AI/NIAID NIH HHS/United States
LinkOut - more resources
Full Text Sources
Medical
Research Materials

