

Developing a medical device-grade T2 phantom optimized for myocardial T2 mapping by cardiovascular magnetic resonance
- PMID: 36935515
- PMCID: PMC10026458
- DOI: 10.1186/s12968-023-00926-z
Developing a medical device-grade T2 phantom optimized for myocardial T2 mapping by cardiovascular magnetic resonance
Abstract
Introduction: A long T2 relaxation time can reflect oedema, and myocardial inflammation when combined with increased plasma troponin levels. Cardiovascular magnetic resonance (CMR) T2 mapping therefore has potential to provide a key diagnostic and prognostic biomarkers. However, T2 varies by scanner, software, and sequence, highlighting the need for standardization and for a quality assurance system for T2 mapping in CMR.
Aim: To fabricate and assess a phantom dedicated to the quality assurance of T2 mapping in CMR.
Method: A T2 mapping phantom was manufactured to contain 9 T1 and T2 (T1|T2) tubes to mimic clinically relevant native and post-contrast T2 in myocardium across the health to inflammation spectrum (i.e., 43-74 ms) and across both field strengths (1.5 and 3 T). We evaluated the phantom's structural integrity, B0 and B1 uniformity using field maps, and temperature dependence. Baseline reference T1|T2 were measured using inversion recovery gradient echo and single-echo spin echo (SE) sequences respectively, both with long repetition times (10 s). Long-term reproducibility of T1|T2 was determined by repeated T1|T2 mapping of the phantom at baseline and at 12 months.
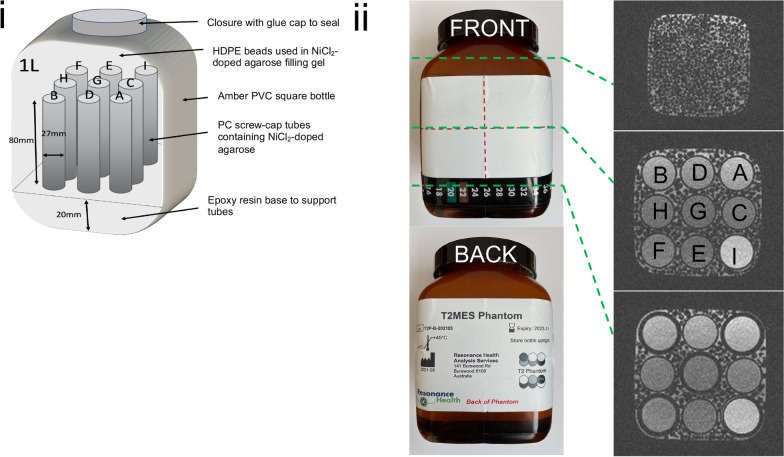
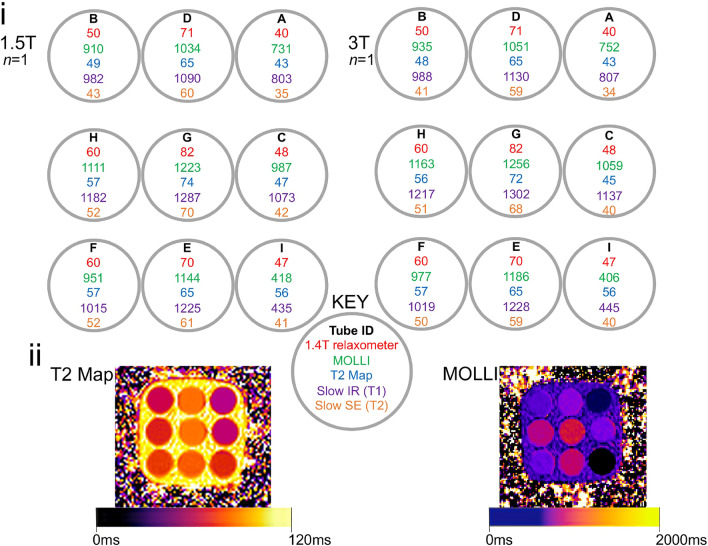
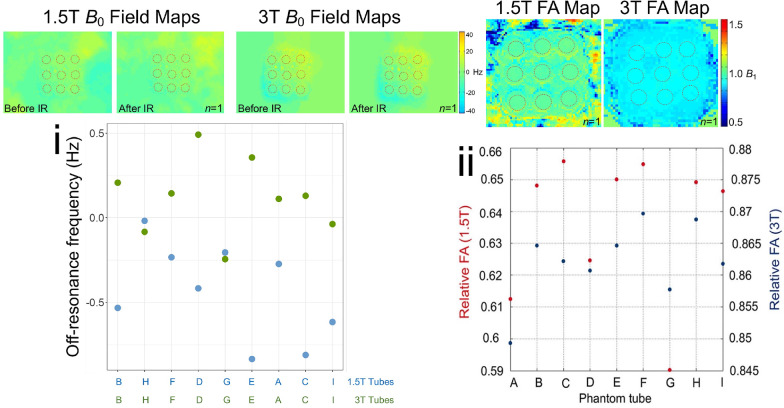
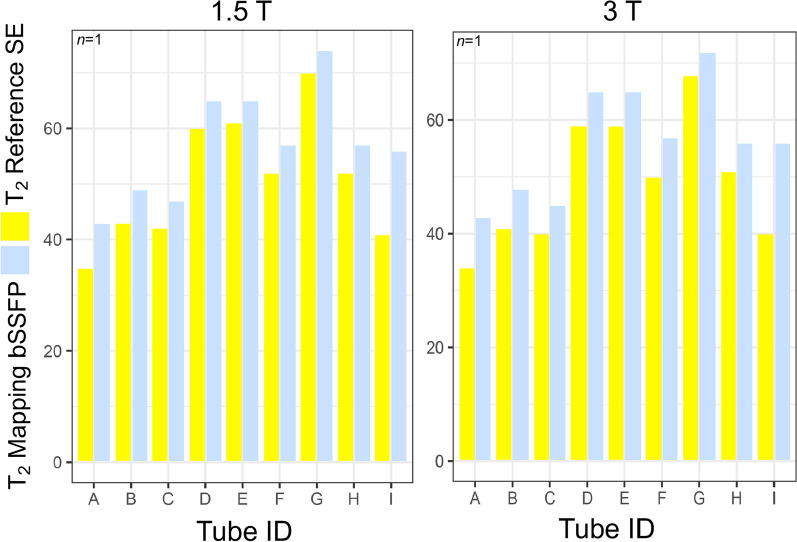
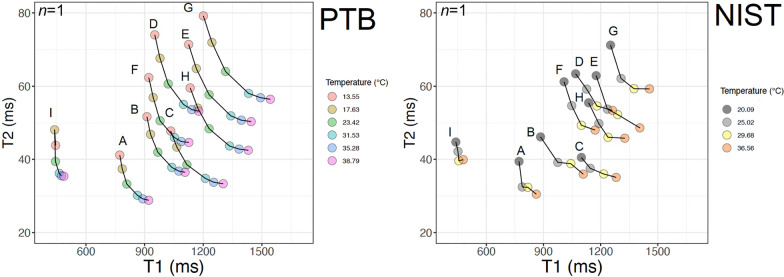
Results: The phantom embodies 9 internal agarose-containing T1|T2 tubes doped with nickel di-chloride (NiCl2) as the paramagnetic relaxation modifier to cover the clinically relevant spectrum of myocardial T2. The tubes are surrounded by an agarose-gel matrix which is doped with NiCl2 and packed with high-density polyethylene (HDPE) beads. All tubes at both field strengths, showed measurement errors up to ≤ 7.2 ms [< 14.7%] for estimated T2 by balanced steady-state free precession T2 mapping compared to reference SE T2 with the exception of the post-contrast tube of ultra-low T1 where the deviance was up to 16 ms [40.0%]. At 12 months, the phantom remained free of air bubbles, susceptibility, and off-resonance artifacts. The inclusion of HDPE beads effectively flattened the B0 and B1 magnetic fields in the imaged slice. Independent temperature dependency experiments over the 13-38 °C range confirmed the greater stability of shorter vs longer T1|T2 tubes. Excellent long-term (12-month) reproducibility of measured T1|T2 was demonstrated across both field strengths (all coefficients of variation < 1.38%).
Conclusion: The T2 mapping phantom demonstrates excellent structural integrity, B0 and B1 uniformity, and reproducibility of its internal tube T1|T2 out to 1 year. This device may now be mass-produced to support the quality assurance of T2 mapping in CMR.
Keywords: Phantom; Quality control; T1 mapping; T2 mapping.
© 2023. The Author(s).
Conflict of interest statement
The views expressed in this article are those of the authors who declare that they have no conflict of interest (financial or non-financial). W.P. is an employee of Resonance Health which is a medium commercial corporation.
Figures

References
-
- Moon JC, Messroghli DR, Kellman P, Piechnik SK, Robson MD, Ugander M, Gatehouse PD, Arai AE, Friedrich MG, Neubauer S, et al. Myocardial T1 mapping and extracellular volume quantification: A Society for Cardiovascular Magnetic Resonance (SCMR) and CMR Working Group of the European Society of Cardiology consensus statement. J Cardiovasc Magn Reson. 2013;15:92–92. doi: 10.1186/1532-429X-15-92. - DOI - PMC - PubMed
-
- Topriceanu C-C, Pierce I, Moon J, Captur G. T 2 and T 2⁎ mapping and weighted imaging in cardiac MRI. In: Magnetic Resonance Imaging; 2022:15–32. - PubMed
-
- Roy C, Slimani A, De Meester C, Amzulescu M, Pasquet A, Vancraeynest D, Vanoverschelde J-L, Pouleur A-C, Gerber BL. Age and sex corrected normal reference values of T1, T2 T2∗and ECV in healthy subjects at 3T CMR. J Cardiovasc Magn Reson. 2017;19:72–72. doi: 10.1186/s12968-017-0371-5. - DOI - PMC - PubMed
-
- Granitz M, Motloch LJ, Granitz C, Meissnitzer M, Hitzl W, Hergan K, Schlattau A. Comparison of native myocardial T1 and T2 mapping at 1.5T and 3T in healthy volunteers: Reference values and clinical implications. Wien Klin Wochenschr. 2018;131:143–155. doi: 10.1007/s00508-018-1411-3. - DOI - PMC - PubMed
Publication types
MeSH terms
Substances
Grants and funding
LinkOut - more resources
Full Text Sources
Medical
