

Temporal dynamics of the cecal and litter microbiome of chickens raised in two separate broiler houses
- PMID: 36935743
- PMCID: PMC10018173
- DOI: 10.3389/fphys.2023.1083192
Temporal dynamics of the cecal and litter microbiome of chickens raised in two separate broiler houses
Abstract
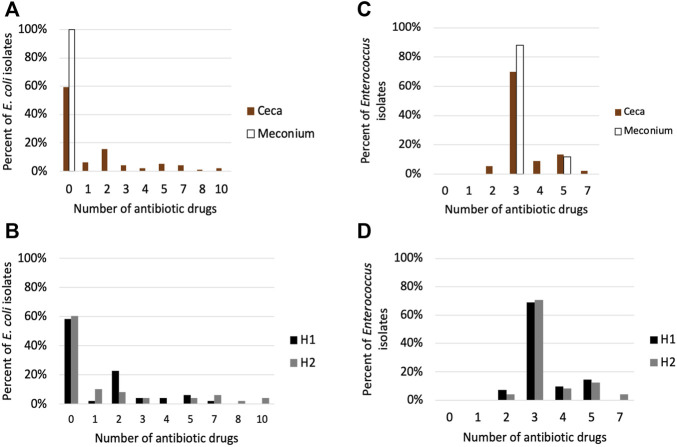
In this study, we investigated the dynamics of the ceca and litter microbiome of chickens from post-hatch through pre-harvest. To achieve this, six hundred one-day old Cobb 500 broiler chicks were raised on floor pens for 49 days in two separate houses. We performed short-read and full-length sequencing of the bacterial 16S rRNA gene present in the meconium and in cecal and litter samples collected over the duration of the study. In addition, we determined the antimicrobial resistance (AMR) phenotype of Escherichia coli and Enterococcus spp. isolated from the meconium and the ceca of 49-day old chickens. We monitored the relative humidity, temperature, and ammonia in each house daily and the pH and moisture of litter samples weekly. The overall microbial community structure of the ceca and litter consistently changed throughout the course of the grow-out and correlated with some of the environmental parameters measured (p < 0.05). We found that the ceca and litter microbiome were similar in the two houses at the beginning of the experiment, but over time, the microbial community separated and differed between the houses. When we compared the environmental parameters in the two houses, we found no significant differences in the first half of the growth cycle (day 0-21), but morning temperature, morning humidity, and ammonia significantly differed (p < 0.05) between the two houses from day 22-49. Lastly, the prevalence of AMR in cecal E. coli isolates differed from meconium isolates (p < 0.001), while the AMR phenotype of cecal Enterococcus isolates differed between houses (p < 0.05).
Keywords: antimicrobial resistance (AMR); broiler chickens; environmental condition; microbiome; pre-harvest.
Copyright © 2023 Zwirzitz, Oladeinde, Johnson, Zock, Milfort, Fuller, Ghareeb, Foutz, Teran, Woyda, Abdo, Looft, Lawrence, Cudnik and Aggrey.
Conflict of interest statement
The authors declare that the research was conducted in the absence of any commercial or financial relationships that could be construed as a potential conflict of interest. The handling editor BO declared a past collaboration with the author SA.
Figures


References
-
- Alloui N., Alloui M. N., Bennoune O., Bouhentala S. (2011). Effect of ventilation and atmospheric ammonia on the health and performance of broiler chickens in summer. Mortality 1 (10), 000.
-
- Archer G. S., Cartwright A. L. (2012). Incubating and hatching eggs. Texas: Agrilife extension.
-
- Baracho M., Nääs I., Betin P., Moura D. (2018). Factors that influence the production, environment, and welfare of broiler chicken: A systematic review. Braz. J. Poult. Sci. 20, 617–624. 10.1590/1806-9061-2018-0688 - DOI
-
- Berrang M., Cox N., Frank J., Burh R., Bailey J. (2000). Hatching egg sanitization for prevention or reduction of human enteropathogens: A review. J. Appl. Poult. Res. 9, 279–284. 10.1093/japr/9.2.279 - DOI
Grants and funding
LinkOut - more resources
Full Text Sources
Miscellaneous