

Prediction of postpartum hemorrhage using traditional statistical analysis and a machine learning approach
- PMID: 36935935
- PMCID: PMC10020099
- DOI: 10.1016/j.xagr.2023.100185
Prediction of postpartum hemorrhage using traditional statistical analysis and a machine learning approach
Abstract
Background: Early detection of postpartum hemorrhage risk factors by healthcare providers during pregnancy and the postpartum period may allow healthcare providers to act to prevent it. Developing a prediction model that incorporates several risk factors and accurately calculates the overall risk for postpartum hemorrhage is necessary.
Objective: This study used a traditional analytical approach and a machine learning model to predict postpartum hemorrhage.
Study design: Women who gave birth at the Khaleej-e-Fars Hospital in Bandar Abbas, Iran, were evaluated retrospectively between January 1, 2020, and January 1, 2022. These pregnant women were divided into 2 groups, namely those who had postpartum hemorrhage and those who did not. We used 2 approaches for the analysis. At the first level, we used the traditional analysis methods. Demographic factors, maternal comorbidities, and obstetrical factors were compared between the 2 groups. A bivariate logistic regression analysis of the risk factors for postpartum hemorrhage was done to estimate the crude odds ratios and their 95% confidence intervals. In the second level, we used machine learning approaches to predict postpartum hemorrhage.
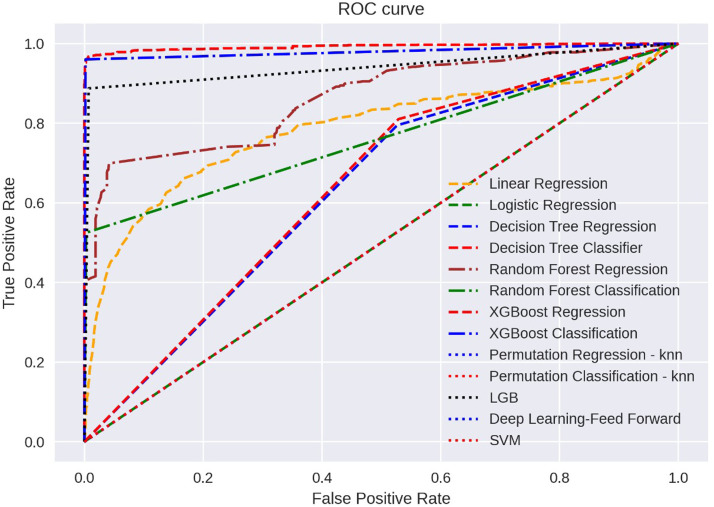
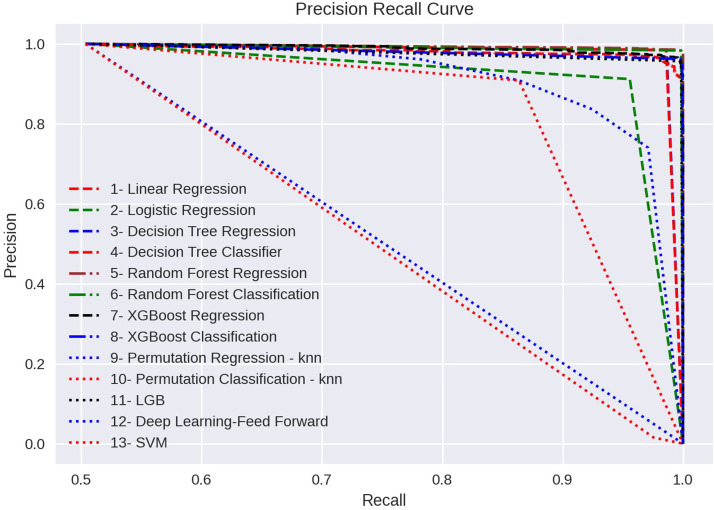
Results: Of the 8888 deliveries, we identified 163 women with recorded postpartum hemorrhage, giving a frequency of 1.8%. According to a traditional analysis, factors associated with an increased risk for postpartum hemorrhage in a bivariate logistic regression analysis were living in a rural area (odds ratio, 1.41; 95% confidence interval, 1.08-1.98); primiparity (odds ratio, 3.16; 95% confidence interval, 1.90-4.75); mild to moderate anemia (odds ratio, 5.94; 95% confidence interval 2.81-8.34); severe anemia (odds ratio, 6.01; 95% confidence interval 3.89-11.09); abnormal placentation (odds ratio, 7.66; 95% confidence interval, 2.81-17.34); fetal macrosomia (odds ratio, 8.14; 95% confidence interval, 1.02-14.47); shoulder dystocia (odds ratio, 7.88; 95% confidence interval, 1.07-13.99); vacuum delivery (odds ratio, 2.01; 95% confidence interval, 1.15-5.98); cesarean delivery (odds ratio, 1.86; 95% confidence interval, 1.12-3.79); and general anesthesia during cesarean delivery (odds ratio, 7.66; 95 % confidence interval, 3.11-9.36). According to machine learning analysis, the top 5 algorithms were XGBoost regression (area under the receiver operating characteristic curve of 99%), XGBoost classification (area under the receiver operating characteristic curve of 98%), LightGBM (area under the receiver operating characteristic curve of 94%), random forest regression (area under the receiver operating characteristic curve of 86%), and linear regression (area under the receiver operating characteristic curve of 78%). However, after considering all performance parameters, the XGBoost classification was found to be the best model to predict postpartum hemorrhage. The importance of the variables in the linear regression model, similar to traditional analysis methods, revealed that macrosomia, general anesthesia, anemia, shoulder dystocia, and abnormal placentation were considered to be weighted factors, whereas XGBoost classification considered living residency, parity, cesarean delivery, education, and induced labor to be weighted factors.
Conclusion: Risk factors for postpartum hemorrhage can be identified using traditional statistical analysis and a machine learning model. Machine learning models were a credible approach for improving postpartum hemorrhage prediction with high accuracy. More research should be conducted to analyze appropriate variables and prepare big data to determine the best model.
Keywords: analysis; machine learning; postpartum hemorrhage; risk factors.
© 2023 The Authors.
Figures
Similar articles
-
Machine learning-based prediction of postpartum hemorrhage after vaginal delivery: combining bleeding high risk factors and uterine contraction curve.Arch Gynecol Obstet. 2022 Oct;306(4):1015-1025. doi: 10.1007/s00404-021-06377-0. Epub 2022 Feb 16. Arch Gynecol Obstet. 2022. PMID: 35171347
-
Machine learning approach for the prediction of postpartum hemorrhage in vaginal birth.Sci Rep. 2021 Nov 19;11(1):22620. doi: 10.1038/s41598-021-02198-y. Sci Rep. 2021. PMID: 34799687 Free PMC article.
-
Application of machine learning to identify risk factors of birth asphyxia.BMC Pregnancy Childbirth. 2023 Mar 8;23(1):156. doi: 10.1186/s12884-023-05486-9. BMC Pregnancy Childbirth. 2023. PMID: 36890453 Free PMC article.
-
Machine Learning Methods for Predicting Postpartum Depression: Scoping Review.JMIR Ment Health. 2021 Nov 24;8(11):e29838. doi: 10.2196/29838. JMIR Ment Health. 2021. PMID: 34822337 Free PMC article.
-
Risk factors of major bleeding detected by machine learning method in patients undergoing liver resection with controlled low central venous pressure technique.Postgrad Med J. 2023 Nov 20;99(1178):1280-1286. doi: 10.1093/postmj/qgad087. Postgrad Med J. 2023. PMID: 37794600 Review.
Cited by
-
Maternal and Neonatal Outcomes of Iron Deficiency Anemia: A Retrospective Cohort Study.Cureus. 2023 Dec 30;15(12):e51365. doi: 10.7759/cureus.51365. eCollection 2023 Dec. Cureus. 2023. PMID: 38292987 Free PMC article.
-
Accuracy of machine learning and traditional statistical models in the prediction of postpartum haemorrhage: a systematic review.BMJ Open. 2025 Mar 3;15(3):e094455. doi: 10.1136/bmjopen-2024-094455. BMJ Open. 2025. PMID: 40032385 Free PMC article.
-
Prediction of postpartum hemorrhage (PPH) using machine learning algorithms in a Kenyan population.Front Glob Womens Health. 2023 Jul 28;4:1161157. doi: 10.3389/fgwh.2023.1161157. eCollection 2023. Front Glob Womens Health. 2023. PMID: 37575959 Free PMC article.
-
Machine learning-based approach for predicting low birth weight.BMC Pregnancy Childbirth. 2023 Nov 20;23(1):803. doi: 10.1186/s12884-023-06128-w. BMC Pregnancy Childbirth. 2023. PMID: 37985975 Free PMC article.
-
Predicting Intra- and Postpartum Hemorrhage through Artificial Intelligence.Medicina (Kaunas). 2024 Sep 30;60(10):1604. doi: 10.3390/medicina60101604. Medicina (Kaunas). 2024. PMID: 39459391 Free PMC article.
References
-
- Trends in maternal mortality: 1990 to 2015. 2015. Available at: http://www.who.int/reproductivehealth/publications/monitoring/maternal-m.... Accessed December 1, 2016.
-
- World Health Organization . World Health Organization; Geneva: 2018. WHO recommendations uterotonics for the prevention of postpartum haemorrhage. - PubMed
-
- World Health Organization. WHO recommendations for the prevention and treatment of postpartum haemorrhage. 2012. Available at: https://apps.who.int/iris/bitstream/handle/10665/75411/9789241548502_eng.... Accessed July 16, 2022. - PubMed
-
- Vahidi Farashah M, Etebarian A, Azmi R, et al. An analytics model for TelecoVAS customers’ basket clustering using ensemble learning approach. J Big Data. 2021;8:1–24. - PubMed
LinkOut - more resources
Full Text Sources
