. 2023 Mar 1:14:1141303.
doi: 10.3389/fendo.2023.1141303. eCollection 2023.

Effects of allicin on human Simpson-Golabi-Behmel syndrome cells in mediating browning phenotype

Affiliations

Effects of allicin on human Simpson-Golabi-Behmel syndrome cells in mediating browning phenotype

Uzair Ali et al. Front Endocrinol (Lausanne). .

Abstract

Introduction: Obesity is a major health problem because it is associated with increased risk of cardiovascular disease, diabetes, hypertension, and some cancers. Strategies to prevent or reduce obesity focus mainly on the possible effects of natural compounds that can induce a phenotype of browning adipocytes capable of releasing energy in the form of heat. Allicin, a bioactive component of garlic with numerous pharmacological functions, is known to stimulate energy metabolism.

Methods: In the present study, the effects of allicin on human Simpson-Golabi-Behmel Syndrome (SGBS) cells were investigated by quantifying the dynamics of lipid droplets (LDs) and mitochondria, as well as transcriptomic changes after six days of differentiation.

Results: Allicin significantly promoted the reduction in the surface area and size of LDs, leading to the formation of multilocular adipocytes, which was confirmed by the upregulation of genes related to lipolysis. The increase in the number and decrease in the mean aspect ratio of mitochondria in allicin-treated cells indicate a shift in mitochondrial dynamics toward fission. The structural results are confirmed by transcriptomic analysis showing a significant arrangement of gene expression associated with beige adipocytes, in particular increased expression of T-box transcription factor 1 (TBX1), uncoupling protein 1 (UCP1), PPARG coactivator 1 alpha (PPARGC1A), peroxisome proliferator-activated receptor alpha (PPARA), and OXPHOS-related genes. The most promising targets are nuclear genes such as retinoid X receptor alpha (RXRA), retinoid X receptor gamma (RXRG), nuclear receptor subfamily 1 group H member 3 (NR1H3), nuclear receptor subfamily 1 group H member 4 (NR1H4), PPARA, and oestrogen receptor 1 (ESR1).

Discussion: Transcriptomic data and the network pharmacology-based approach revealed that genes and potential targets of allicin are involved in ligand-activated transcription factor activity, intracellular receptor signalling, regulation of cold-induced thermogenesis, and positive regulation of lipid metabolism. The present study highlights the potential role of allicin in triggering browning in human SGBS cells by affecting the LD dynamics, mitochondrial morphology, and expression of brown marker genes. Understanding the potential targets through which allicin promotes this effect may reveal the underlying signalling pathways and support these findings.

Keywords: SGBS cells; allicin; lipid droplets; mitochondria; thermogenesis.


Conflict of interest statement

The authors declare that the research was conducted in the absence of any commercial or financial relationships that could be construed as a potential conflict of interest. The handling editor EKK declared a past co-authorship with the author MW.

Figures

Figure 1
Figure 1
Cell culture treatment protocol. Cells were grown to 90% confluence. Differentiation lasted 6 days supplemented with allicin treatment. From day 4, cells were incubated with allicin in maintenance medium. Cells were incubated with cAMP for 24 hours (from day 5 to day 6 of differentiation). Sampling and analyses were performed on day 6.
Figure 2
Figure 2
Results of lipid droplet analysis performed on SGBS cells. Boxplots show the median (horizontal lines), the first to third quartiles (box), and the most extreme values with the interquartile range (vertical lines). For all comparisons, differences between treatments on SGBS cells were statistically significant using the Kruskal-Wallis test and Bonferroni correction. (A) LD area per cell; (B) Maximum Feret Diameter (MFD) per cell; (C) Optical Density Intensity (IOD) per cell; (D) number of lipid droplets per cell in treated and CTRL cells.Representative confocal images of SGBS cells treated with allicin (ALLI), dibutyryl cAMP (cAMP), or control (CTRL) 6 days after differentiation and stained with BODIPY. Nuclear staining, DAPI. Images are representative of n. 15 biological replicates. ALLI, 12.5 µg/mL allicin-treated cells; CTRL, control cells; cAMP, 500 µM dibutyryl cAMP-treated cells.
Figure 3
Figure 3
Mitochondrial analyses. Differences in the distribution of mitochondrial morphological characteristics were analysed between cells incubated with ALLI and cAMP compared with cells from CTRL. (A) Average ratio of mitochondrial subtypes within each treatment. The Kruskal-Wallis test was performed between ALLI-treated cells compared with CTRL (**p < 0.01) and cAMP-treated cells compared with CTRL (*p < 0.05). Differences between ALLI-treated cells and cAMP were also detected († p < 0.05). (B) The ratio of the surface area was significantly higher in ALLI- and cAMP-treated cells compared with CTRL by 30.3 and 31.7%, respectively (p < 0.05). The average ratio surface area of large globules showed a significant (* † p < 0.05) decrease in ALLI-treated cells by 24.9 and 28.6% compared with cAMP-treated and CTRL cells, respectively. Mitochondria features determined using the Mitochondria Analyser tool. (C) Number of mitochondria. (D) Mitochondrial size measured by mean area. (E, F) Mitochondrial shape measured by mean aspect ratio and mean form factor. Boxplots showed the difference between medians (horizontal lines), first to third quartiles (box), and the most extreme values within the interquartile range (vertical lines) between treatments. Statistical significance in the boxplots was determined by the Kruskal-Wallis statistical test with Bonferroni correction (p < 0.0167). ALLI, 12.5 µg/mL allicin-treated cells; CTRL, control cells; cAMP, 500 µM dibutyryl cAMP-treated cells.
Figure 4
Figure 4
Summary statistics of mitochondrial network analysis performed with the MiNa tool on SGBS cells for each treatment. (A) Number of individual mitochondria. (B) Number of networks. (C) Mean value of rod/branch length. Boxplots show the median (horizontal lines), first through third quartiles (box), and the most extreme values with the interquartile range (vertical lines). The number of individual counts was statistically different in ALLI-treated SGBS cells from CTRL cells, using the Kruskal-Wallis test and Bonferroni correction (p < 0.0167). The number of networks showed no statistical difference. The mean length of rod/branch mitochondria significantly decreased in ALLI- (p = 0.035) and cAMP-treated cells (p < 0.046) compared with CTRL. ALLI, 12.5 µg/mL allicin-treated cells; CTRL, control cells; cAMP, 500 µM dibutyryl cAMP-treated cells.
Figure 5
Figure 5
Biplot of canonical discriminant analysis to visualize the information of the whole mitochondrial dataset in the treatments and controls. F1 and F2 are canonical discriminant functions, and the two-component model separated the treatments. Centroids are shown as yellow circles. ALLI, 12.5 µg/mL allicin-treated cells; CTRL, control cells; cAMP, 500 µM dibutyryl cAMP-treated cells.
Figure 6
Figure 6
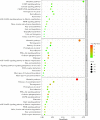
KEGG pathway enrichment analysis. Dot size represents the number of genes in each KEGG pathway; p.val (adjusted p-value): Red < orange < green. ALLI_cAMP = 12.5 µg/mL allicin-treated cells vs cAMP = 500 µM dibutyryl cAMP-treated cells; ALLI_CTRL = 12.5 µg/mL allicin-treated cells vs control cells; cAMP_CTRL =500 µM dibutyryl cAMP-treated cells vs control cells. Scatter plot was drawn by http://www.bioinformatics.com.cn/srplot.
Figure 7
Figure 7
PPI networks identified by cluster functional analysis constructed with up- and down regulated DEG targets to TFs and overlapping to ALLI and cAMP treatments vs CTRL. The enriched pathways are marked in different colors. (A) Cluster 1 with a MCODE score of 7.83 achieved from up regulated genes target of AR. Red: genes enriched in ‘PPARG signalling pathway’ (FDR 1.82-12); brown: ‘Positive regulation of cold-induced thermogenesis’ (FDR 4.05-10); green: ‘Fatty acid metabolic process’ (FDR 3.08-09); and blue: ‘PPARA activates gene expression (FDR 4.59-08). (B) Cluster 1 with a MCODE score of 10.47 achieved from up regulated genes target of PPARG. Red: genes enriched in ‘PPARG signalling pathway’ (FDR 3.10-13); brown: ‘Positive regulation of cold-induced thermogenesis’ (FDR 4.02-13); green: ‘Fatty acid metabolic process’ (FDR 5.23-13); and blue: ‘AMPK signalling pathway’ (FDR 5.53-12). (C) Cluster 1 with a MCODE score of 13.67 achieved from down regulated genes target of SP1. Red: genes enriched in ‘Interleukin-4 and Interleukin-13 signalling (FDR 3.32-13); green: AGE-RAGE signalling pathway in diabetic complications (FDR 4.42-12); blue: ‘Extracellular matrix organization’ (FDR 7.12-12).
Figure 8
Figure 8
Statistical significance of PROFAT prediction percentage of brown and white adipocytes was determined using Euclidean distance and complete linkage on normalized gene expression values and analyzed by statistical test-t. *** = p < 0.0001 between estimated percentage of brown cells; ### = p < 0.0001 between estimated percentage of white cells. ALLI, 12.5 µg/mL allicin-treated cells; cAMP, 500 µM dibutyryl cAMP-treated cells; CTRL, control cells.
Figure 9
Figure 9
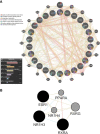
Preliminary PPI network constructed with GeneMANIA. (A) Twenty-six common targets between allicin, related fat-soluble organosulfur compounds and adipocytes-browning were built as assigned based on query gene. Genes are linked by functional associated networks filtered on their FDR score. Black nodes are the query targets and the larger the node, the higher degree of the node. The stronger interaction between node, the ticker and deeper colour of the edge. (B) Core PPI subnetwork generated by intersectional merge of PPI subnetworks according to the calculated degree, betweenness, closeness, eigenvector, LAC and network average values. ESR1, Estrogen Receptor 1; PPARA,Peroxisome Proliferator Activated Receptor Alpha; NR1H3, Nuclear Receptor Subfamily 1 Group H Member 3; NR1H4, Nuclear Receptor Subfamily 1 Group H Member 4; RXRA, Retinoid X Receptor Alpha; RXRG, Retinoid X Receptor Gamma.
Figure 10
Figure 10
Bubble plot combined with Sankey diagram showing statistically significant Reactome pathways and the genes within each pathway. Figure was plotted by http://www.bioinformatics.com.cn/srplot.

Similar articles

Cited by

References

    1. Oliver P, Lombardi A, De Matteis R. Editorial: Insights into brown adipose tissue functions and browning phenomenon. Front Physiol (2020) 11:219. doi: 10.3389/fphys.2020.00219 - DOI - PMC - PubMed
    1. Wu J, Boström P, Sparks LM, Ye L, Choi JH, Giang AH, et al. . Beige adipocytes are a distinct type of thermogenic fat cell in mouse and human. Cell (2012) 150:366–76. doi: 10.1016/j.cell.2012.05.016 - DOI - PMC - PubMed
    1. Montanari T, Pošćić N, Colitti M. Factors involved in white-to-brown adipose tissue conversion and in thermogenesis: A review. Obes Rev (2017) 18:495–513. doi: 10.1111/obr.12520 - DOI - PubMed
    1. Manríquez-Núñez J, Ramos-Gómez M. Bioactive compounds and adipocyte browning phenomenon. Curr Issues Mol Biol (2022) 44:3039–52. doi: 10.3390/cimb44070210 - DOI - PMC - PubMed
    1. Amagase H. Clarifying the real bioactive constituents of garlic. J Nutr (2006) 136(3 Suppl):716S–25S. doi: 10.1093/jn/136.3.716S - DOI - PubMed

Supplementary concepts